
Stitch Maps
I wrote about this briefly in a recent WWW post.
Tech editor and author extraordinaire JC Briar has recently launched a revolutionary new charting tool – Stitch Maps.
JC has been thinking about charts for a long time. She is the author of Charts Made Simple, an excellent little book explaining all about knitting charts, how to work from them, and how they work. Her experience writing this book, and teaching and editing, had led her to see that there is an inherent weakness in knitting charts: although they represent the stitches, they don’t necessarily represent the fabric.
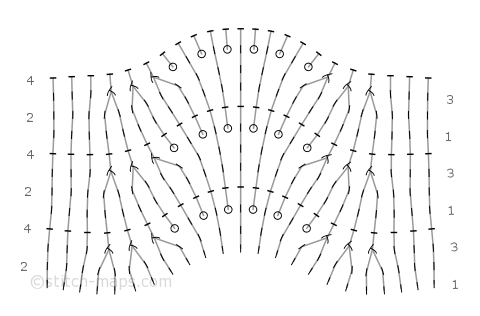
Let’s take Feather and Fan for example: because of the pattern of increases and decreases, the fabric scallops. But you don’t see that in a traditional chart.
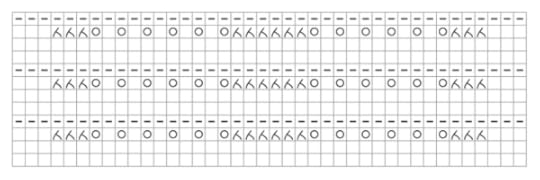
Straight chart. (Chart courtesy JC.)
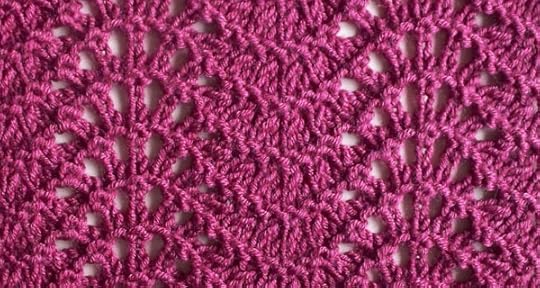
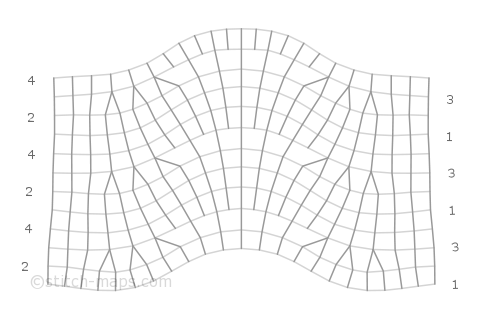
Wavy fabric. (Image courtesy JC.)
JC’s Stitch Map charts – freed of the constraints of the grid – show the flow and shape of the fabric.
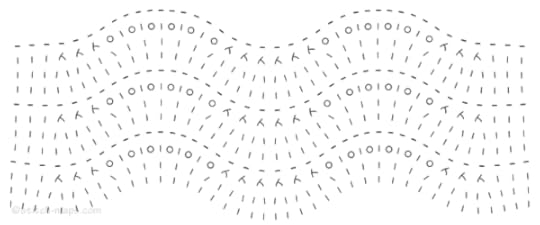
The way it really is. (Image courtesy JC.)
I had the opportunity to sit down and chat with JC about her project last month.
This new approach to knitting charts was inspired by crochet charts. Crochet charts do a much better job of representing the shape and flow of the fabric, as there are no grids. In knitting charts, rows are perfectly horizontal, whether they are in reality or not. So JC took the grids away! She said that she’d been creating charts in this gridless style on her own for some time – she used them as a design and editing tool, to check stitch patterns and fabrics.
She realized that if they were helpful to her, they were probably helpful to others, too. And so: Stitch Maps launched earlier this summer.
These new-style charts really come into their own for lace and other increased/decreased fabrics. Traditional charts continue to be a great solution for colorwork and cabled fabrics, as rows remain straight.
But for such changing fabrics, the type of visualization is immensely helpful – you can see not only how the fabric behaves, but also how the stitches interact. When working a decrease, the Stitch Maps charts show you which stitches are being worked together; and placing an increase shows you which direction the stitches shift. They allow you a better sense of what you’re working on, and also make it easier to identify where to place markers – a constant struggle for lace knitters.
The tool is available as an online application. It’s free to create and print charts; a $15 a year subscription allows you to create private charts, and gives you tools to help you work with them – the ability to place vertical or horizontal lines to help you analyze the fabric – and keep track of your work.
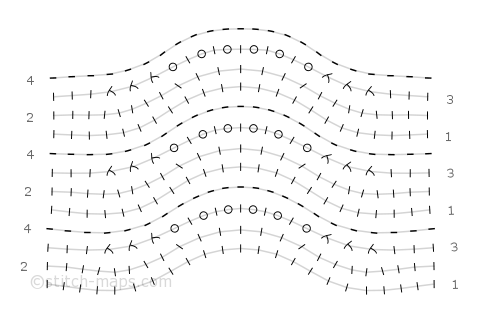
Horizontal lines indicate the rows…
vertical lines show you how the stitches move and interact.
You can even remove the stitch symbols for a completely different view.
JC has developed a fantastic tool, and I’m very excited about the possibilities for its use…
A $60 subscription allows you to create publication-quality images, for designers and tech editors to include in online or print publication. More info on the subscriptions here.
What do you think? Would you like to see these charts used in patterns?


Mandy Moore's Blog

- Mandy Moore's profile
- 6 followers

