5 things my sales graphs reveal
Or: The grand graph experiment continues
by Thea Atkinson
OK. So you know I love me some graphs. I’ve blogged about it before. And as I blogged I started thinking about how my blog affected my sales. You know, you read the post.
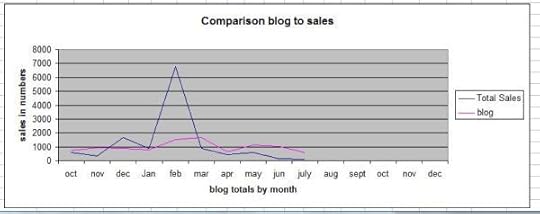
Well, I got to working on a better graph, one that plotted my total sales for a day compared to my blog posts. Some astonishing things leapt out at me…especially when I plotted month by month versus overall time.
First, my overall graph.
What does it tell me?
That the blog visits/posts and my sales are definitely linked somehow.
That in the beginning, when I didn’t post regularly (the first section of the graph) there really was no correlation
As I began to gain audience and gain some regularity, the sales seemed to echo the spikes in traffic to my blog
You might not be able to tell here, but the upticks are definitely trending to just after a spike in blog visits
After I gave away about 6500 copies of One Insular Tahiti, (available from Amazon, Kobo, and BN, and Itunes) my blog traffic increased. That was also right around the time I made an effort to post frequently.
The graph may tell you different things; heck, I’m not a stats analyzer and I have no idea what to do with the information except to try to build my blog audience and post regularly.
What would your graph say? Have you created one? I challenge you to compose a graph and track your traffic and sales and then write a post about it.
Stay tuned for June and July graphs!
-30-
If you liked this post, please do share.
Remember: Rattling Bones is FREE on Kobo and Smashwords. Grab a copy and spread the word.
Thea is the author of several novels that she considers left of mainstream. You can find her on Smashwords, BN, Kobo, Sony, Apple


Related articles
Have you tried Graphing your book sales? (theaatkinson.wordpress.com)
Reading graphs can be tricky (learnandteachstatistics.wordpress.com)
Kobo readers prepare your Kobo readers (theaatkinson.wordpress.com)
Filed under: Thea bits


