How to Connect Autodesk Construction Cloud and Microsoft Power BI
I’ve been told it’s difficult and — honest to God — it’s not. It’s just incredibly convoluted and, as it often happens with both Microsoft and Autodesk, stuff isn’t where you expect it to be. So here’s a quick guide on how to pull data from your project into Microsoft Power BI. You can stop reading right away if:
You don’t know what Power BI is. It might be a little too soon for you: try and get your basics straight and then come back.You have no familiarity with the Docs module of Autodesk Construction Cloud. Again, find your footing and then return here.You aren’t Project Admin of at least one project on Autodesk Construction Cloud: you won’t be able to publish data. We’ll need Docs and Insight, so make sure you have them enabled on the project you want to use.You are not the Admin of your own computer. While I have a workaround for this, I strongly suggest you go and have a chat with whoever won’t trust you to do your job on the tools your employer assigned you — if you’re a BIM/CDE manager or a BIM coordinator, I mean — and, depending on the outcome, ponder on your life choices.If you’re still reading, congratulations: you’re a real boy.
 Very much not like the BIM manager who can’t try tools and still is expected to optimise the design and construction process.Stage 1: the Connector
In order to pull stuff from your Autodesk Construction Cloud projects into Power BI, you’ll have to download a couple of things. The first one is the official Autodesk® Data Connector for Power BI, which can be found at this address.
 Click “download” and you’ll be redirected to a page where you’ll be asked to log-in into your Autodesk Account;Do that and follow through all the steps: they have a 2-steps verification now, so you might need to have access to your e-mail but we’ve already established you have agency upon your own life, so that shouldn’t be a problem;Apparently, you’re redirected to the same page and nothing happened, but you’re now logged in (and you can see it from the ribbon above). If it didn’t ask you to log in, it’s probably because you told the system to try and remember you for 5 minutes straight. The important thing is that you can see your username on the ribbon above.
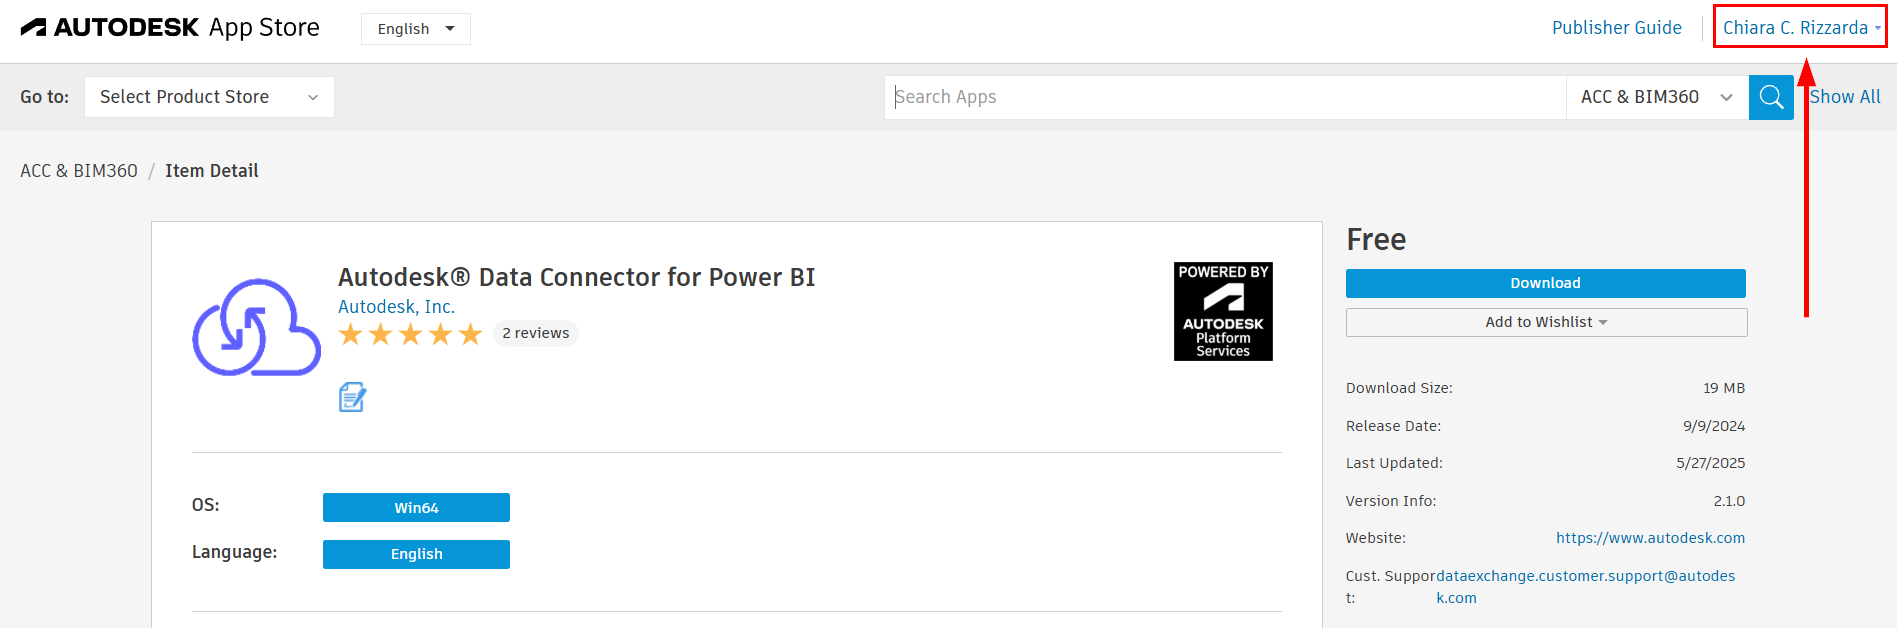 Now you can actually download it.
Download the Exe and run it. This will actually download two things:
the Data Connector, which will enable Power BI to load data from your ACC projects;the Model Viewer Visualisation, which we’ll use to visualise your models directly within the Power BI interface (or at least we’ll try).If you’re having trouble with this step, take a look at the Autodesk Installation Guide (until they change all the permalinks all over again and all these community-drafted tutorials become useless).
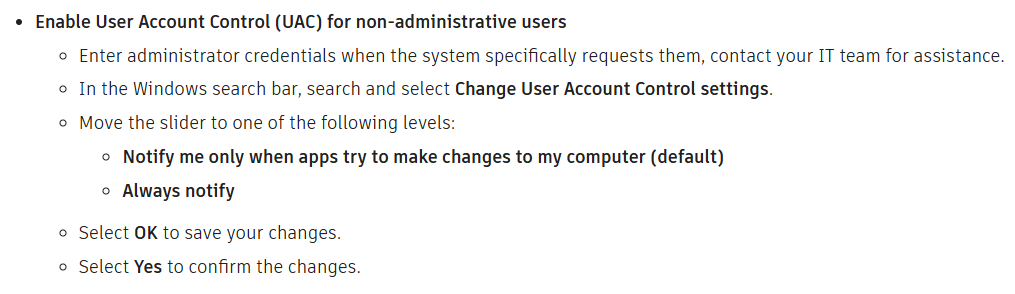 If you aren’t the Admin of your computer, the guide provides a workaround for that too, but you’ll have to catch your IT and bind it with a spell first.Stage 2: the Void
You might think: “this is it, that was easy”. According to the feedback I got, this is where people stop, so let’s try not to stop here but first let’s wee what’s stopping them.
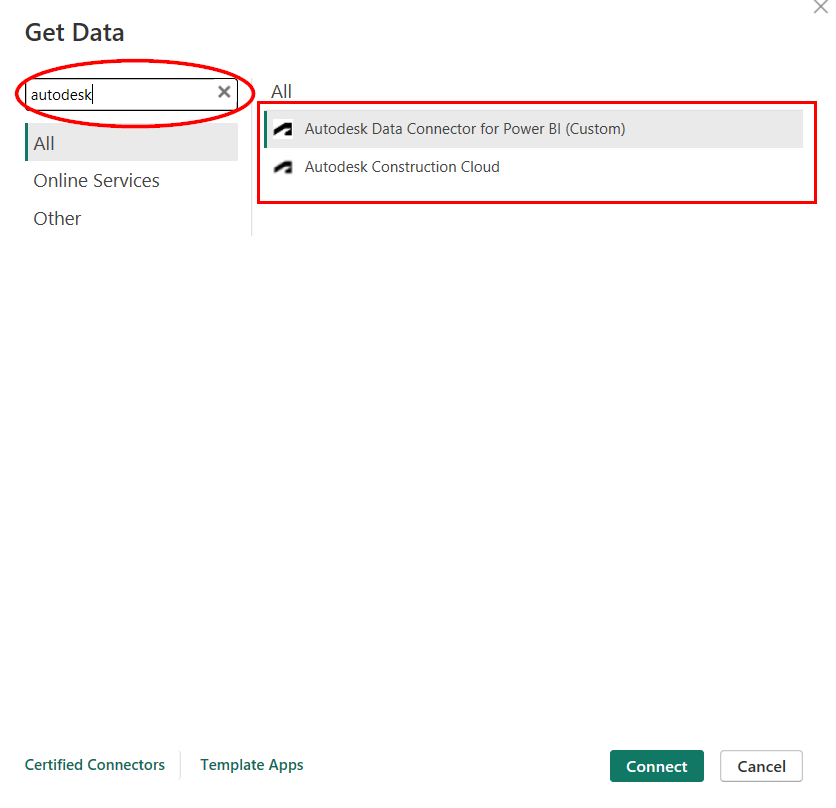
1. You open Power BI Desktop just like any other day and start a new report by getting data from another source.

2. In the Get Data panel, you can type Autodesk or browse until you find these two: a thing called Autodesk Data Connector for Power BI (Custom) and a thing called Autodesk Construction Cloud. This first time, you might want to select the second option: Autodesk Construction Cloud.
3. Select the region your projects are located. Autodesk provides the possibility to host data on servers based on their geographical area, and some people have been whining on LinkedIn about it, because the data cannot be transferred from one server to the other. I’d like to remind these people that there is such a thing as war, and I wouldn’t want to host data about my hospitals on the land of someone who might decide to bomb them. I wish we’d live in a better world. We don’t. I pick Europe, you pick yours.

4. You’ll see a list of the hubs you’ve been invited as an administrator and — by clicking on the + symbol at the left of the name — a choice between Account Extracts and Project Extracts. Let’s start with Project Extras: we’ll get to the first one later.
 Pardon my redacting: people seem to think their stuff is super-secret…
5. At this point you can browse through your projects and you should be able to see your stuff. However, no matter how data-rich your projects are, this is what you’ll get:
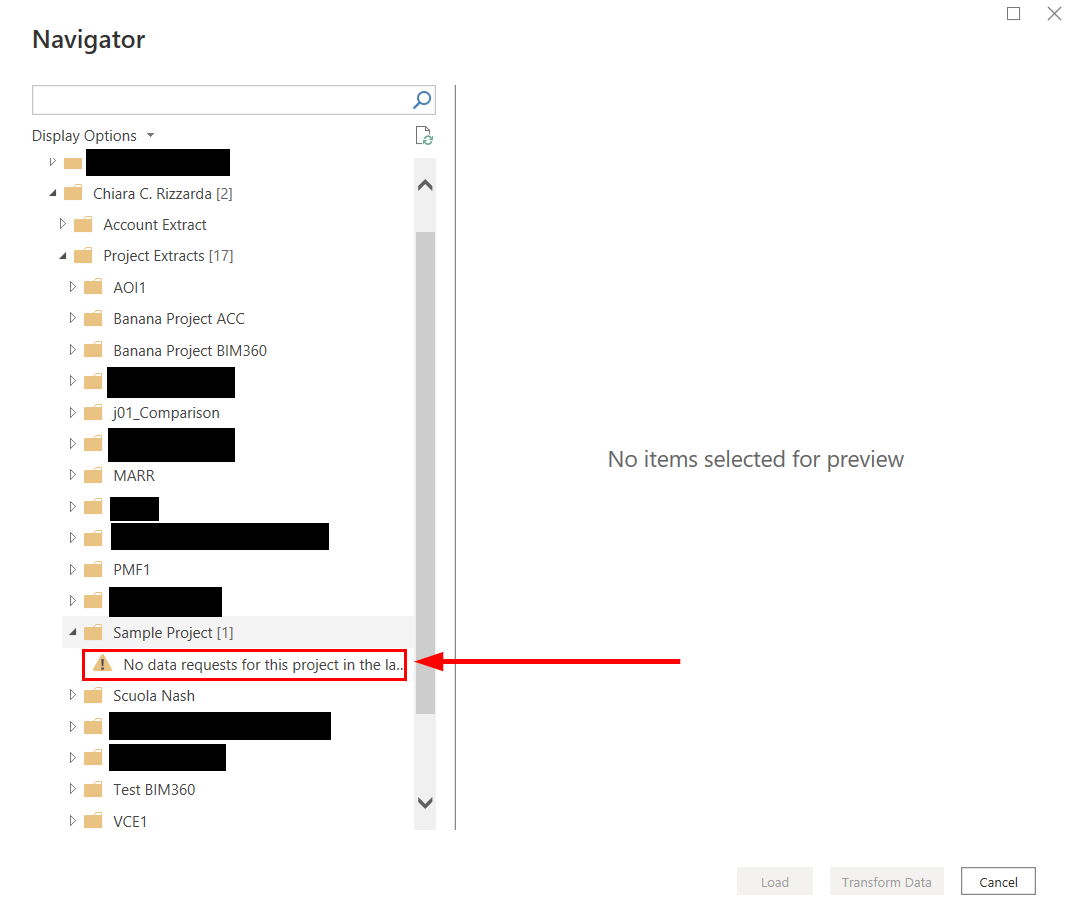
Any attempt to select below the project name will result in this error.

DataSource.Error: No data requests for this project in the last 30 days. Users with project admin access can request data from Autodesk Data Connector.
 You’ve established your connection, but The Void is staring back at you.
This is where some of my students stopped. Who should require what and where?
Don’t worry.
I’ve got you.
 I’ve got you…Stage 3: This is the Way
Well, at least one of the ways.
To publish data from a view of your Revit model (and I stress, this’ll only work from a native Revit file on Autodesk Construction Cloud Docs: no dwgs, no ifcs, no nwds, no nothing), you’ll have to:
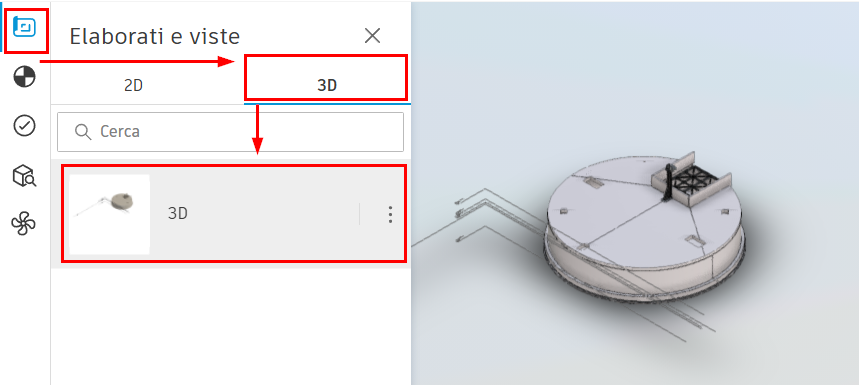
Create a 3d view in your model, appropriately cropped and filtered, and make sure it’s selected for publishing when you upload the file on Docs (if you don’t know how to do that, take a look at the official guide);Note: the default 3d view is usually selected for publishing, unless your BIM Coordinator hates your guts and has removed the option for reasons unbeknown to you commoners.Have the file uploaded on Autodesk Construction Cloud and find it in the browser;Click on the filename and open the preview;Click on the upper left button to browse all published views in the uploaded model and click on the 3d tab: you’ll find the 3d view you’ve published (if you don’t, it’s either you haven’t selected it for publishing, you haven’t published it or a mixture of both).
 If you’re one of my clients, this might or might not be your mixing tank.
Now for the last part. D’you see those three dots on the side of the view name? Click them.
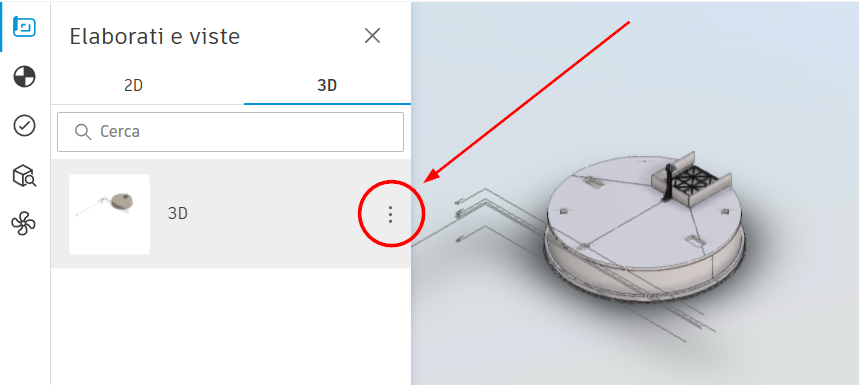 Yes, I’m not shitting you: it’s those three things. It’s Autodesk’s first rule of user interface: the smaller a thing is, the more crucial it is to make sure the big ones actually work.
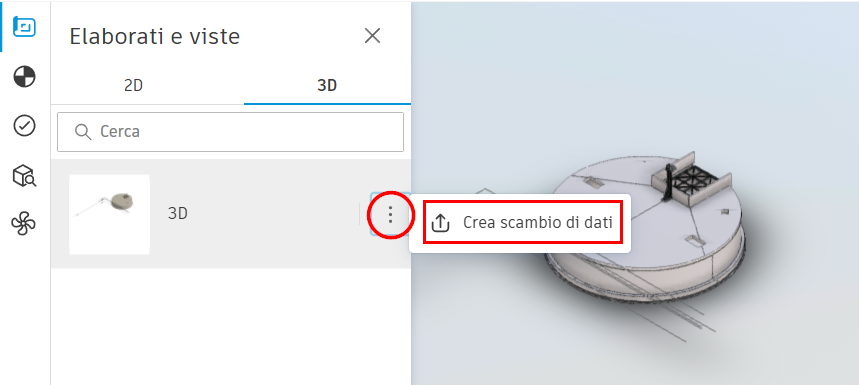
You’ll have one only option and it’s the one you need: Create Data Exchange.
 3.1. Errors you might get
There’s a couple of things that might go wrong here: one is quite common, the other’s a weird one.
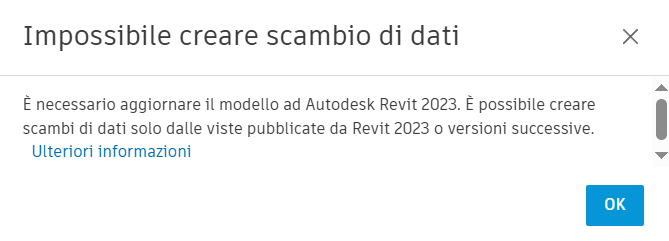
Problem 1: you’re old. Or at least, your model is. The Data Connection can only be created from Revit 2023 onwards: if your model is older, you’ll get the suggestion to update it. For sanity’s sake, don’t. Never upload a Revit model unless you get a hologram form a priness dressed in white who states it’s your only hope.
Problem 2: the view isn’t actually published. This is the weird one, as you shouldn’t be able to see the view on Docs at all, and it took me a while to recreate it, but apparently it happens if the view has been selected for publishing, the model has been uploaded and published, but then the view was unselected in another upload of the model. What you’re seeing is the ghost of the view.
 Promise me / When you’ll see / A 3d view you’ll think of me…Stage 3: This is the (other way)
With the first option, you’ve effectively pushed a 3d view (and all data it contains) towards Microsoft Power BI. But what if the data you’re looking for isn’t in the view of a model? What if you want to analyse data on document uploads, ongoing issues, clashes and so on? That’s where the second way comes in.
 This is the (other) way.
For the second way, you’ll need the Insight module of Autodesk Construction Cloud and it’s free but you might not have it enabled because your CDE manager hates you or because you hate yourself (for some reason, I lock myself out of Insight every single time).
You can reach it through the pull-down menu by clicking on Docs on the upper-left corner. It’s down there alongside all the rest of the modules that are enabled on the project.
 If you don’t know how to enable modules on a project (or if your CDE manager tries to bullshit you), here’s a guide on how to do it.
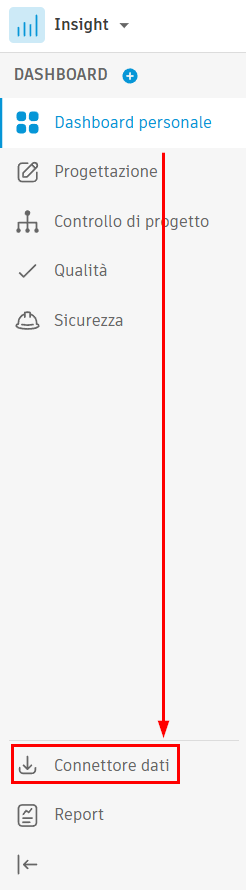
Insight does its thing and we might get onto that later, but for now all that needs your attention is the Data Connector at the bottom of the sidebar. It looks like it’ll try to download stuff but it won’t.
The Data Connector page will offer a couple of options, including the one to use a Power BI Template, but as a first start I recommend a manual extraction, just to see what our options are, so you’ll want to click on “Execute Extraction” (or whatever’s the name in English, since Autodesk won’t let me change the language of my interface regardless of EVERYTHING ABOUT BE being in English, from my OS to my deeper thoughts).
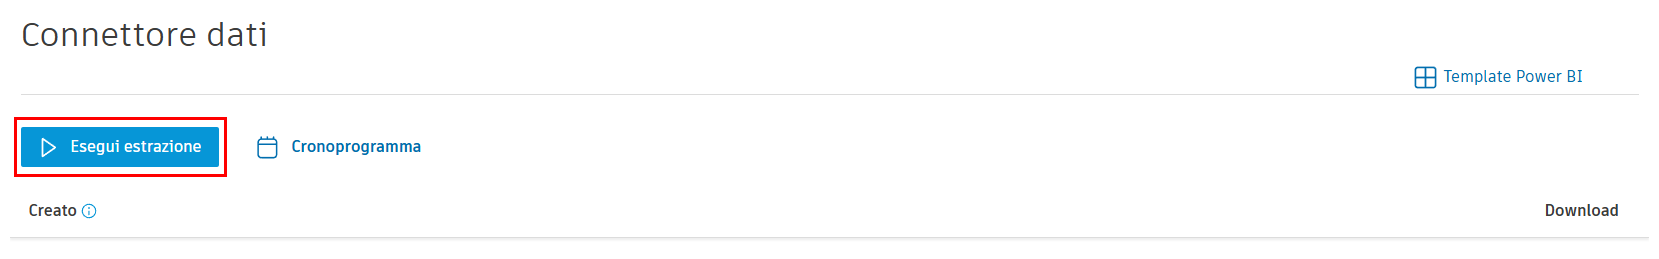 Hit the Blue Button
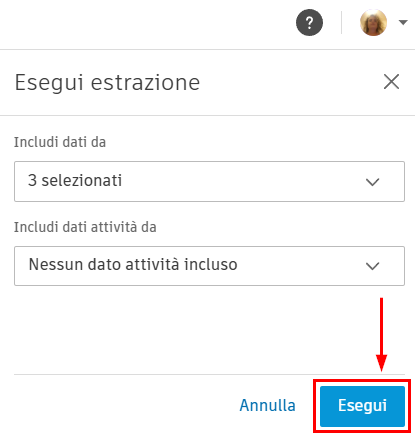
A sidebar will sweep in from the right, like a hero coming from the city in a Greek drama, asking you what kind of data will you want to extract, and it’ll offer you different options: you’ll have data on Issues and Documents, Clashes (provided a coordination space has been set up), Approval workflows and Markups.

I strongly advise you against picking “Select All”, as this might take a while: if you’re running a test, select something that’s actually significant in the way you’ve used ACC on the project. If you only used it a document repository, pick Documents (ACC) and leave the rest. Please.
In the second scroll-down menu, you’ll be able to set up a timeframe (or not). If this is your first time, you might want to leave it empty but consider that the longer people have been using ACC on the project the more data you’ll have to process. When this will become a regular habit of yours, you’ll have a specific timeframe in mind. Hopefully.

When you’re done setting up things, hit the Run button at the bottom of the page.
The system warns you it might take a while by default, even if you’re running a fake test on a fake project called Banana Project just for the sake of having a clean screenshot.
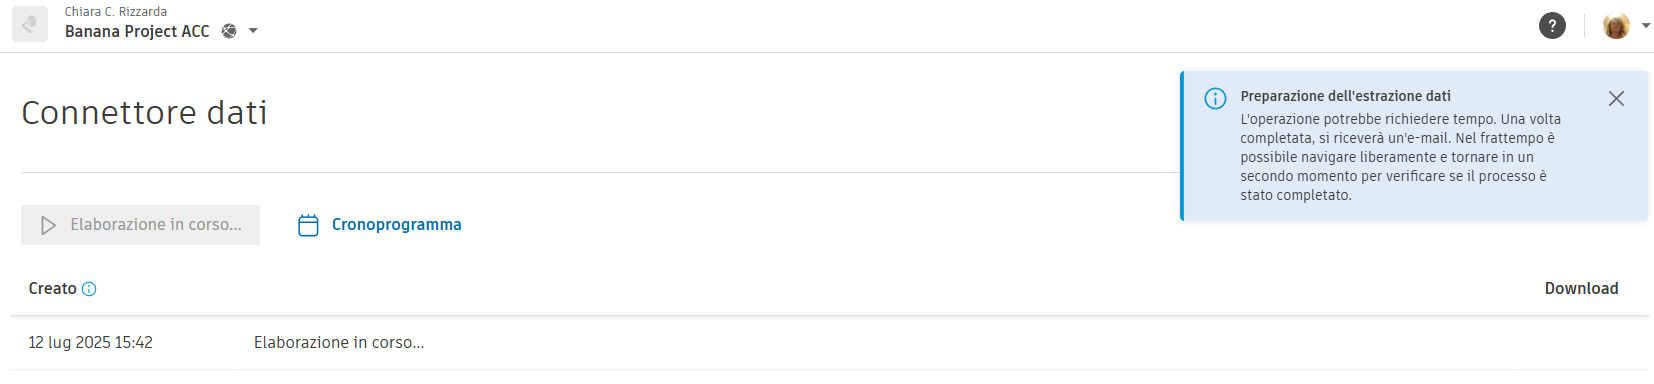 Just saying…
They will send you an e-mail when they’re done, whether you like it or not, so you can go and have a drink while you’re waiting. I won’t judge you.
 Yes, darling, I know. I was still looking at the page.
When it’s done, the report will be listed in the page alongside every other report you’ll run. At this point, you might be tempted to download the fat zip file Autodesk created for you, unzip it and manually import it into Power BI. Please don’t. You’re done. Leave this accursed place and go back to Power BI Desktop because we have the connection.
 Leave this place. We’re done here.Stage 4: Back to Where We Started
Remember where we dropped off? We stared at the void of the Autodesk connector, and the void stared back at us. Well, no more of that. If you go back to your Navigator, you’ll see a bunch of tables under the project.
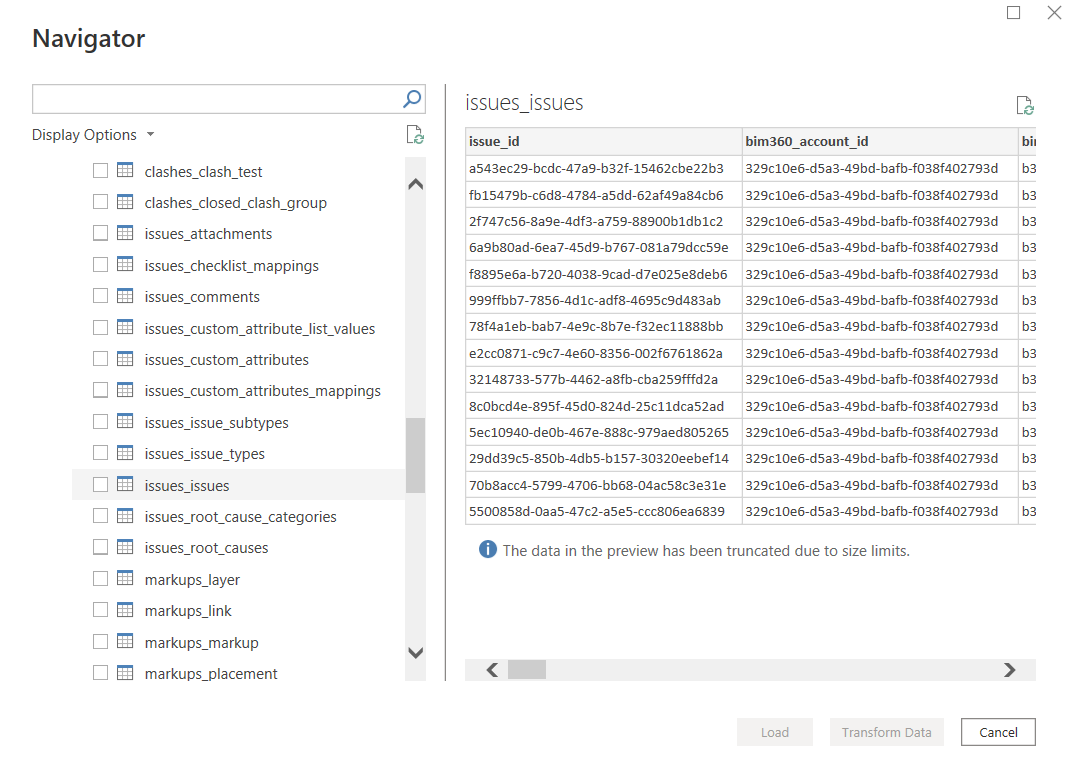 Once you’ve selected the table, you can either load it and then transform it with a Power Query or you can transform it before loading it. But that’s not why we’re here.
Before selecting one table, use the preview and make sure it actually contains something…
4.1. What about my 3d View?Fair question. In order to get data from the 3d view we previously published, you need to get data not from Autodesk Construction Cloud but using the Autodesk Data Connector for Power BI.
In the next panel, you’ll have to select:
the Source Type (you’ll probably have no other option than Data Exchange);optionally the unit of length (a set of choices between metric and Imperial) if you want data in a different format than the project settings;the possibility to include filters and, if you want, the URL of the view.
Just select Source Type and hit Ok.
The rest carries on pretty much in the same way: you’ll find yourself staring at the Navigator, you’ll have to browse through your hubs and then through your projects, and the view you published will eventually be visible.
Note: the preview will be in tabular form, and truncated.

Select the view and hit Load. It might take a while.
 4.2. But I want to see it!
By now, you’ll have imported a tabular view of your model, which isn’t pretty.
 Remember: this is how Revit sees things. No wonder it’s cranky.
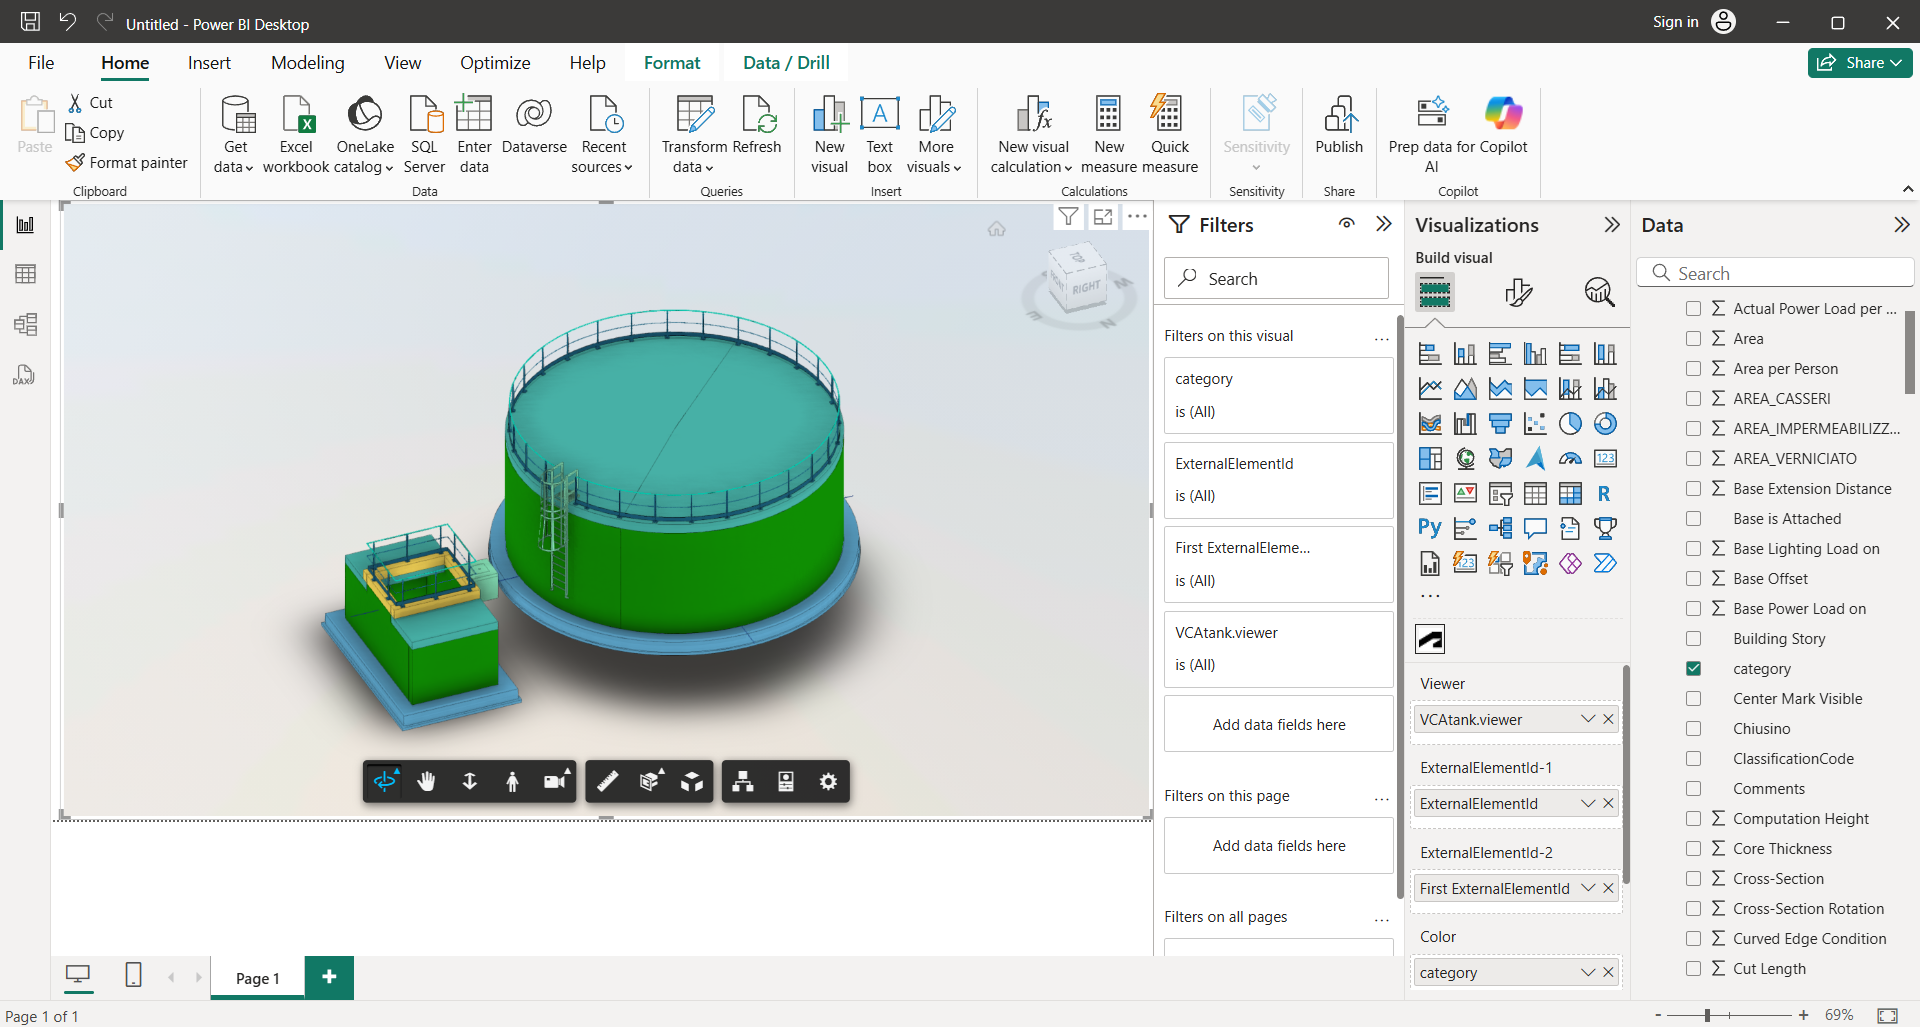
In order to visualise your model, you’ll have to create a visual just as you would for a pie chart, so hit the Report View on the left bar of your interface, and you’ll find yourself here.
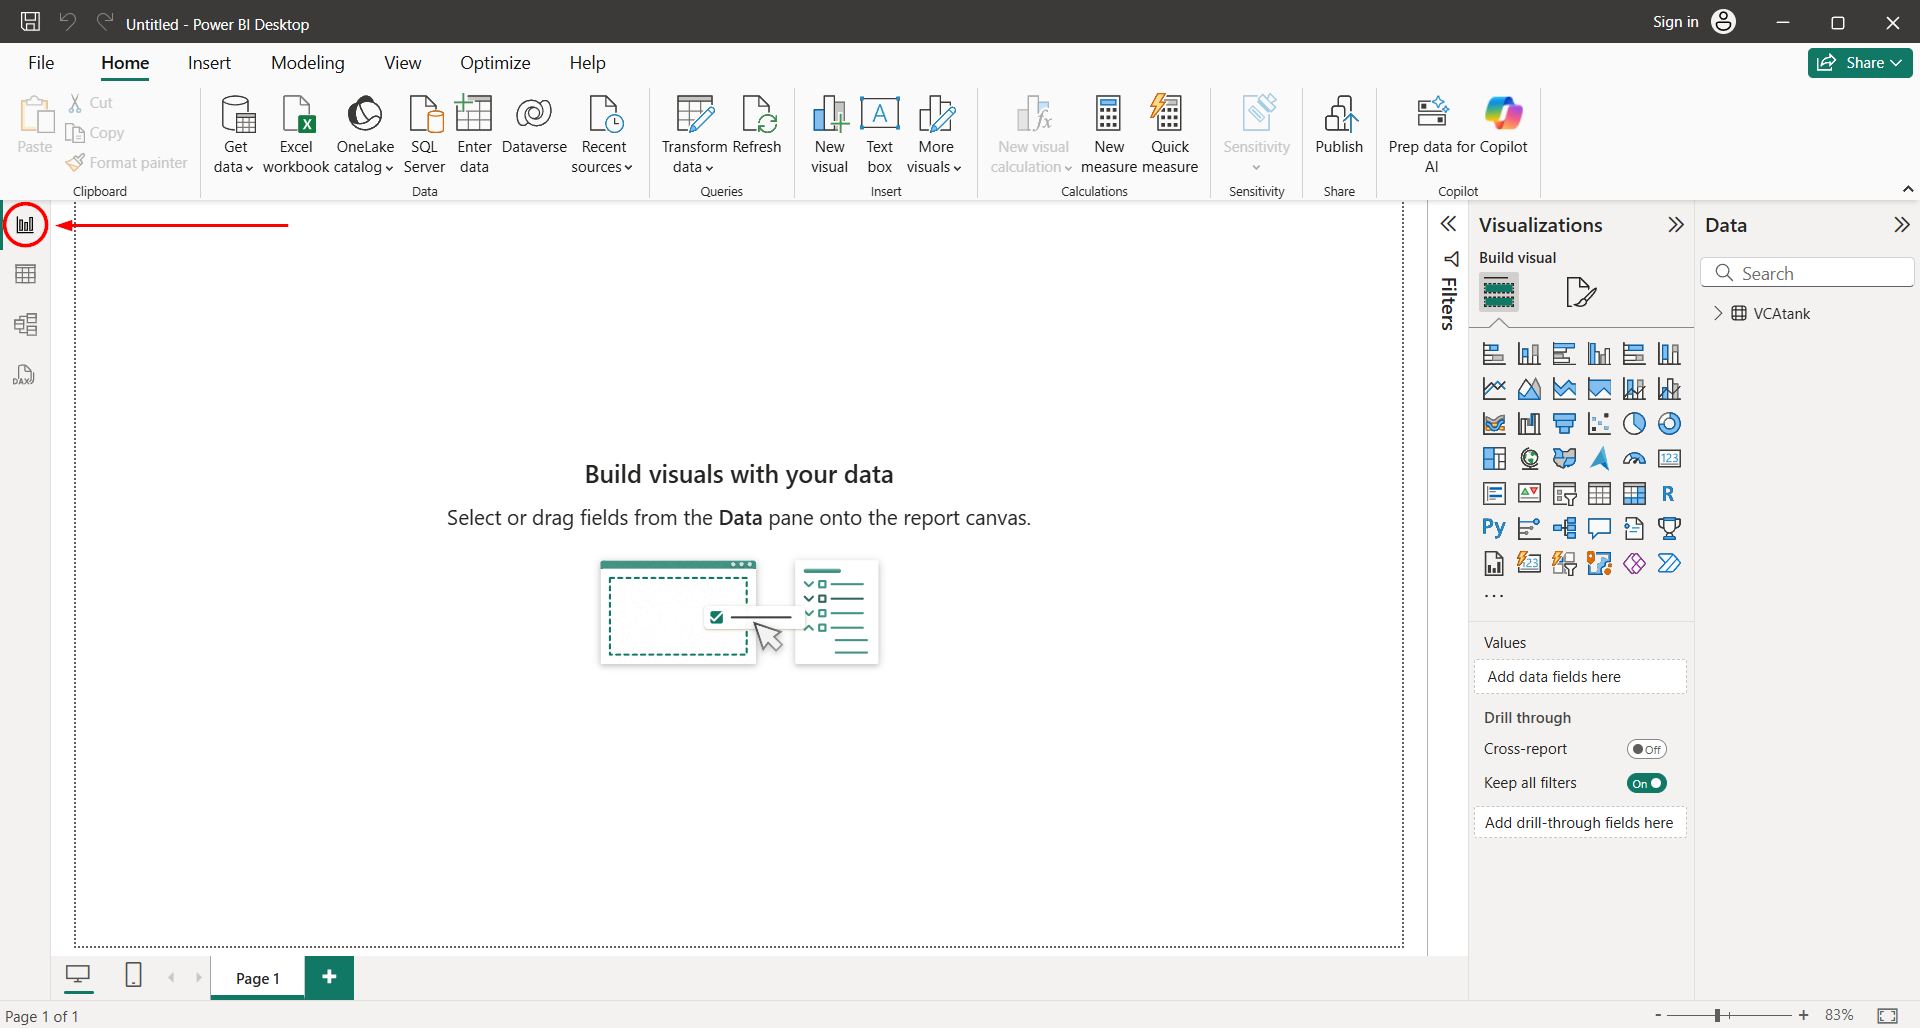
Now, the visual you need should be in the side panels, together with all other chart types, but you won’t find it unless your IT really loves you and has installed a certain file somewhere. The file is AutodeskDataConnectorforPowerBI.pbiviz, and it’s a custom visualisation file: it should be in a Power BI folder under WindowsApps in Program Files, which is a folder buried so deep and protected by so many layers that even I can’t access it on my own computer because being an Administrator is actually not enough.
 If I wanted to be locked out of my own computer for my own good, I’d use Apple
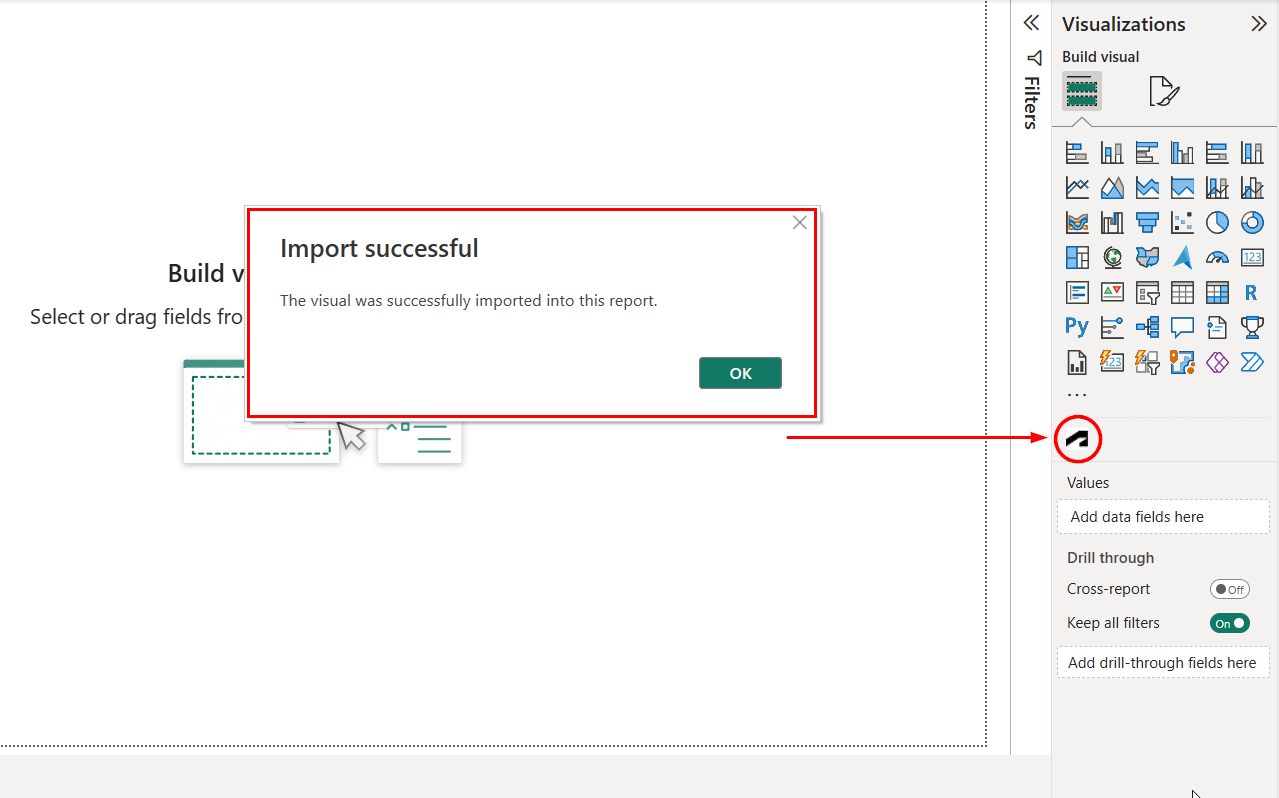
No worries. This just means you won’t have the visualisation by default, but you can still load custom visualisations in any Power BI file through the Get More Visuals -> Import a Visual from a File option, which you’ll find by clicking on the three dots under the available charts.

Browse until you find the AutodeskDataConnectorforPowerBI.pbiviz file (it should be under Documents\Power BI Desktop\Custom Visuals). If everything goes according to plan, you’ll get a very happy message, and a tiny button with the Autodesk logo will be added under the others.
Once you hit the button, you’ll need to follow the steps it gives you, and you can read them below since you lose them the moment you execute the first one.
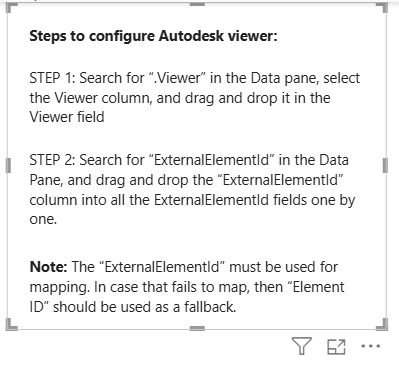
Step 1: search for [ViewName].Viewer in the Data pane and drag it into the corresponding field.
 This one goes here
Step 2: drag and drop ExternalElementId for mapping, as many times as it asks (it might be 2, it might be 3, because of… reasons).

In the colour field, you can drag any parameter you want to use to colour the view (Category is a classic, for instance, or leave it empty to colour by material and object styles.
You are done. You can start messing around with your data and your 3d view. You’re welcome.