NEW DATA - Upper-Middle-Class Takes A Punch But Resumes Growth

Last week, I updated the analysis of a massive piece of Census analysis I did in 2022 and shared it with you all. I thought updating the chart through 2024 using the Community Population Survey data would be fun - making a little snack for everyone.
Oops.
Instead of having fun, I spent most of yesterday pulling and re-pulling the data from the IPUMS portal (a website where you, too, can pull your own raw, cross-tabulated US Census data!). And triple-checking my work. This “fun” was a reminder that the only difference between an amateur and a professional is that the professional assumes they made mistakes, looks for them rigorously, discovers them quickly, and fixes them.
And so I suffered the professional route.
The chart I published in 2022 (i.e., last week) used inflation data that is now moot. That is why the data for 2020 and 2021 are different. I forgot about this last week when I hit “publish.” So, our story from 2020-2024 has shifted.
Note: the analysis here does not follow the same individuals over time. It follows an SES group - i.e., adults aged 18+ holding college degrees or higher in educational attainment and earning $100K in 2019 equivalent personal income. This income threshold has moved up to $125K personal income for all sources (including retirement, gambling, etc.) It's personal income (INCTOT), though, not household income. A dual-income upper-middle-class home today must pull in $250K or more to qualify.
Who are these fancypants people, you ask? Well, people like me who got fancy letters to add to their names and who managed to monetize these degrees eventually (I thought I never would for about five years). PhDs today, for example, almost all make $100K or more if employed full-time outside of academia.
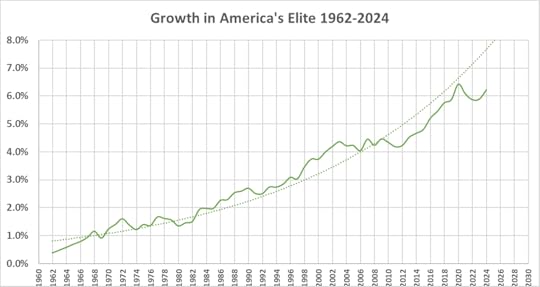
Enough background. Here’s the updated trend in the proportional size of America’s upper-middle-class. Wow.
 Sarah Flood, Miriam King, Renae Rodgers, Steven Ruggles, J. Robert Warren, Daniel Backman, Annie Chen, Grace Cooper, Stephanie Richards, Megan Schouweiler, and Michael Westberry. IPUMS CPS: Version 12.0 [dataset]. Minneapolis, MN: IPUMS, 2024. https://doi.org/10.18128/D030.V12.0; my analysis of extracted data
Every time I look at this chart, I picture the Capitol from Panem. You’ll recall that Panem reacted to an American civil war with fascism, not reconciliation or a New Deal. The totalitarian state in The Hunger Games not only concentrated its elite in one Capitol City, it also ensured that any hint of poverty or struggle remained well beyond its fortified walls. Squeaky clean. The world’s largest gated community.

Americans, like our counterparts in India, Indonesia, or Ecuador, just live in elite enclaves and drive right by and ignore the homeless, the poor, and the forsaken.
The long-term growth in America’s upper middle class is nonlinear, doubling first by 1967 (0.8%), then again by 1983 (1.6%), again by 1999 (3.2%), and most recently by 2024 (6.4%).
America’s upper-middle-class is returning to its long-term growth trend (based on sources of income, not unrealized investment earnings or property wealth). It will be 8% of the general population by 2028.
It’s like severe obesity for an entire class system.
Remember, America’s upper-middle-class are the folks who are:
most likely to be voting Democratic (and who are mighty pissed off right now)
most shocked by the recent Presidential election (refer to the bubble effect)
most likely to socialize in an upper-middle-class bubble exclusively (at work and in leisure)
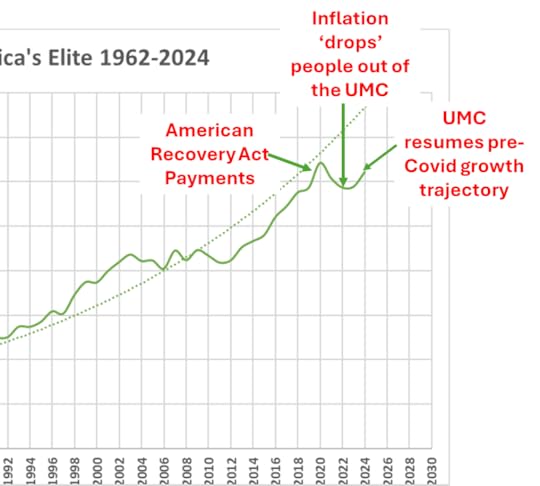
If we Zoom in on the onset of the pandemic, we see the roller coaster and its primary mathematical causes (assumed by the author).
 Sarah Flood, Miriam King, Renae Rodgers, Steven Ruggles, J. Robert Warren, Daniel Backman, Annie Chen, Grace Cooper, Stephanie Richards, Megan Schouweiler, and Michael Westberry. IPUMS CPS: Version 12.0 [dataset]. Minneapolis, MN: IPUMS, 2024. https://doi.org/10.18128/D030.V12.0; my analysis of extracted data
So, what happened here? Well, a bunch of things. The 2020 ‘surge’ is most likely noise caused by American Recovery Act payments pushing individuals above the threshold in my SES definition. Not that important. As inflation soared in 2022 and 2023, the minimum income threshold effectively increased because the dollar’s real purchasing power decreased, making it harder to ‘earn’ or maintain your upper-middle-class status at the ‘bottom’ of the group.
The upswing appears mainly due to a delayed employer reaction to inflation. The average employer COLA (cost-of-living-adjustment) in 2021 was 5.1%. And in 2022, it was 5.9%.1 That was a total net average raise of 11.3% across diverse kinds of employers. But inflation rose by 15% from July 2020 through July 2022! Hmm..this kind of behavior sounds familiar. Dickens wrote about this kind of boss…

In 2023, American employers faced open rebellion or woke up a sweaty pile of guilt. Because the average COLA rose last year was 8.3%. Double the rate of inflation!
Why does the boss take so long to get it in America? Why! The federal data is updated monthly, people!!
And now, by 2024, wages have finally caught up with inflation. And voila! The upper middle class is back to growing.
But wait…there is more to this post-pandemic roller coaster—the absolute numbers involved.
1.8 million upper-middle-class adults fell out of the upper-middle-class by 2022. While a bunch were those hugging the minimum income threshold and are mere artifacts of math, many others simply lost their high-earning employment due to post-pandemic realities we prefer to forget. My amazing wife was one of these people.
She has a Master’s degree and, for years, has earned well within the personal income minimum to qualify for this ‘group.’ She earned this elite income tier steadily until she contracted long COVID-19 on an unnecessary business trip in June of 2022. She then took disability leave and returned to work three months later, only to be laid off six weeks later as part of a structural layoff. The job was taking a toll on a virus-weakened body, so it was a blessing in disguise.
Then, she took a job as a high school nurse as she continued to recover from muscle spasms, nerve pain, and chronic fatigue. I’m proud of this adaptation because it was a massive slice of ‘humble pie’ for an ambitious career person to eat. It was a big identity adjustment for her because highly educated women do NOT like being financially dependent on a man. They prefer to pay their way, so to speak.
My wife went from a corporate remote job in a custom-built office shed to an on-site job in a poverty-stricken public school with its own full-time security force (and vehicles) and with enormous daily health needs in its student body. Every day, she deals with anything from epileptic seizures to kids in diabetic shock, to severely autistic teens injuring teachers, to fistfight victims, to kids high on THC vapes, to opioid overdoses in bathrooms. At least 2-3 of the above every single week.
The irony of this job assignment is that my wife is now better integrated with the local Tucson community in all its demographic diversity than I am, sitting in my air-conditioned office shed running a mid-six-figure internet-based consulting business by myself.
I still live in the upper-middle-class bubble. She is a genuine part of the community.
Is the upper-middle-class bubble threatening America’s unity male-dominated, I wonder? Probably. If true, is having America’s men so segregated from each other by class a good thing for our future? Our elections? After all, most civil conflicts and wars are tied back to male anger in human societies, to men being unable to compromise and resolve their differences—angry elite men, for the most part.
As I wrote last week, I do not think that having an upper-middle-class operate as this large of an internally segregated group is wise for any modern nation. It prevents basic empathy about those less privileged because it is too easy to avoid/ignore even middle-class people.
PS - I did not dive deeper into cross-sectional variables. But I suspect most of these 1.8 million lost upper-middle-class adults were highly educated women. I hold this hypothesis because women remain structurally underpaid (mainly because of the white-collar positions they get the most access to).
While we have serious problems with internal class divisions in America, my recent book takes you on a story-rich tour through a standard cultural set of practices and tendencies most of us do share. We may not have similar ‘lifestyles’ or ‘traditions,’ but we have similar all-American tendencies. We should understand them better.
 1
1Social Security Administration analysis


