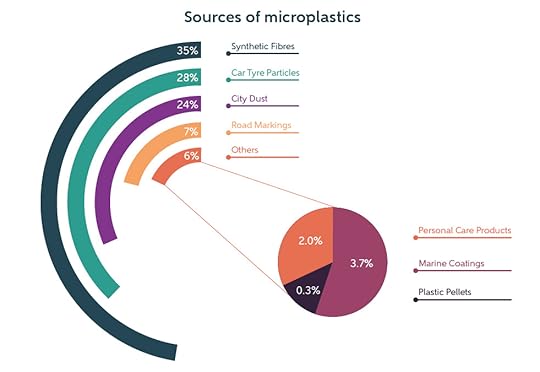
In a training session recently, we were talking about plastic pollution, and I saw something on a graph that I hadn’t noticed before. Here’s a similar graph from the Seas at Risk campaign, showing the main sources of microplastics.

It’s the yellow curve above that jumped out to me: road markings. It hadn’t occurred to me that they would be a source of plastics at all, let alone one that significant. 7% seems really high. So what’s going on there?
First of all, yes, road markings are ...
Published on August 29, 2024 08:20
