Visual Thinking and Communicating
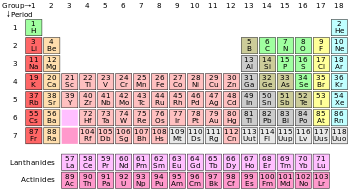
Since a picture paints a thousand words, it makes sense that people communicate better with charts, graphs, and other visualization methods. The Periodic Table of Elements is a classic example of a great way to visualize atoms, their characteristics, and structural similarities. Anyone who has taken chemistry knows the significance of the diagram.
What are all your visualization options?
The site visual-literacy.org offers a compendium of visualization methods. One page shows a “periodic table”...


No comments have been added yet.