
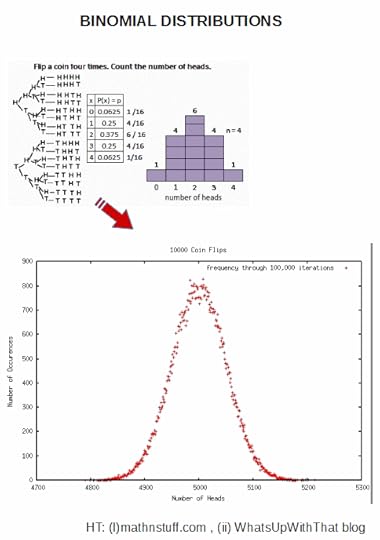
Distribution of tossed coins, a reminder
We see the binomial distribution of coin-flipping possibilities, here based on 10,000 actual tosses iterated 100,000 times, also indicating just how tight the peak is, mostly being between 4,850 and 5,150 H:
Thus we see the roots of discussions on fluctuations:
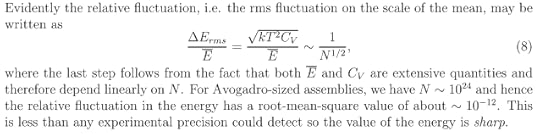
Note, not coincidentally, sqrt (10^4) = 10^2, or 100.
(Compare the bulk of the 10,000 coin toss plot on 100 k repetitions, centred on 5000h, with +/- 100 capturing the main part. Obviously possibilities run from 0 H to 10,000 H but there is a sharply peaked clustering about the “average”.) END
Copyright © 2022 Uncommon Descent . This Feed is for personal non-commercial use only. If you are not reading this material in your news aggregator, the site you are looking at is guilty of copyright infringement UNLESS EXPLICIT PERMISSION OTHERWISE HAS BEEN GIVEN. Please contact legal@uncommondescent.com so we can take legal action immediately.Plugin by Taragana


No comments have been added yet.
Michael J. Behe's Blog

- Michael J. Behe's profile
- 219 followers
Michael J. Behe isn't a Goodreads Author
(yet),
but they
do have a blog,
so here are some recent posts imported from
their feed.

