
Amazon Growth Chart 2015-2021
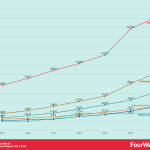

In 2021, Online Stores generated $222B, while physical stores generated $17B. Third-party seller services generated $103.3B, subscription services generated $31.76B, while the cloud service, AWS generated $62.2B. Amazon advertising generated $31.16B. Online stores have grown from over $78 billion in 2015 to over $222 billion in 2021. Third-party seller services have grown from $16 billion in 2015 to over $103 billion in 2021.
 Amazon has a diversified business model. In 2021 Amazon posted over $469 billion in revenues and over $33 billion in net profits. Online stores contributed to over 47% of Amazon revenues, Third-party Seller Services, Amazon AWS, Subscription Services, Advertising revenues and Physical Stores.
 Amazon Marketplace is the world’s biggest online retailer, with sales greater than the eCommerce sales of entire countries. Marketplace Pulse estimates that there are over five million sellers on the Amazon marketplace, with over two million on Amazon.com alone. Amazon had enviable sales of over $232.8 bn in 2018 just from its product sales, with over 50% of sales coming from third-party vendors.
Read Next: Amazon Business Model
The post Amazon Growth Chart 2015-2021 appeared first on FourWeekMBA.


No comments have been added yet.


