
What Is The GE McKinsey Matrix And Why It Matters In Business

The GE McKinsey Matrix was developed in the 1970s after General Electric asked its consultant McKinsey to develop a portfolio management model. This matrix is a strategy tool that provides guidance on how a corporation should prioritize its investments among its business units, leading to three possible scenarios: invest, protect, harvest, and divest.
Understanding the GE McKinsey MatrixThe GE McKinsey Matrix is fundamentally a portfolio analysis. That is, it compares groups of products with their competitive power and market attractiveness.
The portfolios themselves are comprised of the full suite of products or services that a business offers to the market. In the context of General Electric, the matrix was created so that the company could analyze the composition of each of its 150 portfolios – otherwise known as strategic business units (SBUs).
The GE McKinsey Matrix allows a large, decentralized company to determine where best to invest its cash. It does this by allowing the company to judge each SBU according to whether it will do well in the future. That is, the attractiveness of the industry and the SBU’s competitive strength in that industry.
Drivers of the GE McKinsey MatrixBefore any business can plot their products on the matrix, they must first define both competitive advantage and industry attractiveness.
Competitive advantage may include:
Actual market share and market share growth potential.Profit margins, cash flow, and manufacturing costs.Brand equity and customer loyalty.Product or service uniqueness.Industry attractiveness includes:
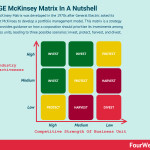
Market size and the potential for growth.Buyer and supplier power.The potential for new entrants (competition) or substitution with another product.Industry profitability. Entry and exit barriers.Structure of the GE McKinsey MatrixThe matrix comprises two axes. The competitive strength of the individual SBUs is represented on the x-axis while market attractiveness is represented on the y-axis.
Both competitive strength and market attractiveness are determined by a weighted score calculated from the relevant factors that apply to each. Each parameter is further divided into three categories – low, medium, and high. This creates a matrix with a total of nine cells.
To calculate a weighted score for each SBU, follow these steps:
Make a list of factorsWhat are the competitive strength and market attractiveness features that are most relevant to the organization? Refer to the previous section for examples.
Attribute weightsThese define the relative importance of each factor. The scale that is used is up to the discretion of the business. For example, one may use a value of 1 to denote extreme unimportance with a value of 100 denoting extreme importance. In this case, the individual weights that are assigned to each factor should add up to 100.
Rate the factorsThen, rate the factors according to how well each SBU satisfies them. Most businesses use a scale of 1 to 10. For example, one SBU may score a 6 for industry size while a smaller industry may score a 3.
Calculate total scoresTo arrive at a total score for each SBU, multiply the weight assigned in step two with the rating assigned in step three. Market segmentation for one SBU that is weighted at 17 and rated at 5, for example, receives a score of 85. Repeat the process for each factor and sum each score to arrive at a total score.
Plot the scores on the matrixWith the total scores identified for industry attractiveness and competitive strength, the x and y-values of each SBU can be plotted on the matrix using a circle. The size of each circle should correspond to how much revenue the small business unit generates. That is, an SBU that generates 40% of company revenue should be twice the size of an SBU that generates 20% of revenue.
Note also that the nine cells are divided by a diagonal line running from the bottom left to the top right of the matrix. When a product is placed on the matrix, its position relative to the diagonal line determines the strategy that should be used.
Products that fall above the diagonal line tend to be better performers with high growth or cash flow potential. Conversely, products that fall below the line tend to have little potential for growth and are costing the company money to sell.
Strategic implications of the matrixWith each SBU plotted on the matrix, the business can choose one of three strategies according to whether it has low, medium, or high competitive strength and industry attractiveness. Let’s take a look at these below.
Grow/invest strategyA growth strategy is prudent when a product has a competitive advantage in an attractive market. Investment in growth and a focus on maintaining strengths is a priority. Profitability can also be increased with an emphasis on productivity. This is a position every business aspires to and is characterized by moderate to high industry attractiveness and moderate to high competitive strength.
The biggest challenge for businesses in this area of the matrix is a lack of assets or capital that prevents growth or hinders it from maintaining a dominant market position. For those who can afford to do so, growth strategies may involve increasing production capacity, targeting new consumer demographics, or mergers and acquisitions.
Hold strategyA hold strategy occurs when a product has both average competitive advantage and market attractiveness. The way forward, in this case, is a little more difficult to define than in the previous example. Depending on the outlook of the company, it could either shift to a more attractive industry or strive to improve its competitive position in the current industry.
If the business decides to improve the current competitive position of one of its SBUs, it should only do so if there is capital leftover from investments in the grow/invest strategy.
Harvest strategyIf the product is at a competitive disadvantage and resides in an unattractive industry, a harvest strategy should be employed. This means investing just enough capital to keep the SBU afloat and continuing to invest as long as the investment made does not exceed the cash that is generated.
Business units that are making a loss, on the other hand, should be sold as soon as possible or when the cash value is at its peak. These strategies ensure that low viability products do not negatively impact other, more profitable SBUs.
Key takeaways:The GE McKinsey Matrix is a nine-cell portfolio matrix, originally developed for GE as a means of screening their large portfolio of strategic business units.The drivers of the GE McKinsey Matrix for a product portfolio are competitive strength and market attractiveness.The position of a product on the matrix ultimately decides whether the business should focus on growth or on minimizing investment and selling.Read also: Business Strategy, Examples, Case Studies, And ToolsOther strategic frameworks by McKinsey McKinsey Horizon Model The McKinsey Horizon Model helps a business focus on innovation and growth. The model is a strategy framework divided into three broad categories, otherwise known as horizons. Thus, the framework is sometimes referred to as McKinsey’s Three Horizons of Growth.McKinsey 7-S Model
 The McKinsey 7-S Model was developed in the late 1970s by Robert Waterman and Thomas Peters, who were consultants at McKinsey & Company. Waterman and Peters created seven key internal elements that inform a business of how well positioned it is to achieve its goals, based on three hard elements and four soft elements. More Business FrameworksAnsoff Matrix
 You can use the Ansoff Matrix as a strategic framework to understand what growth strategy is more suited based on the market context. Developed by mathematician and business manager Igor Ansoff, it assumes a growth strategy can be derived by whether the market is new or existing, and the product is new or existing.Blitzscaling Canvas
 The Blitzscaling business model canvas is a model based on the concept of Blitzscaling, which is a particular process of massive growth under uncertainty, and that prioritizes speed over efficiency and focuses on market domination to create a first-scaler advantage in a scenario of uncertainty.Blue Ocean Strategy
 A blue ocean is a strategy where the boundaries of existing markets are redefined, and new uncontested markets are created. At its core, there is value innovation, for which uncontested markets are created, where competition is made irrelevant. And the cost-value trade-off is broken. Thus, companies following a blue ocean strategy offer much more value at a lower cost for the end customers.Business Analysis Framework
 Business analysis is a research discipline that helps driving change within an organization by identifying the key elements and processes that drive value. Business analysis can also be used in Identifying new business opportunities or how to take advantage of existing business opportunities to grow your business in the marketplace.Gap Analysis
 A gap analysis helps an organization assess its alignment with strategic objectives to determine whether the current execution is in line with the company’s mission and long-term vision. Gap analyses then help reach a target performance by assisting organizations to use their resources better. A good gap analysis is a powerful tool to improve execution.Business Model Canvas
 The business model canvas is a framework proposed by Alexander Osterwalder and Yves Pigneur in Busines Model Generation enabling the design of business models through nine building blocks comprising: key partners, key activities, value propositions, customer relationships, customer segments, critical resources, channels, cost structure, and revenue streams.Lean Startup Canvas
 The lean startup canvas is an adaptation by Ash Maurya of the business model canvas by Alexander Osterwalder, which adds a layer that focuses on problems, solutions, key metrics, unfair advantage based, and a unique value proposition. Thus, starting from mastering the problem rather than the solution.Digital Marketing Circle
 A digital channel is a marketing channel, part of a distribution strategy, helping an organization to reach its potential customers via electronic means. There are several digital marketing channels, usually divided into organic and paid channels. Some organic channels are SEO, SMO, email marketing. And some paid channels comprise SEM, SMM, and display advertising.
More resources:
What Is Business Model InnovationWhat Is a Business ModelWhat Is a Value PropositionWhat Is Market SegmentationWhat Is a Marketing StrategyThe post What Is The GE McKinsey Matrix And Why It Matters In Business appeared first on FourWeekMBA.


