
How To Use Google Sheets
Google Drive Service offers several Google products online such as Google Docs, Google Slides, Google Forms, and Google Sheets. Introduced in 2006, Google Sheets is an amazing online spreadsheet application. It is free to use, customizable, and a cloud-based application, which can be accessed anytime and from any device. This application is compatible with Android, macOS, Windows, ChromeOS, and blackberry.
Google Sheets functions like any other spreadsheet tool, but with more advanced features. It is often compared with MS Excel, the time-hallowed giant of the spreadsheet world. However, Excel is primarily an offline program, and Google Sheets being an online and cloud-based application, can be incorporated very well with the other online Google Services.
Google Sheets supports the following spreadsheets files: .xls, .xlsx, .xlsm, .xlt, .xlts .xltm, .ods, .csv, .tsv, .txt and .tab.
Why Use Google Sheets
Google Sheets is a very efficient tool to create, edit, update, and analyse any kind of information or data. Google Sheets is proving to be a real game-changer in today’s corporate world. The following aspects make Google Sheets the most sought-after application.
Cloud-based
It is a cloud-based application, which means that it saves data on remote servers and can be accessed through the internet at any time, and from any device using an active Google account.
Auto-save
All the data in the Google Sheets is automatically saved online, which means that the data can be retrieved at any time without needing a hard drive. In this way, the reliance on the hard drive becomes minimal while using Google Sheets.
Collaboration in real-time
Collaboration is the most outstanding feature of Google sheets, as this feature allows the teams to work more efficiently saving precious time. Through this feature, several users can add, update, edit, view, and analyse the changes made by the other person and themselves in real-time. Google Sheets offer collaboration at three levels; edit, share, and comment.
Editing
Editing through Google Sheets is one step ahead of all the other spreadsheet programs. As Google Sheets offers collaborative editing in real-time. Through this feature, several people in a team can edit data simultaneously, with the changes being automatically saved on the remote servers. This eliminates the need for mailing the data to several people for editing and revising the details. The Revision History feature enables the edit history to be tracked.
Offline editing
Although Google Sheets is an online application, it also supports offline editing. Meaning that the data can be edited offline on either desktop or through mobile apps. Mobile users need to download Google Sheets mobile app on IOS and android, while desktop users need to download ‘Google Docs offline’ through chrome browser for offline editing.
Comment
Comments can also be made during the editing of the data on Google sheets for adding notes or giving suggestions about some specific information. To comment, you need to click on a cell or several cells for that matter. The comments are shown in the interactive boxes bearing the name and photo of the commenter. After making the required changes the comments can be disappeared by clicking on ‘Resolve’.
Share
Sharing is much simpler and time-saving via Google Sheets. Users can share spreadsheets online with the staff and they can view and edit and update it online. Apart from this, if you do not want your data to be accessed by certain people, data access can be restricted by clicking on the ‘advanced’ option. Then click on ‘prevent editors from changing access’.
Explore
Google Sheets offers the Explore feature since 2016. This feature offers a variety of information based on data the user adds to the spreadsheets. Explore feature is also used to make charts, ask questions, and pivot tables among other things.
Personalize your Google Sheets
Every person uses spreadsheets in his way, using several methods and processes. Google Sheets offers to personalize your Google sheets by using add-ons.
Add-ons
Google Sheets provides add-ons to make graphs and diagrams, to modify and style tables. Click on Add-ons in the menu bar and then click on ‘Get Add-ons’. Choose the Add-on that complements your field of interest.
Basic Google Sheets Terms
To master Google Sheets, there are certain terminologies that need to be understood first. Following are some of the basic terms.
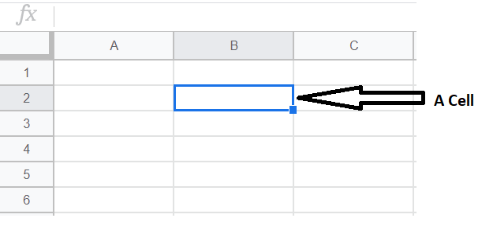
Cell
Google spreadsheets are made from a lot of cells. The horizontal rows and vertical columns intersect and result in a cell. It is a single data point in the spreadsheet. You can make as many as 5 million cells in Google Sheets.
Rows
Rows are horizontal lines, indicated numerically. The rows start from 1 and they are infinite, which means you can make as many rows as you need.

Columns
Columns are vertical lines in a cell. They are indicated alphabetically. They can also be infinite so when alphabets end at Z, the letters go with AA, AB, and so on.

Range
Range refers to a set of selected cells. Range may contain a row, a column, or both. You can also give names to the range depending upon the type of data.

Array
An array is also a sort of range and consists of a table of values, but it is used in a formula. The array can also be named to make it more distinctive.
Function
A function is an in-built operation from the Google Sheets application, it is used to calculate and manage data. There is a function/ formula bar with the ‘fx’ symbol, this space is used to enter data including text, formulas, and functions.
Formula
To calculate data and find out results, the users must apply formulas combining rows, columns, range, etc. For example, there are some, average, and mean formulas that are commonly used in Google Sheets.

Worksheet
It consists of a set of columns and rows making a spreadsheet.
Spreadsheet
It is an entire document containing Google Excel Sheets. Data in a spreadsheet can be represented through text, numeric values, or graphs, etc. There can be more than one worksheet in one spreadsheet.

Google Sheets application is being employed in every field of human activity ranging from making budgets for large and medium-sized businesses to analyzing progress in the corporate world. It is taking over the traditional spreadsheet tools and revolutionizing the ever-changing corporate world.
How to use Google Sheets
Now that we are done with some of the theoretical domains of Google Sheets, now move towards getting to know how to use Google Sheets.
Creating a new Google Sheets Spreadsheet
First, you need to create a new Google Sheets spreadsheet. For this purpose, you need to log into your Google account or if you do not already have a Google account, then create one.

Now there are several ways to create new Google Sheets spreadsheets. One of them will be using your Google Drive app and tapping the plus icon in the bottom right, then select Google Sheets. There are several templates displayed on the top of the page, you can click on the Blank one or you can view the full list of templates in Template Gallery.

It should be noted that a spreadsheet can have multiple numbers of sheets and you can add more sheets to a spreadsheet by using the Plus icon.
The Google Sheet Editing Window
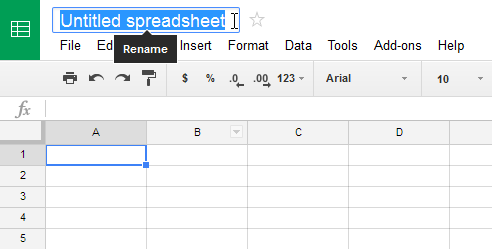
This is how your blank Google Sheet looks like.

Now the spreadsheet is opened and you can give a name to your spreadsheet. For this click on the space named ‘untitled spreadsheet’ and type a name, that fits your purpose. For example, you can name it ‘monthly budget’. Then you can start importing and/or adding data into your spreadsheet.
Understanding Toolbar Icons
To use Google Sheets effectively, you need to understand the icons that are contained in the Toolbar. The Toolbar contains a row of different icons for different functions on the top of the sheet. An image of Toolbar is explained below.

Undo
It is indicated by a curved arrow to the left which enables the user to make corrections and to edit the data.
Redo
Another curved arrow indicates redo but to the right side, it enables you to retrieve something back, which you have undone.
This icon enables the user to directly print the spreadsheet without having to go to the file and then printing it. Therefore, it saves time.
Paint format
It enables the users to set any format for the cells. For this, you have to select a particular format style for your spreadsheet and copy this on format painting. This will change the cursor into a paint roller, enabling you to select the part of the spreadsheet you want for that particular format.
Zoom
This enables the user to get the desired size for the display of your data in cells. For example, if you want to view a cell in detail, you can zoom it in.
Format (as currency $ or percentage %)
Most of the time you need to generate numerical data using currencies or percentages, format (as currency or percentage) icon enables the user to add currency or percentage as data in the range.
Format (decimal position)
There are two options to increase or decrease decimal position, it speeds up the process of changing positions on either side. There are other formats as well, which can be used depending on the type of data you want to enter.
Font and font size
Easily readable fonts make a big difference to make a presentation more appealing. So the font and font size icons enable the user to use the type of font style that is more suitable to your area of interest, also the size of the font can be changed.
Bold, Italics, Underline
These are tools for highlighting the text in the spreadsheets. They help the users to easily mark certain data and easily find it when the need arises. These tools give your spreadsheets an organized look.
Text Colour
It enables the user to change the color of the text as desired. You can use different colors for different items in rows and columns.
Fill Colour
This is an amazing tool, enabling the user to fill the cells with colors. It makes the cells effectively organized and easy to comprehend along with making the spreadsheet more appealing.
Borders
You can choose how you want the borders in the spreadsheet, their color, style, etc.
Merge cells
When you select a range, this feature can be used to merge multiple cells in a range. So, you can merge cells containing data of a particular type, together.
Align
Users do not always require their data to be aligned in a single direction, as different sections of data need to be aligned differently. It enables the user to align the text in the center, left, or right depending on the need.
Vertical Align
It enables the user to align the data in the spreadsheet on the vertical position in the center, top, or bottom.
Text Wrapping
To display the data inside the cell or beyond the cell boundary, you have three options to wrap the data; overflow, wrap, and clip.
Text Rotation
Many times, your data needs to be displayed from different angles instead of a linear position. Text rotation option is there to take care of this.
Insert link
It enables the user to insert links in their spreadsheets for reference. For this purpose, add a word or phrase that is clickable and redirect it to a particular URL. Then click on the paper clip and paste the URL in the popup.
Insert comment
This is very effective for collaboration inside a spreadsheet. Click on the cell you want to add a comment, and this will be displayed in the interactive boxes for all team members to view.
Insert Chart
Often, the users are in need of displaying the data in the form of charts. The insert chart option enables this by clicking onto the range to be converted into a chart. A Chart Editor box is there to enables the user to add the desired kind of chart.
Create Filter
It is an efficient way to start creating filters directly.
Functions
These are very useful in calculating data. Functions contain a drop-down menu with the most used functions like Sum, Average, Mean, and others. There is also a list of functions with categories like Maths, Engineering, and others. Functions help you quickly navigate your data in the spreadsheet without having to memorize all the formulas.
Main Guides:
Business ModelsBusiness StrategyMarketing StrategyBusiness Model InnovationPlatform Business ModelsNetwork Effects In A NutshellDigital Business Models
The post How To Use Google Sheets appeared first on FourWeekMBA.


