Bar Chart Race Python Package Official Release
I’m excited to announce the official release of bar_chart_race, a python package for creating bar chart races. In this post, I'll cover many of the major available options. Navigate to the official documentation for all of the options.
MotivationBar chart races have become very popular over the last year and no python package existed to create them. I built some for my coronavirus dashboard.
YouTube TutorialThis post is available as a tutorial on YouTube
https://medium.com/media/cd804a999b64001f7921f05b2af71602/hrefInstallationInstall with:
pip install bar_chart_raceThis is the first major release — version 0.1.0
>>> import bar_chart_race as bcr>>> bcr.__version__
'0.1.0'Data must be in a particular format
In order to use bar_chart_race, your data must be in ‘wide’ pandas DataFrame where:
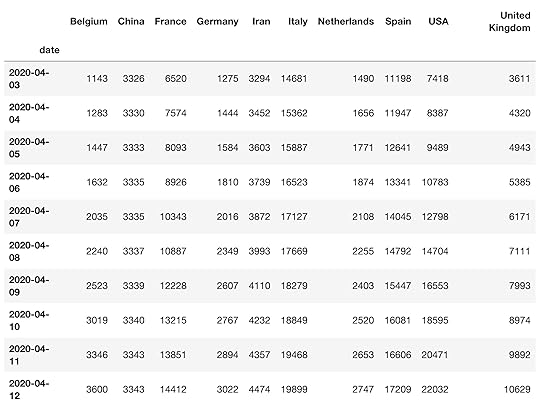
Every row represents a single period of timeEach column holds the value for a particular categoryThe index contains the time component (optional)Load dataA few sample datasets are available to download via the load_dataset function. The covid19_tutorial dataset contains the total deaths due to COVID-19 of selected countries over a period of 10 days.
df = bcr.load_dataset('covid19_tutorial')df
 Basic Bar Chart Race
Once you have data in the correct format, you can pass it directly to bar_chart_race.
bcr.bar_chart_race(df)https://medium.com/media/2bd0ab86c7386f048878106adecf6236/hrefChange orientationBy default, bars are horizontal, but can be made vertical with the orientation parameter.
bcr.bar_chart_race(df, orientation='v')https://medium.com/media/2c6e1c5df3b661ec7800269d3b81732a/hrefChange sort orderSet sort to 'asc' to change the order of the bars.
bcr.bar_chart_race(df, sort='asc')https://medium.com/media/e1c44748a501998a2232ed3dfe795d3c/hrefLimit barsLimit the number of bars plotted with n_bars.
bcr.bar_chart_race(df, n_bars=6)https://medium.com/media/ad4a46f0c24ca7f00ff6ab6d0d858cc3/hrefFix orderFix the order of the bars for the duration of the animation by setting fixed_order to a list.
bcr.bar_chart_race(df, fixed_order=['Iran', 'USA', 'Italy','Spain', 'Belgium'])https://medium.com/media/5305c1cc254f57c550248eb1a91d4f9e/hrefFixed max
Fix the maximum value for the entire duration of the animation.
bcr.bar_chart_race(df, fixed_max=True)https://medium.com/media/71282ec6beaacb30e20ca3b4574d0581/hrefSmoothnessBy default, 10 frames are used per time period with the entire period lasting 500 milliseconds (half of a second). Both of these are changed below.
bcr.bar_chart_race(df, steps_per_period=20, period_length=200)https://medium.com/media/cd2529a4163b48ec5410beac5341859b/hrefInterpolate periodLinearly interpolate the period label.
bcr.bar_chart_race(df, interpolate_period=True)https://medium.com/media/b89e37f28394088354d548cf0b2abf4c/hrefPlotting propertiesbar_chart_race uses matplotlib for all of the underlying plotting. Many properties can be set by using parameters common to matplotlib.
bcr.bar_chart_race(df,figsize=(5, 3),
dpi=100,
label_bars=False,
period_label={'x': .99, 'y': .1, 'ha': 'right', 'color': 'red'},
title='COVID-19 Deaths by Country')https://medium.com/media/6fe6edd20c6d5d322ad5fa77201a49c2/hrefBar properties
Bar properties can also be set.
bcr.bar_chart_race(df, bar_kwargs={'alpha': .2, 'ec': 'black', 'lw': 3})https://medium.com/media/661162ce809f957a34aa4f7efc087723/hrefPeriod label formatThe period label can be formatted with date directives or new-style string formatting.
bcr.bar_chart_race(df, period_fmt='%b %-d, %Y')https://medium.com/media/d66ad1782ba1141cf84762ce951a5bfa/hrefCustom summary labelAdd a custom label to the plot that summarizes the current time period.
def summary(values, ranks):total_deaths = int(round(values.sum(), -2))
s = f'Total Deaths - {total_deaths:,.0f}'
return {'x': .99, 'y': .05, 's': s, 'ha': 'right', 'size': 8}
bcr.bar_chart_race(df, period_summary_func=summary)https://medium.com/media/2926df48fc6dfdddfcb85279785d69bd/hrefPerpendicular line
A single perpendicular bar can be added to summarize each period as well.
def func(values, ranks):return values.quantile(.9)
bcr.bar_chart_race(df, perpendicular_bar_func=func)https://medium.com/media/4a0653cf765901dedc5cbdcd8d789bc0/hrefPublished with Jupyter to Medium
This blog post was published with jupyter_to_medium, a python package I createdto automate the process of publishing Jupyter Notebooks as Medium blog posts.

Bar Chart Race Python Package Official Release was originally published in Dunder Data on Medium, where people are continuing the conversation by highlighting and responding to this story.