
Computing Weighted Average Shares Outstanding (2 Video Links)

If you’ve taking an intermediate accounting class, or studying for the CPA exam, you may struggle with calculating weighted average shares of stock outstanding.
You’re not alone.
This discussion explains these concepts using screenshots from spreadsheets. Links to the You Tube videos that explain the topics are here and here.
It all starts with earnings per share.
Earnings Per Share Formula
Earnings per share (EPS) reports the dollar amount of earnings generated for each share of common stock outstanding. EPS is a frequently used metric to determine the value of a company’s stock.
Now, there are a number of variations on the formula, but we’ll stick with the most basic version:
(Earnings available to common stock shareholders) / (weighted average shares outstanding)
Some earnings may not be available to common shareholders. If your firm has preferred stock outstanding, you may have to pay dividends to preferred shareholders before earnings are available to common stock owners.
Say, for example, that total earnings are $1.2 million, and that $200,000 must be allocated to preferred stock dividends. The weighted average common shares outstanding total 100,000 shares.
EPS for common stock is ($1 million earnings) / (100,000 shares), or $10 per share.
Several types of securities can be converted into common stock, which impacts the EPS formula.
Dilutive Securities
Financial analysts often use dilutive earnings per share to assess company value.
Dilutive EPS assume that any security that can be converted into common stock is converted. Here are securities that are dilutive:
Stock options
Rights and warrants
Convertible bonds
Convertible preferred stock
Now that you know about EPS, let’s calculate weighted average shares of stock outstanding.
Setting Up the Calculation
When you calculate weighted average shares, use the format in this spreadsheet:
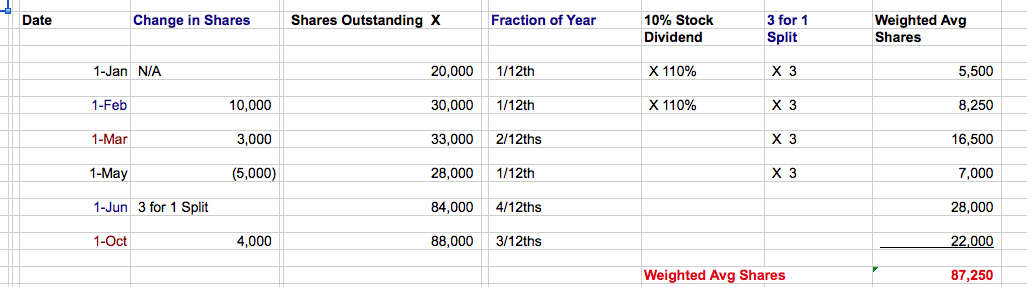
This format helps you solve the problem in a document that deals with each variable.
Change in Shares column: Lists the increase or decrease in shares, based on a specific event.
Shares outstanding: Total shares held by the public, as of a specific date.
Fraction of a year: Here’s the tough part: Each shares outstanding total is held for a portion of the year. This data is needed, in order to adjust the share total to compute the weighted average.
Let’s look at the share changes in detail:
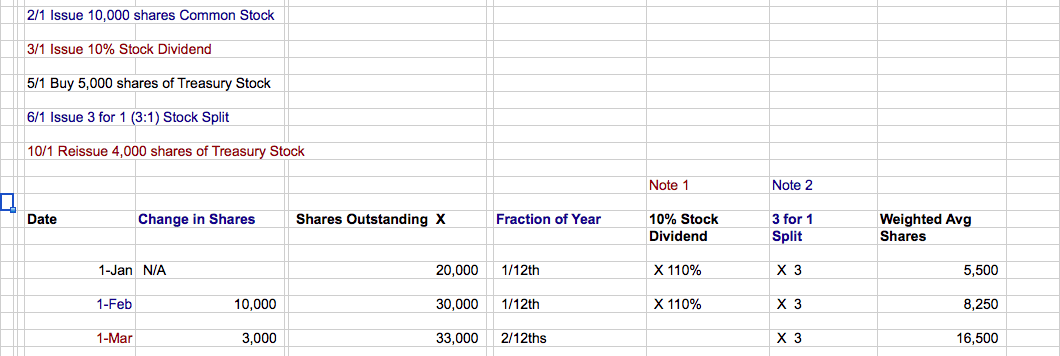
On January 1st, the company starts with 20,000 shares. On February 1st, the firm issues 10,000 more shares, and the share outstanding total is increased to 30,000.
On March 1st, the business issues a 10% stock dividend. For every 100 shares previously outstanding, there are now 110 shares.
The 30,000 shares are multiplied by 110%, and the new total of shares is 33,000. Note also in the “10% Stock Dividend” column that prior period share totals are also multiplied by 110%.
Keep working your way down the spreadsheet:
On May 1st, the company buys 5,000 shares of stock from the public, and posts them to the Treasury stock account. Shares outstanding decline to 28,000.
The firm issues a 3 for 1 (or 3:1) stock split on June 1st. Every 100 shares now becomes 300. The 28,000 shares outstanding is adjusted to 84,000 on June 1st. The “3 for 1 Split” column adjusts shares in the earlier periods for the stock split.
Calculating Weighted Average Shares
To compute the weighted average shares, multiply across for each period.
The 20,000 shares are outstanding from Jan 1st to Feb 1st, or 1/12th of the year. The formula for weighted average shares is:
(20,000 shares) X (1/12th of year) X (1.1 stock dividend) X (3 stock split) = 5,500 shares
On October 1st, the company takes 4,000 out of treasury stock and reissues them to the public. The new share total is 88,000, and the shares are outstanding from 10/1 to 12/31 (3 months).
The formula for weighted average shares is:
(88,000 shares) X (3/12ths of year) = 22,000
In this case, the shares are already adjusted for the 10% stock dividend and the 3:1 stock split earlier in the year.
How Total Shares Are Used
The weighted average shares of stock outstanding total 87,250. This total is used to calculate earnings per share.
My next book, 25 Intermediate Accounting Spreadsheets (and How to Use Them) will be out in January of 2020. The format will include a written discussion of a spreadsheet, with spreadsheet images, and a related video.
To learn more and get sample chapters of the book, watch this video.
For live CPA exam prep and accounting classes, join Conference Room for free. Members will be notified of course dates, times, costs, and how to attend these courses.
Get your questions answered to pass the CPA exam, and to learn accounting concepts.
Go to Accounting Accidentally for 300+ blog posts and 450+ You Tube videos on accounting and finance:
Good luck!
Ken Boyd
Author: Cost Accounting for Dummies, Accounting All-In-One for Dummies, The CPA Exam for Dummies and 1,001 Accounting Questions for Dummies
(email) ken@stltest.net
(website and blog) http://www.accountingaccidentally.com/
The post Computing Weighted Average Shares Outstanding (2 Video Links) appeared first on Accounting Accidentally.


