
KDP Reports
by Elizabeth S. Craig, @elizabethscraig
On Monday, I’ll be picking up on my blog series ‘making life easier as a writer.’ But today I wanted to point out something new (still in beta) on the KDP dashboard in case you’ve missed it (and I know lots of you probably noticed this earlier than I did!)
KDP is rolling out their new reports section and my first impression is that it looks really helpful.
I’m one of those authors who absolutely hates doing metrics on ads or tracking sales. I know it’s something important but delving down into spreadsheets and the business aspect has always been something of a drag.
I love that Amazon is making this easier. For one thing, I like to keep track of which series sells better. For another, I like to see which individual books seem to sell strongest in a series…and try to figure out what the magic formula was so that I can duplicate it again.
Here’s what Amazon says the benefits of the new reports are: (see more information here).
Benefits of the new reports
The new KDP reports improve upon the existing ones by allowing you to:
Use the Dashboard to see how your books are performing
Display data for more than one book on a single graph so you can compare books and see title-level trends
Choose to see graphs as a line or bar chart
Estimate your monthly royalties in a single currency of your choice
Estimate your monthly royalties from KU and KOLL before the KDP Select Global Fund is announced for that month
Use your phone and other mobile devices to view reports
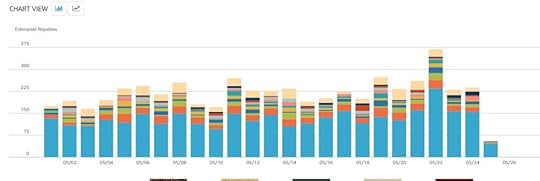
For me, the bar chart (pictured at the top of the post) makes my earnings a lot more understandable than the line chart. Plus, when you hover on a particular day on the bar chart, it will drill down to show you estimated royalties per day and per title.
I also really like seeing at a glance what my anticipated royalties for the month so far are. No math involved. :) You can choose your currency, too.

And then, under settings:

Another cool feature is seeing the top formats and marketplaces. Even though I roughly know the ratio of ebook to paperback sales, it’s cool to see it in this format:

I also like seeing where my sales are coming from (although no surprise that the majority are from the US).
To reach this new reports section, go to your KDP dashboard, reports, then click on the beta notification at the top of the page. Or, more directly: https://kdpreports.amazon.com/dashboard
Amazon is still tweaking this. On my beta reports dashboard, they state: “Welcome to the new KDP Reports beta! We’ll be adding more reports — including historical data for Sales, KENP Read, and Royalties — in the future, so stay tuned!”
How good are you about tracking sales? Tracking sales per series? Are you as bad at spreadsheets as I am? :)
Tracking Sales with KDP's New Reports:
Click To Tweet
The post KDP Reports appeared first on Elizabeth Spann Craig.


