
Up until 2000, it looks like we have an unemployment-rate...
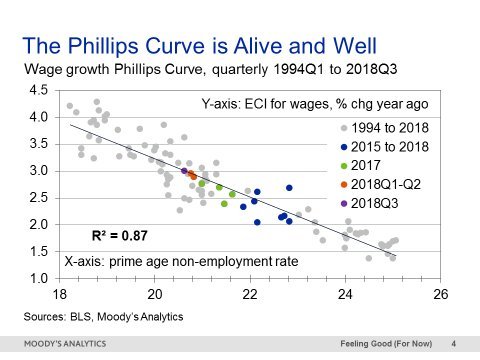
Up until 2000, it looks like we have an unemployment-rate (or vacancy-rate) adaptive-expectations price Phillips curve. Since the mid-1990s, we have a non-employment-rate static-expectations wage Phillips curve. How long before another structural shift we do not know. But right now Team Slack has the empirical evidence. And Team Slack says: the economy still has plenty of room to grow: Jay C. Shambaugh: Score One for Team Slack: "As @ModeledBehavior notes, it is not clear how long this relationship will hold, but it looks really good in 2018 (even better than in 2017). Almost impossible to argue slack is not part of wage growth story even if you don't think it is whole story:
#shouldread
#labormarket
#monetarypolicy
#phillipscurve


No comments have been added yet.
J. Bradford DeLong's Blog

- J. Bradford DeLong's profile
- 90 followers
J. Bradford DeLong isn't a Goodreads Author
(yet),
but they
do have a blog,
so here are some recent posts imported from
their feed.

