Australia’s east coast solar generation is replacing coal by only 2% in late summer
This is an analysis of late summer. Data are taken from Open NEM: http://opennem.org.au/#
The graphs in this post are a bit different from those on the above website
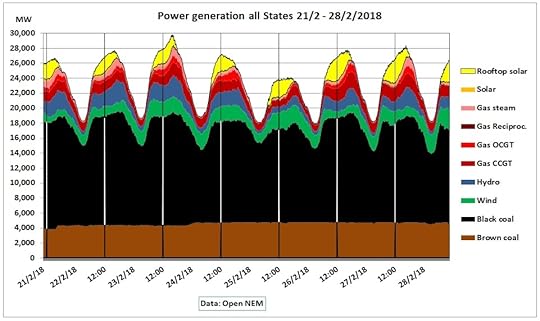
Fig 1: Generation by fuel: 55% black coal, 19% brown coal, 9% gas, 7% wind, 6% hydro, 4% solar
All times shown in NEM time. AEST is one hour later.
The vertical lines show 12:00 noon, the start of hot afternoons. Note that Feb 24th – 25th was a weekend with lower demand.
Coal
Victoria’s inflexible brown coal was running 24/7 at an average of around 4,500 MW, near to capacity of 4,630 MW. The minimum was 3,800 MW on 21/2/2018. There are problems with Loy Yang as reported by The Australia Institute: http://www.tai.org.au/gas-coal-watch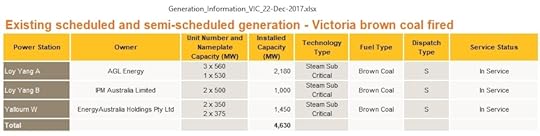 Fig 2: Nameplate capacities of Victoria’s brown coal
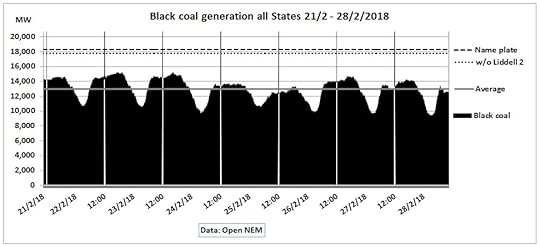 Fig 3: Black coal generation
Black coal had an average generation of 13,000 MW, variable between a minimum of 9,400 MW (at night around 3 am, -27% down from average) and 15,300 MW (afternoon, +18% above average)
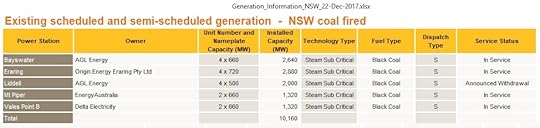 Fig 4: Nameplate capacities of NSW black coal
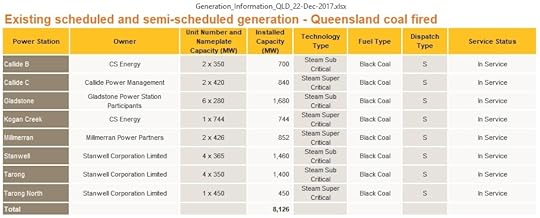
Fig 5: Nameplate capacities of Queensland black coal
During day time, black coal is less variable as shown in this graph:
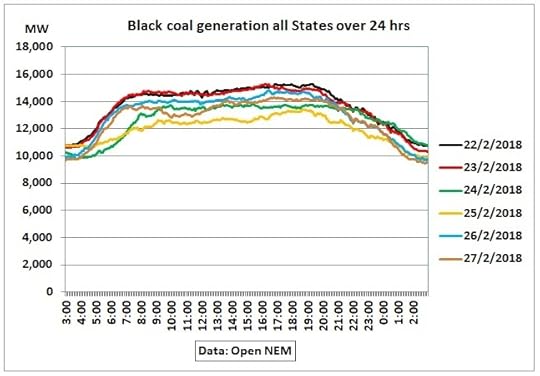 Fig 6: Black coal generation over 24 hrs/6 days
Compared to 7 am power generation at 7 pm was up to 800 MW (average 500 MW) higher or around 4%-6% which is not very peaky.
…click on the above link to read the rest of the article…