Predictions and Suggestions from a machine learning based Algorithmic trading
#MachineLearning #AlgortihmicTrading #StockMarketAutomatedTrading #LogisticRegression #Boosting
Predictions and Suggestions from a machine learning based Algorithmic trading
An algorithm is a specific set of clearly defined instructions aimed to carry out a task or process.
Algorithmic trading (automated trading, black-box trading, or simply algo-trading) is the process of using computers programmed to follow a defined set of instructions for placing a trade in order to generate profits at a speed and frequency that is impossible for a human trader. The defined sets of rules are based on timing, price, quantity or any mathematical model. Apart from profit opportunities for the trader, algo-trading makes markets more liquid and makes trading more systematic by ruling out emotional human impacts on trading activities.
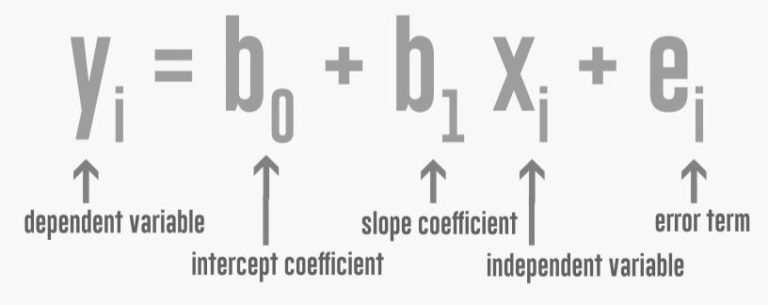
We can create a Regression formula like below :

The dependent variable is the Return on capital invested and can be run across all stocks.
Error term ei can be boosted using Boosting Algos and thus increasing the prediction accuracy.
Now how to choose your Variables and what can be the ideal STOCK Equation :
YOY Quarterly sales growth > 15 andYOY Quarterly profit growth > 20 andNet Profit latest quarter > 1 andG Factor >= 7 andNet Profit latest quarter > .33 ANDOther income latest quarter < Net Profit latest quarter * .5 ANDNet Profit preceding year quarter <= 0 ANDExpected quarterly net profit > 0 ANDSales latest quarter > Sales preceding year quarter ANDReturn on invested capital > 25 andEarnings yield > 15 andBook value > 0 ANDMarket Capitalization > 15
AND Graham Number > Current price ANDPB X PE <=22.50 ANDPEG Ratio >0 ANDPEG Ratio Altman Z Score >=2.5 ANDSales growth 5Years >25 ANDProfit growth 5Years >15 ANDCurrent ratio >2 ANDMarket Capitalization >250 ANDSales >100 ANDPiotroski score > 7AND Dividend yield > 2 ANDAverage 5years dividend > 0 ANDDividend last year > Average 5years dividend ANDProfit after tax > Net Profit last year * .8 ANDDividend last year > .35 AND( Profit growth 3Years > 10 ORProfit growth 5Years > 10 ORProfit growth 7Years > 10 ) OR(Market Capitalization > 3000) AND(Average return on equity 10Years Years > 20) AND(Debt to equity < 1.5) AND(Interest Coverage Ratio > 2) AND( PEG Ratio <= 1) AND(Profit growth 5Years > 20)
AND YOY Quarterly sales growth > 40 andYOY Quarterly profit growth > 40 andAverage return on capital employed 3Years >30 andPrice to Earning ORSales growth 10Years > 10 ANDProfit growth 10Years > 12 ANDOPM 10Year > 12 ANDDebt to equity < 0.5 ANDCurrent ratio > 1.5 ANDAltman Z Score > 3 ANDAverage return on equity 10Years > 12 ANDAverage return on capital employed 10Years >12 ANDReturn on invested capital > 15 ANDSales last year / Total Capital Employed > 2 ANDAverage dividend payout 3years >15
AND PEG Ratio Sales > 500 ANDPrice to Earning < 40 ANDProfit growth > 20 ANDDebt to equity < 0.2 ANDPrice to Cash Flow > 5
OR
EPS last year >20 ANDDebt to equity <.1 ANDAverage return on capital employed 5Years >35 ANDMarket Capitalization >500 ANDOPM 5Year >15
AND Net Profit latest quarter > Net Profit preceding quarter ANDNet Profit preceding quarter > Net profit 2quarters back ANDNet profit 2quarters back > Net profit 3quarters back
AND
EPS latest quarter > 1.2 * EPS preceding year quarter ANDEPS latest quarter > 0 ANDYOY Quarterly sales growth > 25 ANDEPS last year > EPS preceding year ANDEPS > EPS last year ANDProfit growth 3Years > 25 ANDReturn on equity > 17 ANDDown from 52w high < 15 ANDMarket Capitalization > 100
AND
Price to Earning >0 and Price to Earning 10 and Dividend yield >1 and Return on capital employed >10
ANDProfit growth 5Years > Sales growth 5Years ANDSales growth 5Years > 3 ANDReturn on equity > 15 ANDWorking capital 5Years back < 0ANDPrice to Earning >0 and Return on equity 5years growth > 5 and Dividend yield >0
Note : DEBT reacts inversely to the equation . Term period will be a spread over last 15 to 20 Years.
Now , applying boosting algorithm ( like XGBoost) you can reduce the error coefficients.
Based on the above equation and a little variation choosing a flattened NN( Neural Network ) below stocks can be looked upon for Indian stock market.
1) RELIANCE INDUSTRIES2) DCB BANK3) KAJARIA CERAMICS4) INFOSYS
5) INDO COUNT INDUSTRIES
Predictions and Suggestions from a machine learning based Algorithmic trading
An algorithm is a specific set of clearly defined instructions aimed to carry out a task or process.
Algorithmic trading (automated trading, black-box trading, or simply algo-trading) is the process of using computers programmed to follow a defined set of instructions for placing a trade in order to generate profits at a speed and frequency that is impossible for a human trader. The defined sets of rules are based on timing, price, quantity or any mathematical model. Apart from profit opportunities for the trader, algo-trading makes markets more liquid and makes trading more systematic by ruling out emotional human impacts on trading activities.
We can create a Regression formula like below :
The dependent variable is the Return on capital invested and can be run across all stocks.
Error term ei can be boosted using Boosting Algos and thus increasing the prediction accuracy.
Now how to choose your Variables and what can be the ideal STOCK Equation :
YOY Quarterly sales growth > 15 andYOY Quarterly profit growth > 20 andNet Profit latest quarter > 1 andG Factor >= 7 andNet Profit latest quarter > .33 ANDOther income latest quarter < Net Profit latest quarter * .5 ANDNet Profit preceding year quarter <= 0 ANDExpected quarterly net profit > 0 ANDSales latest quarter > Sales preceding year quarter ANDReturn on invested capital > 25 andEarnings yield > 15 andBook value > 0 ANDMarket Capitalization > 15
AND Graham Number > Current price ANDPB X PE <=22.50 ANDPEG Ratio >0 ANDPEG Ratio Altman Z Score >=2.5 ANDSales growth 5Years >25 ANDProfit growth 5Years >15 ANDCurrent ratio >2 ANDMarket Capitalization >250 ANDSales >100 ANDPiotroski score > 7AND Dividend yield > 2 ANDAverage 5years dividend > 0 ANDDividend last year > Average 5years dividend ANDProfit after tax > Net Profit last year * .8 ANDDividend last year > .35 AND( Profit growth 3Years > 10 ORProfit growth 5Years > 10 ORProfit growth 7Years > 10 ) OR(Market Capitalization > 3000) AND(Average return on equity 10Years Years > 20) AND(Debt to equity < 1.5) AND(Interest Coverage Ratio > 2) AND( PEG Ratio <= 1) AND(Profit growth 5Years > 20)
AND YOY Quarterly sales growth > 40 andYOY Quarterly profit growth > 40 andAverage return on capital employed 3Years >30 andPrice to Earning ORSales growth 10Years > 10 ANDProfit growth 10Years > 12 ANDOPM 10Year > 12 ANDDebt to equity < 0.5 ANDCurrent ratio > 1.5 ANDAltman Z Score > 3 ANDAverage return on equity 10Years > 12 ANDAverage return on capital employed 10Years >12 ANDReturn on invested capital > 15 ANDSales last year / Total Capital Employed > 2 ANDAverage dividend payout 3years >15
AND PEG Ratio Sales > 500 ANDPrice to Earning < 40 ANDProfit growth > 20 ANDDebt to equity < 0.2 ANDPrice to Cash Flow > 5
OR
EPS last year >20 ANDDebt to equity <.1 ANDAverage return on capital employed 5Years >35 ANDMarket Capitalization >500 ANDOPM 5Year >15
AND Net Profit latest quarter > Net Profit preceding quarter ANDNet Profit preceding quarter > Net profit 2quarters back ANDNet profit 2quarters back > Net profit 3quarters back
AND
EPS latest quarter > 1.2 * EPS preceding year quarter ANDEPS latest quarter > 0 ANDYOY Quarterly sales growth > 25 ANDEPS last year > EPS preceding year ANDEPS > EPS last year ANDProfit growth 3Years > 25 ANDReturn on equity > 17 ANDDown from 52w high < 15 ANDMarket Capitalization > 100
AND
Price to Earning >0 and Price to Earning 10 and Dividend yield >1 and Return on capital employed >10
ANDProfit growth 5Years > Sales growth 5Years ANDSales growth 5Years > 3 ANDReturn on equity > 15 ANDWorking capital 5Years back < 0ANDPrice to Earning >0 and Return on equity 5years growth > 5 and Dividend yield >0
Note : DEBT reacts inversely to the equation . Term period will be a spread over last 15 to 20 Years.
Now , applying boosting algorithm ( like XGBoost) you can reduce the error coefficients.
Based on the above equation and a little variation choosing a flattened NN( Neural Network ) below stocks can be looked upon for Indian stock market.
1) RELIANCE INDUSTRIES2) DCB BANK3) KAJARIA CERAMICS4) INFOSYS
5) INDO COUNT INDUSTRIES


No comments have been added yet.