
Was I too harsh?
I'm always delighted to see statistics being mangled, as it's good fun untangling them. Sometimes, though, they're such a mess that it's hard to do anything other than mock.
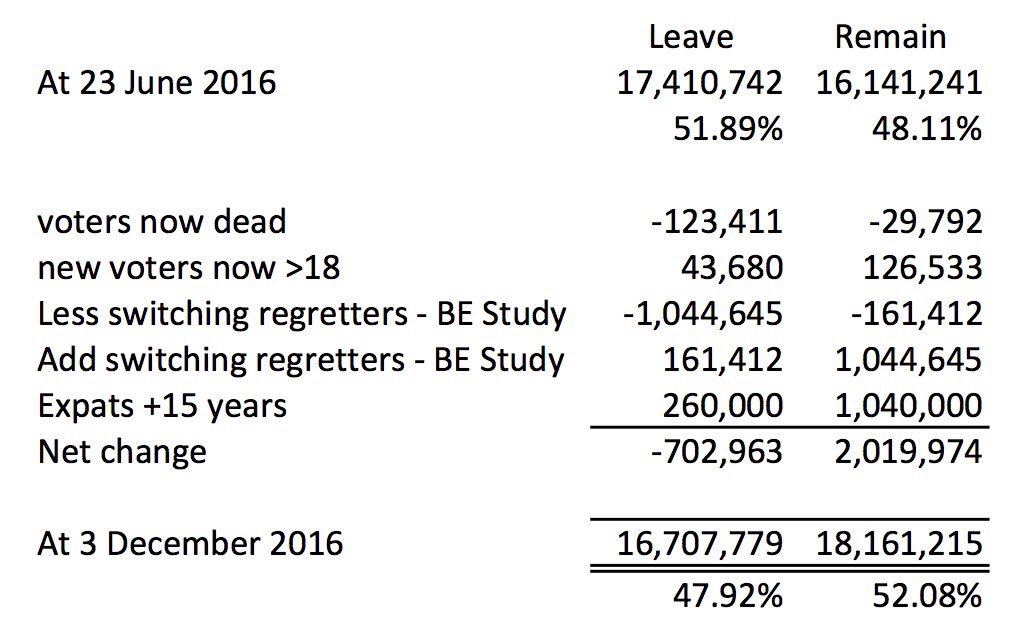
This was the case with a story reported by the online magazine ShortList . it claimed that '120,000 leave voters have died since Brexit.' That seemed an impressive claim, so I took a look at the analysis, apparently sourced from the Twitter feed of someone called Steve Lawrence, who is an architect:
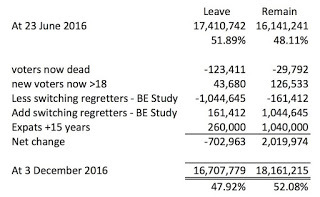
One statistical no-no jumps out here without even seeing where the data came from. We're being given figures in the 16-18 million range, based on some interesting manipulation which includes several estimates. Yet the values are given accurate to 1 - note how the big totals end in 9 and 5. You can either present a spuriously accurate number like these and provide an error range, or, less likely to mislead, you can round to your error level and still give an error range. What you can't do is give these as actual numbers, as done here.
I complained, saying amongst other things 'No one knows how many leave voters have died - and there is no sensible statistical method to discover that number.' A commenter, Robert Fuller, was quick to take me on:
This was the case with a story reported by the online magazine ShortList . it claimed that '120,000 leave voters have died since Brexit.' That seemed an impressive claim, so I took a look at the analysis, apparently sourced from the Twitter feed of someone called Steve Lawrence, who is an architect:
One statistical no-no jumps out here without even seeing where the data came from. We're being given figures in the 16-18 million range, based on some interesting manipulation which includes several estimates. Yet the values are given accurate to 1 - note how the big totals end in 9 and 5. You can either present a spuriously accurate number like these and provide an error range, or, less likely to mislead, you can round to your error level and still give an error range. What you can't do is give these as actual numbers, as done here.
I complained, saying amongst other things 'No one knows how many leave voters have died - and there is no sensible statistical method to discover that number.' A commenter, Robert Fuller, was quick to take me on:
There's a perfectly sensible statistical method: Let me have a go right now:Hmm. I'm afraid I was quite firm in response - and here's where I'm asking whether I was too harsh:
1. Source the number of people over 65
2. Source the death rate of over 65s
3. Multiply the death rate by the population and the time
4. Now split that figure based on the exit polls.
repeat for each age group.
Done.
Woah, slow down their, tiger. So we’re taking polls we know were wrong and somehow combining them with other figures to produce numbers given to an accuracy of 1 in 16 million? Could you explain the statistical technique used? Feel free to be technical, I’ve got a Masters in the area. Which technique do you use to merge a poll which doesn’t have ages attached with age-based data sets?To be fair, I only addressed a couple of the issues with his description, but it seemed enough.


date newest »
 Jim wrote: "Not too harsh, Mr. Clegg. I personally regret that only "Probability" and not "Statistics" was offered at my small Engineering school - the latter, being applied, is more generally useful on its ow..."
Thanks. No I haven't specifically written about significant figures, but certainly about using values that sound a lot more accurate than the source allows you to assume.


Your point about polling figures is well taken. So was your "significant figures" point (using a more prosaic "1 in 16 million" description).
Sad to say, that fewer than 10% of the general population know what a significant figure is. This includes that architect (apparently).
(As a former commerical electrical engineer, I could go on about architects - but will refrain)
Have you written about significant figures? My son's high-school chemistry book had an example, which I found illuminating:
What is the sum of:
16,000
21.3
1.47
A (not "the") valid answer is 16,000.
Of course this is based on the implication that the large figure could range from 15,500 to 16,499.
The chem book helped me considerably by expressing the problem like this:
What is the sum of:
16,???.??
21.3?
1.47