
On Kansas: Mendacity by Misdirection
Do shocks to agriculture and aircraft really explain Kansas’s dismal economic performance? If only one looked at Kansas GDP, would Kansas look just terrific?
Political Calculations takes me to task, claiming my analyses of the Kansas economy equate to “junk science.” In particular, he argues that the use of the Philadelphia Fed’s coincident indices provides a misleading picture of economic activity in Kansas. This argument is just one more instance of either incompetence (see here and here) or sheer mendacity (see here).
The Critique of the Economic Activity Proxy Variable
Ironman asserts that because Kansas has an agricultural sector, the coincident index for Kansas is does not well depict overall economic activity. Yet the graph that Ironman himself posts indicates that the correlation between the Philly Fed’s coincident index and GDP for Kansas is between 0.55 and 0.70. (He also has a fixation on the agriculture share, even though as of the last reported quarter, it only accounts for 5.8% of value added.)
He then argues that my assessment that Kansas’s economic performance is incorrect because the “wrong” measure is used. However, he fails to note the instances where I have used his preferred measure, state GDP, to arrive at the same conclusion: Kansas underperforms.
State GDP Tells the Same Story as the Coincident Index
Compare the results of two ex post historical simulations, comparing actual economic performance against predicted on the basis of historical correlations. The first is from an error correction model using coincident indices (quarterly averages of coincident indices, 1991Q1-2010Q4, 1 lag of first differences, assumes weak exogeneity of US economic activity, first difference of lagged drought variable included); the second is from June 23, 2016, using state GDP.
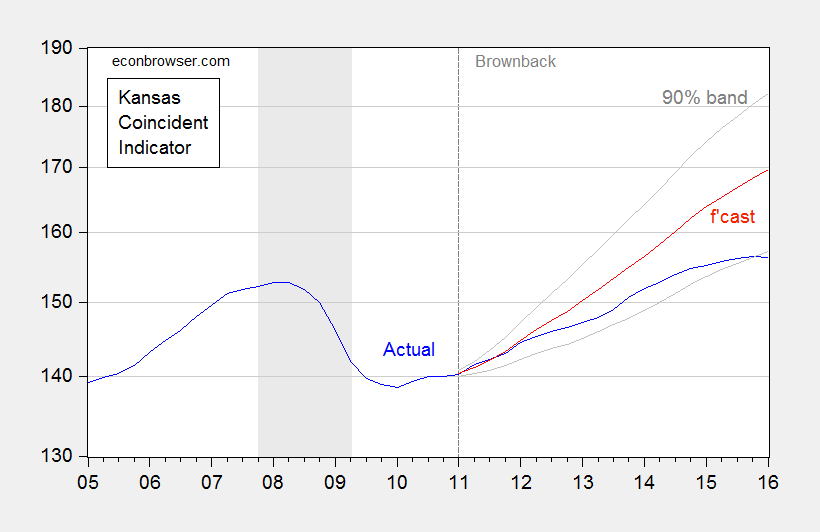
Figure 1: Coincident index for Kansas (blue), ECM forecast (red), and 90% confidence band (gray). For forecast, see text. Source: Philadelphia Fed (May releases) and author’s calculations.
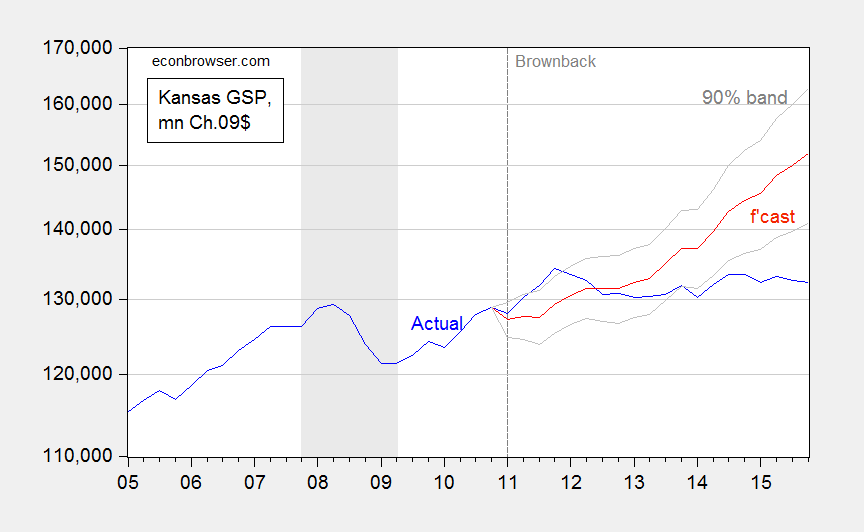
Figure 2: Kansas GDP, in millions Ch.2009$ SAAR (blue), ex post historical simulation (red), 90% prediction interval (gray lines). Forecast uses equation (1). NBER defined recession dates shaded gray. Log scale for vertical axis. Source: BEA, NBER, and author’s calculations.
In other words, even if one uses the GDP measure Ironman prefers, Kansas is still underperforming against a counterfactual. Indeed, the gap between the US and Kansas is larger using the GDP measure: 15.1% using GDP vs. 8.1% using coincident indices. So his criticism of the use of coincident indices is merely a means to distract the unwary reader.
Conclusion
Using either state GDP or coincident indices, Kansas is doing poorly against her neighbors, and against a counterfactual based on historical correlations.
Do not look for reasonable economic analysis from people who keep on asserting the same things after being shown the irrelevance of their criticisms, rely on nominal figures, infer an imminent massive GDP revision based on a misunderstanding of the nature of Chain weighted indices , and (in his MyGovCost incarnation) spin tales of a conspiracy asserting the US Government’s active destabilization of the world economy in order to lower borrowing costs.
Postscript: Ironman asserts that real Kansas GDP stripped of agriculture and manufacturing looks much better. Unfortunately, his graph in his post plots a series where he calculated Kansas GDP ex-agriculture and manufacturing by simply subtracting real agriculture and real manufacturing — both measured in Chain weighted dollars — from real GDP measured in Chain weighted dollars (the red line in Figure 3 below). This is, quite plainly, the wrong procedure, as I explained in this post.
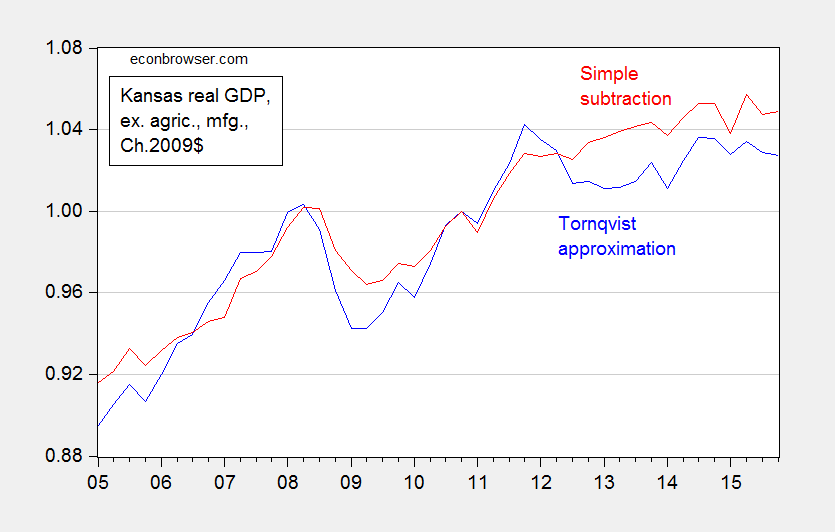
Figure 3: Kansas real GDP ex. agriculture and manufacturing, calculated using Törnqvist approximation (blue), and calculated using simple subtraction (red). Source: BEA and author’s calculations.
So a third conclusion: Don’t trust analyses from people who don’t understand the data they are working with.


Menzie David Chinn's Blog


