
US Policy Uncertainty post-Brexit Revised Down
But still looks darned high. Wonder what it is in the UK…
As reader Neil points out, the big spike in policy uncertainty was revised down. But still, uncertainty on 6/25 was still remarkably high, at 564.
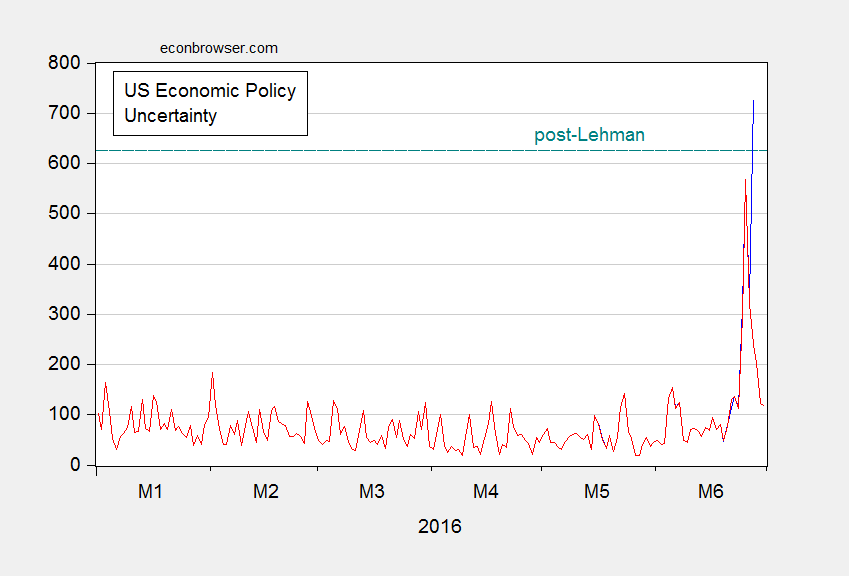
Figure 1: Daily economic policy uncertainty index, accessed 6/27 (blue), accessed 7/1 (red). Horizontal teal dashed line denotes maximum value post-Lehman. Source: Baker, Bloom and Davis, via Economic Policy Uncertainty accessed 6/27 and 7/1.
As Nick Bloom notes in a comment on the previous post on policy uncertainty post-Brexit:
It is also hard to compare Lehmans to Brexit and say which is worse – Lehmans was truly terrible as a financial shock but potentially narrower in scope, while Brexit is less damaging on impact but may be worse long-run if global trade and pro-growth centrist policies in Europe unravel. Ever since WWII these policies have helped promote European growth, and in a post-EU world Southern Europe could swing wildly to the left and Northern Europe become more insular.


Menzie David Chinn's Blog


