
Kansas in (Technical) Recession
The BEA released quarterly state GDP figures today. As of 2015Q4, Kansas has just experienced two consecutive negative GDP growth, a distinction shared with only three other states — Alaska, Oklahoma and Wyoming (North Dakota experienced three quarters of negative growth, but experienced positive growth in Q4). Over the past five quarters, Kansas has experienced four quarters of negative GDP growth.
Figure 1 illustrates how Kansas economic performance measured on the broadest basis (GDP) fares against that of the United States as a whole.
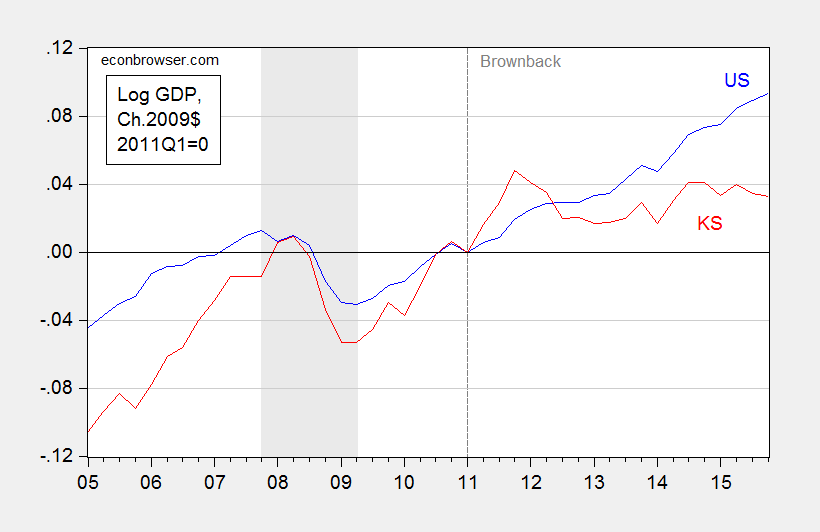
Figure 1: Log real GDP for US (blue), and for Kansas (red), all in Ch.2009$, 2011Q1=0. Dashed line at beginning of Brownback administrations. NBER defined recession dates shaded gray. Source: BEA, and author’s calculations.
It is of interest to note that prior to the Great Recession, Kansas was growing faster than the US. During the recession, it fell further than the Nation as a whole. And subsequently, it has been growing slower than the Nation, particularly post 2011Q1.
Is the deviation from pre-recession growth statistically significant? In order to answer this questions, one needs to establish the counterfactual of what would have happened if the historical relationship held. I do this formally be using the 2005-2010 period (2005 is the beginning of the quarterly state GDP series, 2010 is just before Governor Brownback begins his terms.) I use an error correction model involving Kansas real GDP, US real GDP (measured on the same basis as the Kansas GDP), and a variable to account for weather conditions in Kansas — the Palmer Drought Severity Index (PSDI) for Kansas. This particular specification implies that there is a long run cointegrating relationship between Kansas GDP and US GDP, and that drought has only a (statistically) short term impact on growth.
The estimated error correction model is:
(1) ΔyKSt = -7.26 – 0.29yKSt-1 + 0.65 yUSt-1 + 1.48ΔyUSt – 0.09 ΔyUSt-1+ 0.0016droughtt + ut
Adj-R2 = 0.53, SER = 0.0092, N = 22, DW = 1.87, Breusch-Godfrey Serial Correlation LM Test = 1.62 [p-value = 0.23]. Bold face denotes statistical significance at 10% msl, using HAC robust standard errors. y denotes log real GDP, and drought is the Palmer Drought Severity Index for Kansas (PDSI, lower is more severe). Regression results [PDF]. Data [XLSX].
The data used in this analysis (and for calculations in Figures 3 and 4) are here. Log Kansas and US GDP appear I(1) (fail to reject Elliott-Rothenberg-Stock unit root test) and Kansas PDSI (borderline) rejects a unit root.
Using this ECM to dynamically forecast out of sample in an ex post historical simulation (i.e., using realized values of US and Kansas GDP, and the drought variable), I find that (1) actual Kansas GDP is far below predicted (19.5 billion Ch.2009$ SAAR, or 14.8%, as of 2015Q4), and (2) the difference is statistically significant. This is shown in Figure 2.

Figure 2: Kansas GDP, in millions Ch.2009$ SAAR (blue), ex post historical simulation (red), 90% prediction interval (gray lines). Forecast uses equation (1). NBER defined recession dates shaded gray. Log scale for vertical axis. Source: BEA, NBER, and author’s calculations.
Why is Kansas lagging so much? Apologists have listed weather, aircraft manufacturing, and oil (since the original criticism by Prof. Russell has been deleted, see quotes in my post). In Figure 3, I show the contributions to state GDP growth, broken down into (i) agriculture, logging, hunting, fishing, (ii) durables manufacturing, (iii) mining, and (iv) rest-of-economy.
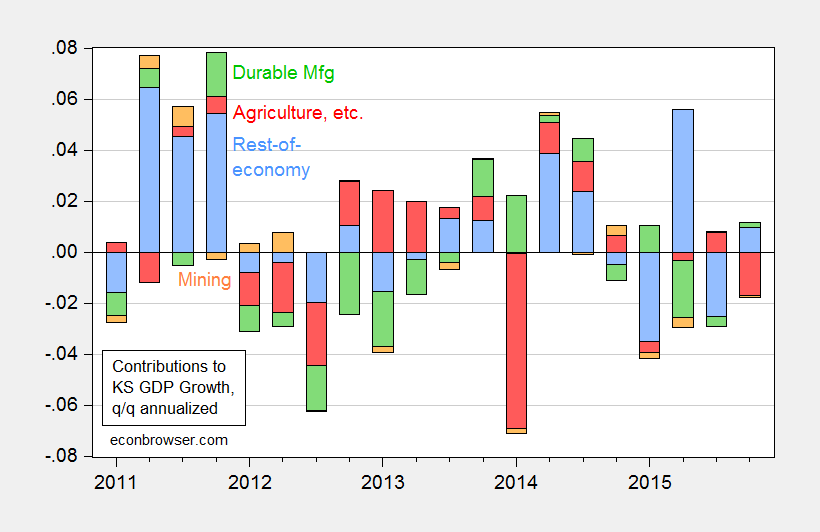
Figure 3: Contributions to Kansas real state GDP growth, from agriculture (red), durable manufacturing (green), mining (orange), and rest-of-economy (light blue). Source: BEA and author’s calculations.
Agriculture subtracted from growth in 2015Q4, and had an outsized impact in 2014Q1. However, it has added over most of the other quarters since 2011Q1. Of the cumulative output increase since 2011Q1, roughly one third is accounted for by agriculture. Note that mining (including energy extraction) can’t be claimed to be the culprit, since that category only accounts for a minimal negative contribution over the last year.
If none of the usual apologists’ suspects are plausible, then what might be the cause. One candidate is government spending on goods and services. In Figure 4, I plot real government spending by state and local authorities (this is a broader spending measure than used in this post), along with a 2005-2010 trend.
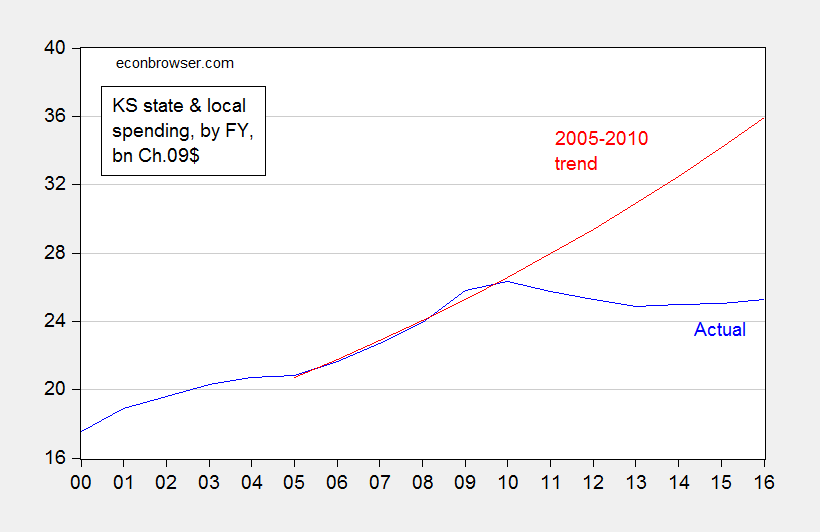
Figure 4: Spending by state and local authorities in bn. Ch.2009$, by Fiscal Year (blue), and log-linear time trend estimated from 2005-2010 (red). Nominal figures deflated using nationwide PCE deflator by Kansas FY; assumes 2016 inflation equals 2015 inflation. Note: Spending data is “estimated”. Source: US Government Spending website, BEA via FRED, and author’s calculations.
The shortfall as of FY2016 is about 10.6 billion Ch.2009$. The GDP shortfall as of 2015Q4 is about 19.5 billion Ch.2009$. The implied fiscal spending multiplier is about 1.8, holding constant tax cut effects. Taking into account tax cuts, the multiplier is smaller — although the extent to which it is depends on the composition of spending (transfers vs. purchases). In any case, 1.8 is not far from the conventional regional multiplier estimate of approximately 1.5 [1].
Update, 3:15PM Pacific: Given equation (1) contains nonsignificant coefficient on lagged growth in US income, it’s useful to see if the results change substantively when dropping that variable. The regression results remain largely unchanged, but the standard errors are slighty smaller, so the prediction interval is commensurately tighter. This is shown in Figure 5.
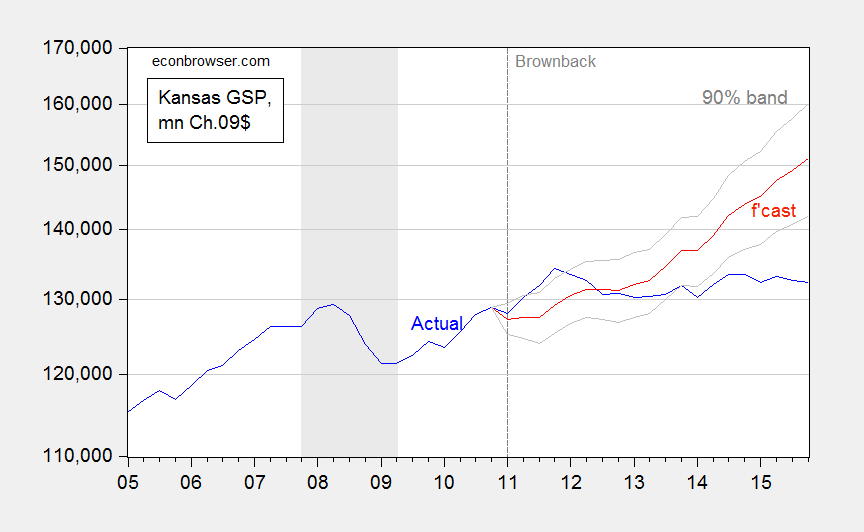
Figure 5: Kansas GDP, in millions Ch.2009$ SAAR (blue), ex post historical simulation (red), 90% prediction interval (gray lines). Forecast uses equation (1), dropping lagged first difference of US GDP. NBER defined recession dates shaded gray. Log scale for vertical axis. Source: BEA, NBER, and author’s calculations.


Menzie David Chinn's Blog


