
Data Paranoia Watch: Employment Edition
Which one of these texts is drawn from a real article?
What a coincidence. Just as momentum was building towards an interest rate hike by the Fed, along comes a dismal jobs report that takes any increase off the table. Contrary to the general perception, this is a lucky break for Democrats. … Given all that is stake, it is surprising that no one has questioned whether the jobs report might have been massaged by the Labor Department
Or.
Friday’s Bureau of Labor Statistics jobs report turned out to be a real doozy, as they say, with the number coming in way, way below expectations. Analysts were looking for 155,000 new non-farm payrolls, but the BLS statistical massaging and manipulation machine only managed to spit out a meager 38,000.
This is a trick question! They are both from actual articles, the first from Fox News, and the second from the Gilmo Report.
I’m not taking issue with the assertion that the estimates of employment growth could be wrong; it’s the assertion that they are deliberately manipulated to go one way or the other which troubles me. Like previous instances — Senator Barraso, Jack Welch, former Rep. Allan West, Zerohedge — it’s easy to dispense with the view that the numbers were massaged to get a certain, wildly distorted, picture.
First, 12 month changes in seasonally adjusted and not seasonally adjusted nonfarm payroll (NFP) employment series look similar.
Second, the BLS NFP seasonally adjusted and a series adjusted using a standard seasonal adjustment series, ARIMA X-12 (over the entire sample post-1986 sample) look quite similar in levels.
Third, the level of the BLS private nonfarm payroll series and the corresponding ADP series match almost exactly.
These points are illustrated in Figures 1-3.
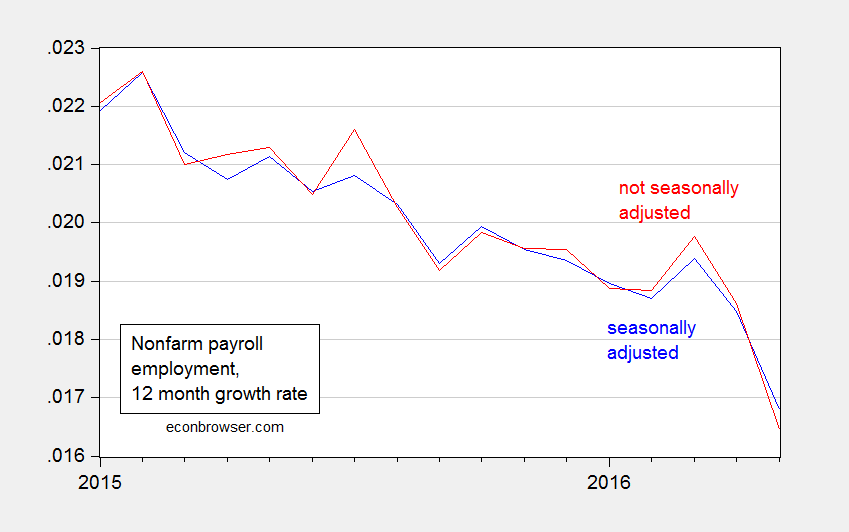
Figure 1: 12 month growth rates in seasonally adjusted nonfarm payroll employment (blue), and in not seasonally adjusted nonfarm payroll employment (red). Source: BLS via FRED, and author’s calculations.
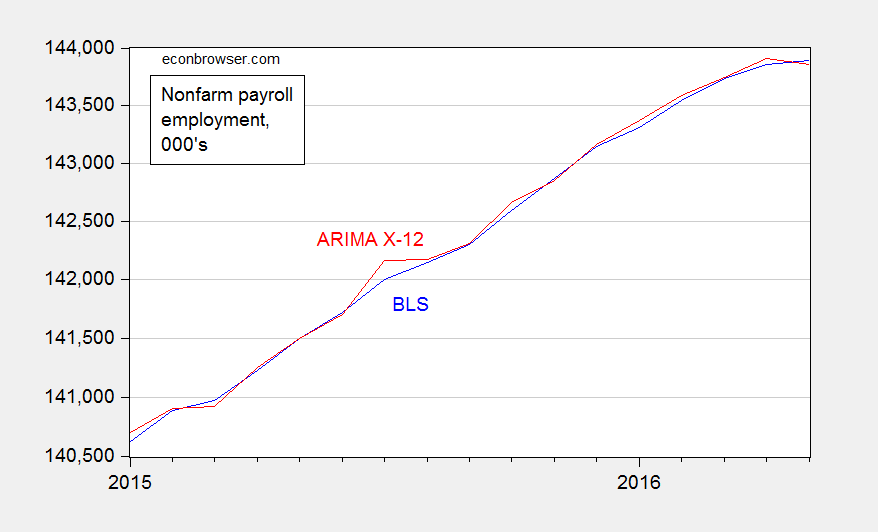
Figure 2: Seasonally adjusted nonfarm payroll employment as reported by BLS (blue), and not seasonally adjusted nonfarm payroll employment, seasonally adjusted using ARIMA X-12 over entire 1986-2016 period (red). ARIMA X-12 uses EViews default settings, including multiplicative seasonals. Log scale. Source: BLS via FRED, and author’s calculations.
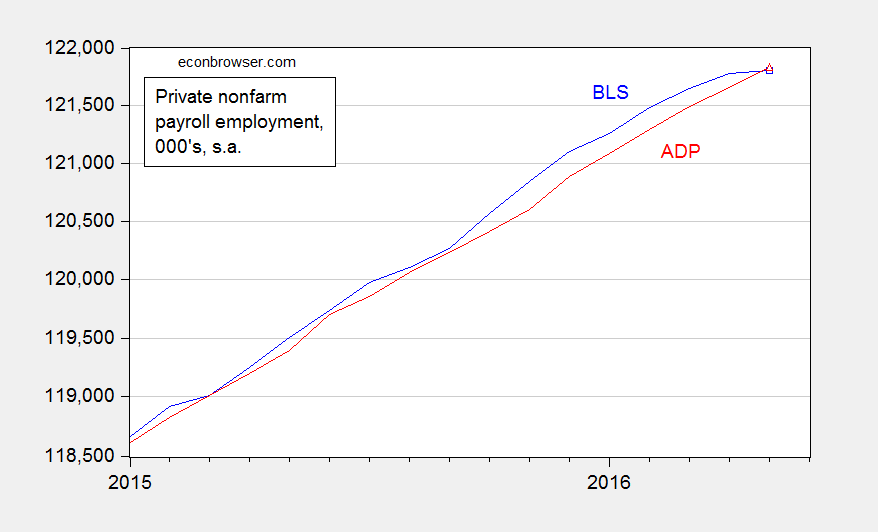
Figure 3: Seasonally adjusted private nonfarm payroll employment as reported by BLS (blue), and as reported by ADP (red). Log scale. Source: BLS and ADP via FRED.
If the BLS were really trying to manipulate the employment series to be lower than actual, then it did a poor job. If it were trying to manipulate it to be higher, it did a poor job — since it hit the mark on private NFP. (This is not to say there isn’t a bias; Owyang et al. (2014) notes a downward bias in preliminary vs. revised of about 18,000, since January 1980.)
It’s a slightly different story on m/m changes (rather than levels). Then BLS was too low relative to my (conventional) adjustment for NFP, and too high relative to ADP for private NFP.
On the other hand, if one wants to argue that adjustment for seasonals might possibly be improved, then we’re in agreement; see Jonathan Wright (his estimate is that the BLS series is 40,000 too high). Moreover, it’s always important to keep in mind that the margin of error for m/m changes is about plus/minus 100,000…[1]
Of course, these claims pale into insignificance when compared against Donald Trump’s assertion that the “real unemployment rate” is 42%. [2]


Menzie David Chinn's Blog


