
Some Messages from the Employment Release
Employment growth is downgraded, according to several measures, and manufacturing employment is particularly hard hit.
Not only was net employment growth very low, at 38,000, the previous months’ estimates were revised downward. Even after accounting for the 37,000 subtraction due to the Verizon strike [CR], May’s number was not good.
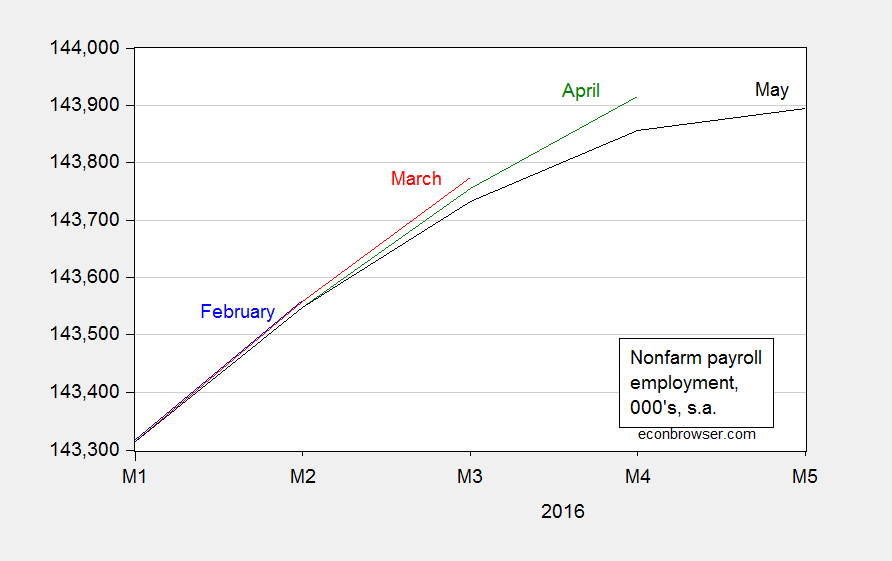
Figure 1: Nonfarm payroll employment, February release (blue), March release (red), April release (green), and May release (black). Source: BLS.
A longer span of data puts growth in perspective. The household series adjusted to the NFP concept also shows a slowdown.
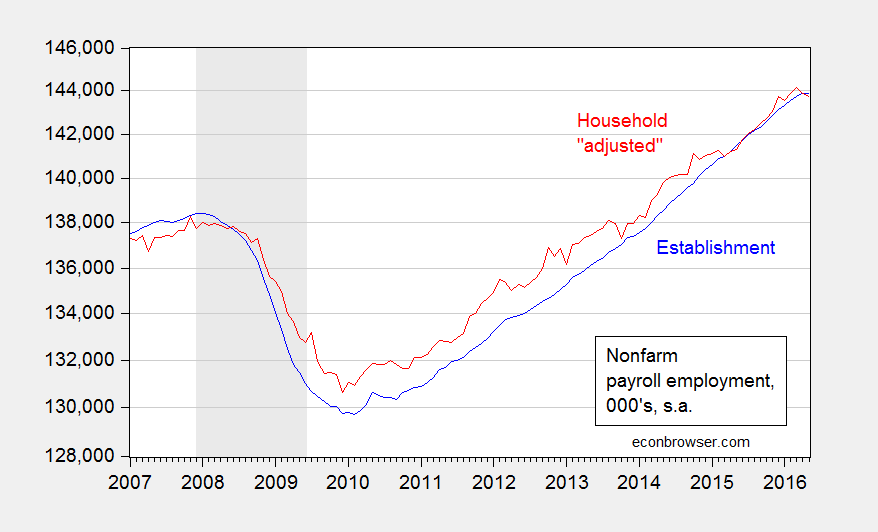
Figure 2: Nonfarm payroll employment, May release (blue), and household series adjusted to NFP concept (red). Source: BLS.
Of particular concern is the slowdown due to external conditions, including the dollar’s value.
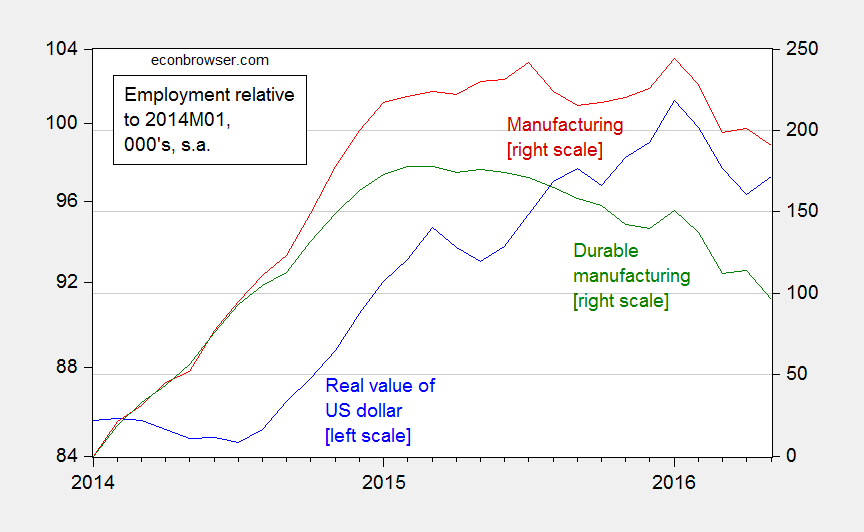
Figure 3: Real value of the US dollar (blue, left scale), manufacturing employment (red, right scale), and durable manufacturing employment (green, right scale), both relative to 2014M01, 000’s. Source: Federal Reserve Board and BLS.
Since January 2014, manufacturing has accounted for less than 200,000 of the 6.3 million cumulative net NFP employment gain.


Menzie David Chinn's Blog


