
Periodic Table of Storytelling
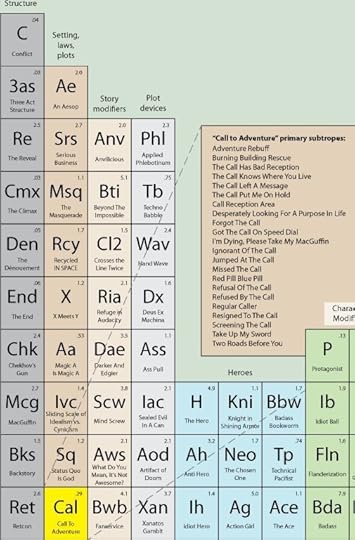
A fun storytelling visualization appears in this Periodic Table of Storytelling.
The digital aspect is twofold. First, it uses several digital tools to work, including references to one excellent, vast wiki resource, TVTropes. Second, it addresses numerous digital stories.
Here's one corner - the whole thing's too big to cram into a single post:
It's an engaging way of thinking about narratives, and could easily join the story creation tools I mention in chapter 13.
(thanks to Peter Naegele!)
The digital aspect is twofold. First, it uses several digital tools to work, including references to one excellent, vast wiki resource, TVTropes. Second, it addresses numerous digital stories.
Here's one corner - the whole thing's too big to cram into a single post:

It's an engaging way of thinking about narratives, and could easily join the story creation tools I mention in chapter 13.
(thanks to Peter Naegele!)


No comments have been added yet.
The New Digital Storytelling

This blog springs from my 2011 book, The New Digital Storytelling.
- Bryan Alexander's profile
- 316 followers

