
Fed Tightening: Reasons to Go Slow from the GDP Release
The 2016Q1 advance release, discussed at length by Jim, provides additional evidence in favor extreme caution in tightening monetary policy — maybe even a reconsideration of the June rate hike that seems, according to conventional wisdom, a done deal.
First, the output gap increased slightly in 2016Q1. Even taking into account the uncertainty surrounding this sure-to-be revised estimate of first quarter growth, it doesn’t appear like the output gap (as implied by CBO’s estimate of potential) is still shrinking.
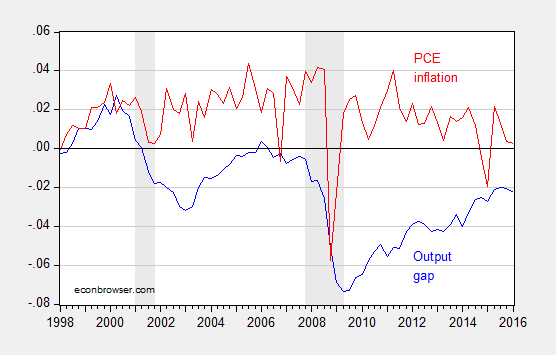
Figure 1: Output gap (blue) and q/q annualized PCE inflation (red), both calculated in log terms. NBER defined recession dates shaded gray. Source: BEA, CBO (January 2016), NBER, and author’s calculations.
Second, the interest sensitive components of aggregate demand — nonresidential investment and net exports — are exerting drag on growth, in accounting terms.
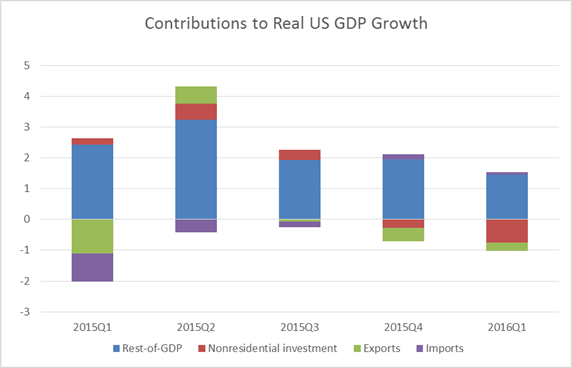
Figure 2: Contributions to real US GDP growth in percentage points, q/q SAAR, from nonresidential investment (red), exports (green), imports (purple), and rest of GDP (blue). Source: BEA, and author’s calculations.
While one might argue that investment is down because of the collapse in investment associated with the energy sector noted by Jim, what’s true is nonresidential investment excluding mining and well drilling is also down.
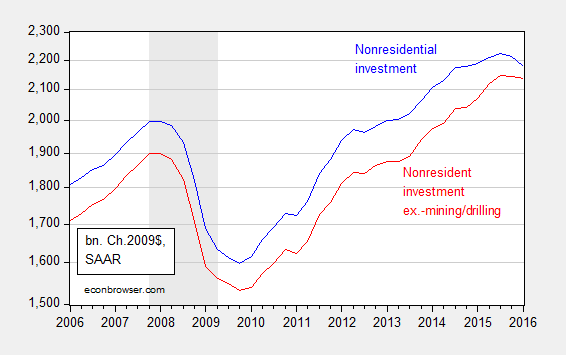
Figure 3: Nonresidential fixed investment (blue), and ex.-investment in structures, mining exploration, well shafts, and drilling (red), in billions of Ch.2009$, SAAR. NBER defined recession dates shaded gray. Log scale. Source: BEA and author’s calculations.
Third, net exports are likely to continue to stagnate, given the appreciation of the dollar that has already occurred.
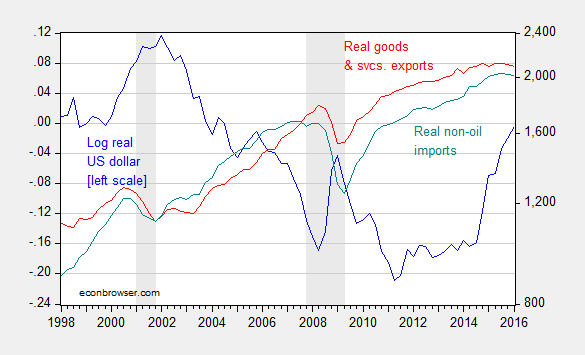
Figure 3: Log real value of the US dollar (against a broad basket) (blue, left scale), and exports of goods and services (red, right log scale), and imports of non-oil goods (teal, right log scale), both in billions of Ch.2009$, SAAR. NBER defined recession dates shaded gray. Source: Federal Reserve Board, BEA, and NBER.
Note that while US exports could decline because of either the surging dollar or the slowing world economy, the decline in US imports is striking. A stronger dollar (driven by interest differentials) implies a higher level of imports, so the decrease in imports is suggestive of a slowing US economy. Of course, there are only two months of trade data incorporated into the advance release, so it may be the March data (coming later this week) will erase this decline in imports.
My estimates using an error correction model involving exports, world GDP, and the real dollar and two lags of first differences over the 1973Q1-2016Q1 indicate a short run price elasticity of about 0.10, and a long run of 1.3. (See this post for a description of the methodology.) The half life of a deviation from long run (statistical) equilibrium in the export relation was about 2 years. That means that we have yet to see all of the depressing effects of the dollar appreciation that starts in 2014Q4.
A Fed tightening in June will likely further appreciate the dollar, thereby exacerbating the external drag on the US economy.


Menzie David Chinn's Blog


