
Another weak quarter for U.S. GDP
The Bureau of Economic Analysis announced today that U.S. real GDP grew at a 0.5% annual rate in the first quarter. That’s disappointing, even by standards of the weak growth that has become the norm since getting out of the Great Recession.
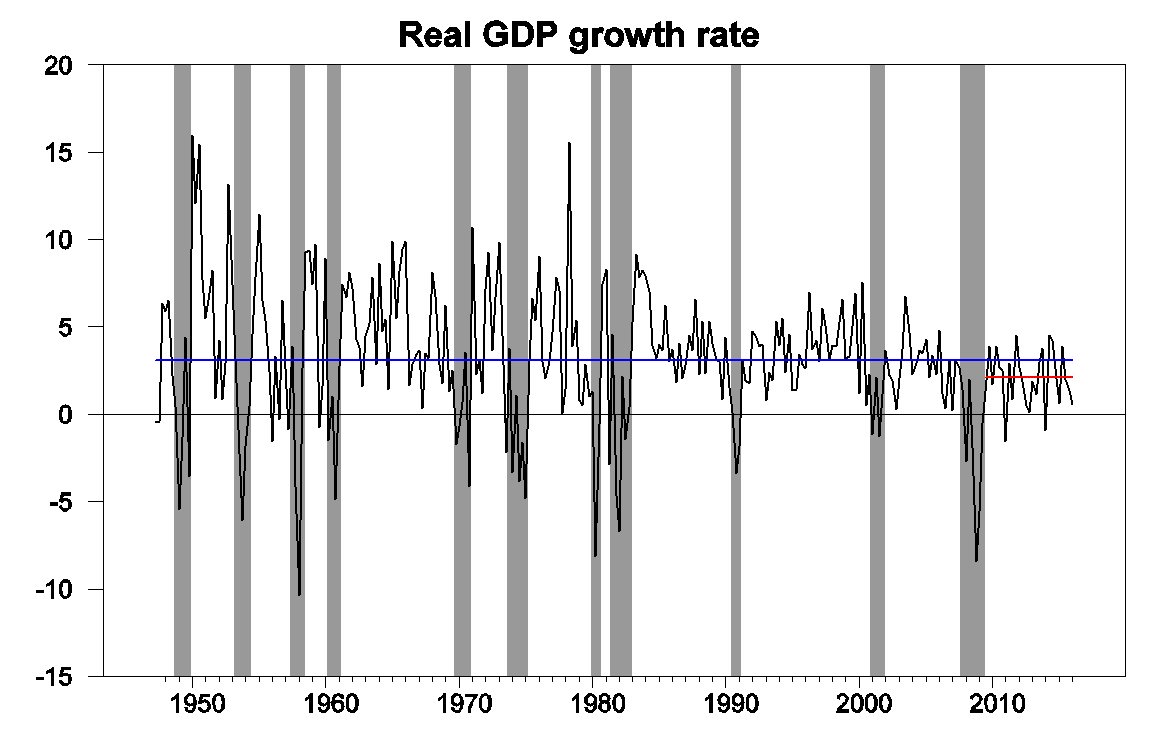
Real GDP growth at an annual rate, 1947:Q2-2016:Q1, with historical average (3.1%) in blue and post-Great-Recession average (2.1%) in red.
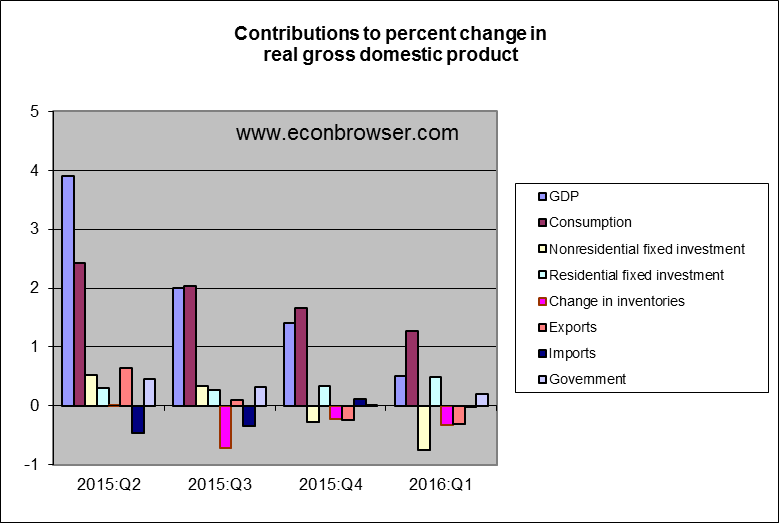
Housing investment was one bright point. Another was growth in government spending at the state and local level which more than made up for a drop at the federal level. An important drag came from the decline in exports, reflecting economic weakness outside the United States. The biggest negative was a drop in nonresidential fixed investment, which by itself subtracted 3/4 of a percent from the Q1 annual growth rate.
Further declines in investment spending in the oil-producing sector contributed to that. Domestic spending on mining exploration, shafts, and wells is now down more than $100 billion at an annual rate (about 6/10 of a percent of total U.S. GDP) from the levels seen in the summer of 2014.
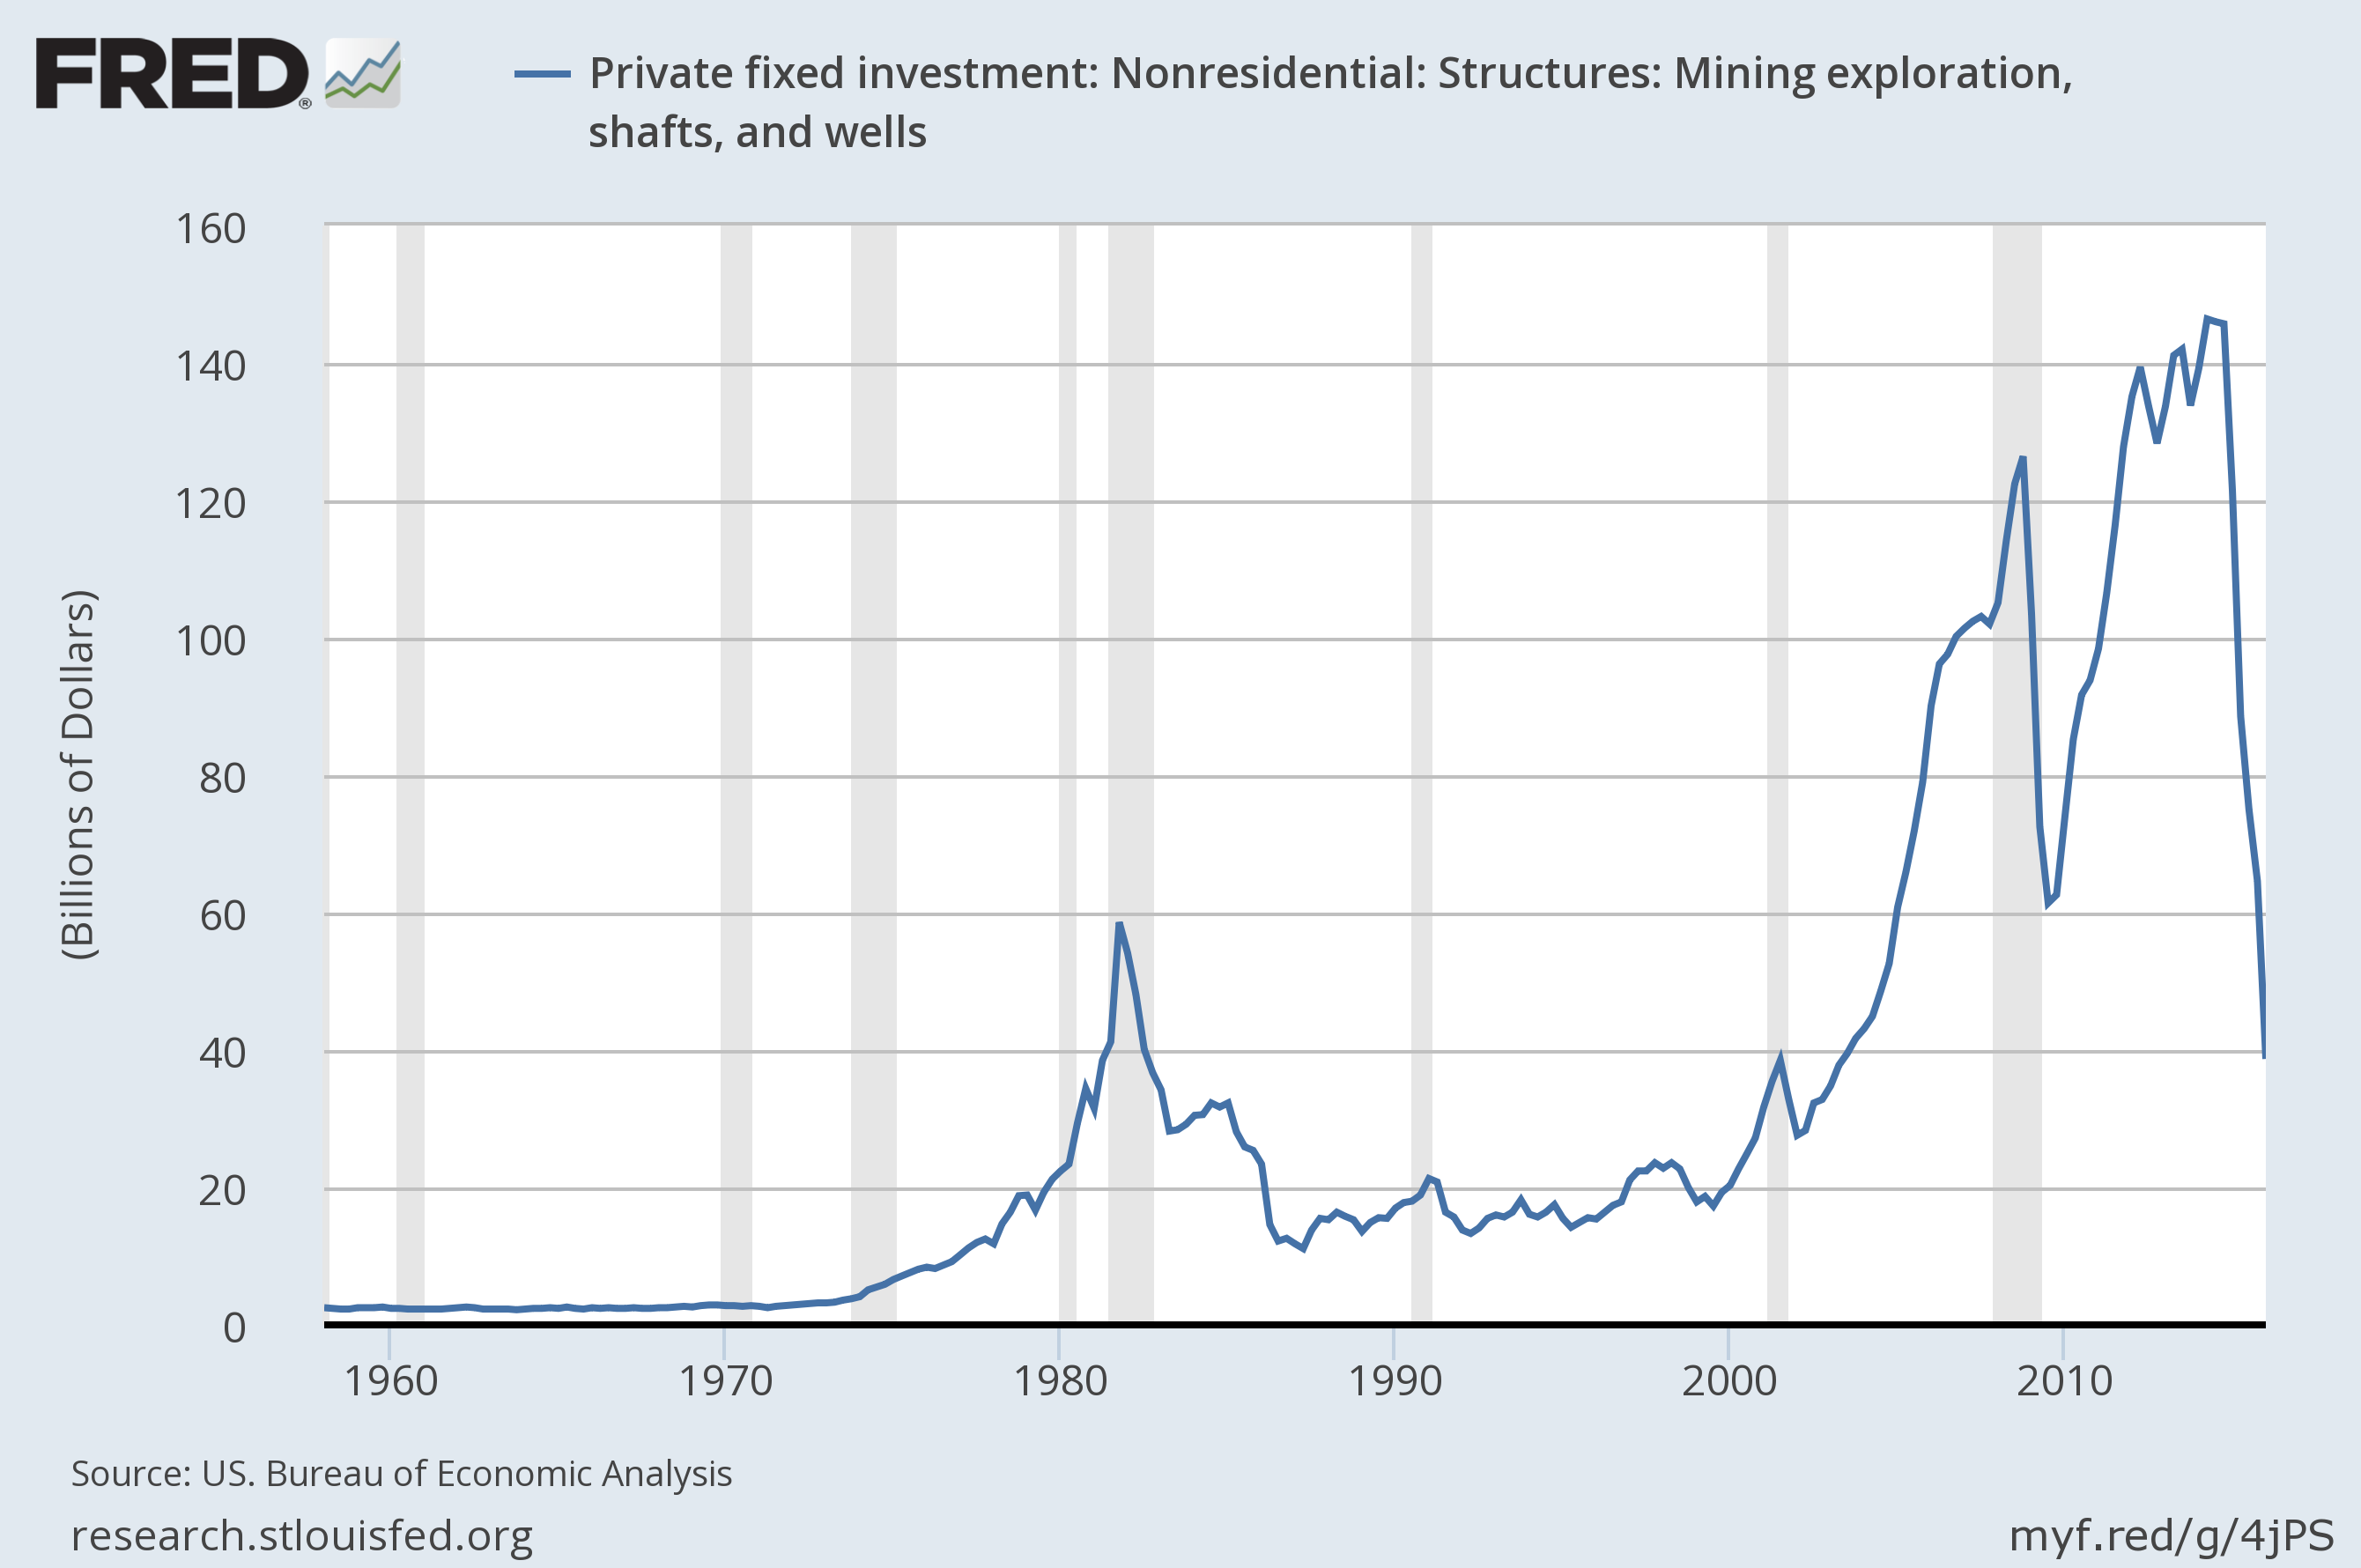
Expenditures on private fixed nonresidential structures investment in mining exploration, shafts, and wells. Source: FRED.
The disappointing Q1 GDP numbers brought our Econbrowser Recession Indicator Index up to 15.7%. The index uses today’s data release to form a picture of where the economy stood as of the end of 2015:Q4. That’s still significantly below the 67% threshold at which our algorithm would declare that the U.S. had entered a new recession.
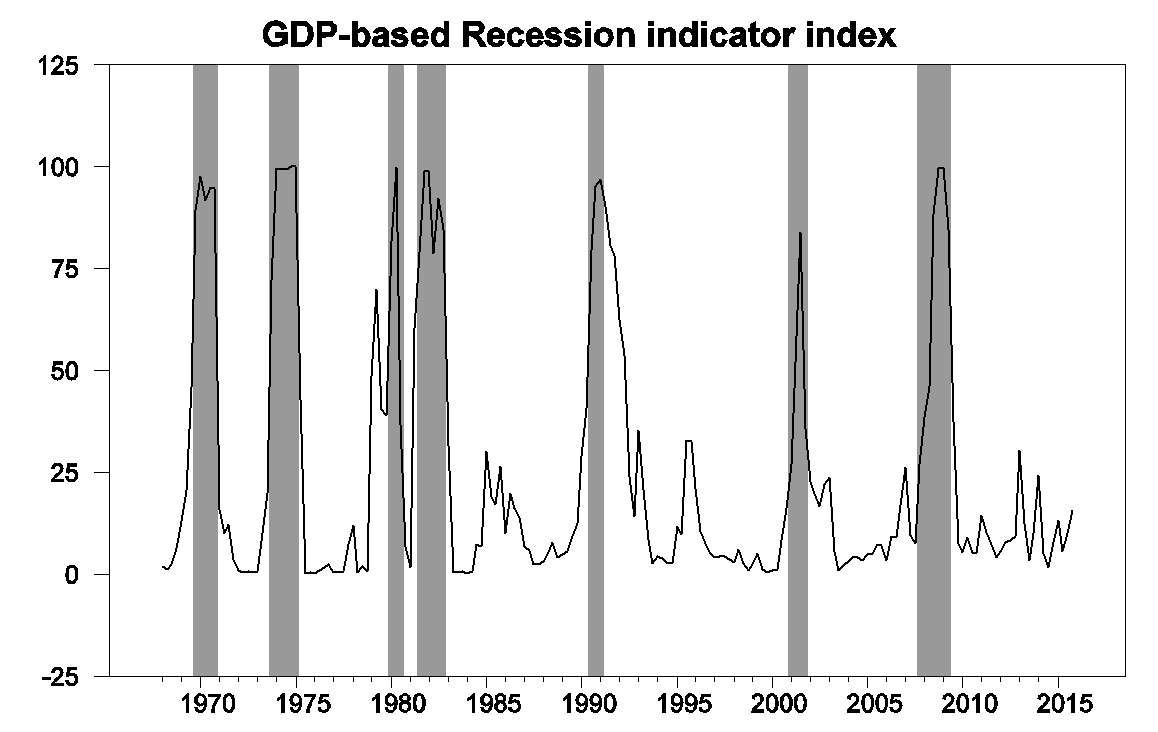
GDP-based recession indicator index. The plotted value for each date is based solely on information as it would have been publicly available and reported as of one quarter after the indicated date, with 2015:Q4 the last date shown on the graph. Shaded regions represent the NBER’s dates for recessions, which dates were not used in any way in constructing the index, and which were sometimes not reported until two years after the date.
U.S. growth is certainly facing some significant headwinds, and lower oil prices do not appear to have helped. Nevertheless, the employment numbers have been showing strong momentum, and housing can make further positive contributions in the coming two years. Maybe not enough to get us back to 3%. But we can still hope to get back to 2%.


Menzie David Chinn's Blog


