
Data Baking?
Ironman of Political Calculations asserts that my use of Philadelphia Fed coincident indices is misleading, particularly in reference to Kansas’s performance is my attempt to overstate the poor performance of that state’s economy. He argues that one should use a comprehensive measure, like gross domestic product — so without further ado, let’s compare Kansas relative performance using both measures.
Figure 1 depicts the Kansas/US ratios, where an increase denotes an improvement in Kansas’s performance relative to the US.
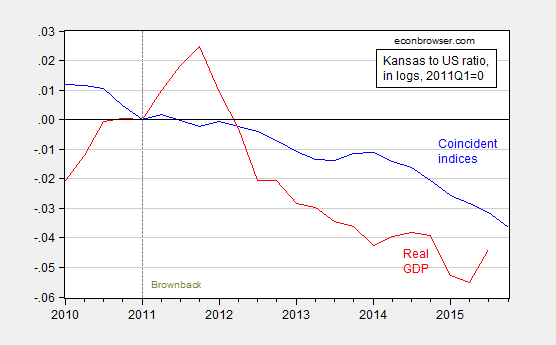
Figure 1: Log coincident index for Kansas divided by US (blue), and log GDP for Kansas divided by US (red), both normalized to 2011Q1. Dashed line at 2011Q1, accession of Governor Brownback. Source: BEA, author’s calculations.
Note that performance measured using Ironman’s preferred measure, state GDP, is 1.3% percentage points worse (in log terms) than using coincident indices, as of 2015Q3 (latest available data).
Ironman has also criticized me for attributing to Governor Brownback’s policies effects on Kansas economic activity that should properly be attributed to the drought. Figure 2 depicts Kansas relative performance (4 quarter change in log ratio Kansas to US GDP), and the Palmer Drought Severity Index (PDSI), where lower values denote worse drought. A priori, one expects a positive correlation.
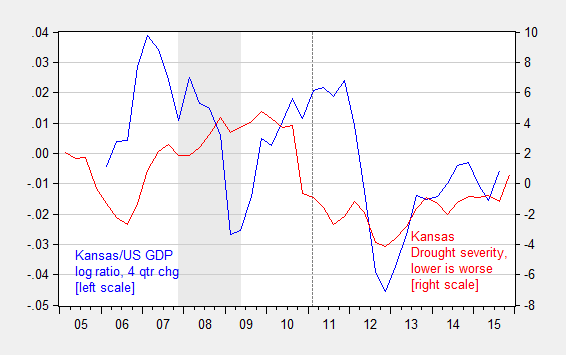
Figure 2: Four quarter difference in log ratio of Kansas GDP to US GDP (blue, left scale), and Palmer Drough Severity Index, quarterly average of monthly data (PDSI) (red, right scale). Source: BEA, NOAA, NBER, and author’s calculations.
The astute observer will note that there is a pretty poor correlation between relative growth of Kansas and the drought index. More formally, run a regression over the 2005Q3-2015Q3 period:
ΔyKSt = -0.001 + 0.106 ΔyKSt-1 + 1.300ΔyUSt + 0.0006PDSIt + ut
Adj-R2 = 0.45, NObs = 41, SER = 0.009, DW=1.65. bold denotes significance at the 10% msl, using HAC robust standard errors.
Note that the drought index coefficient is not statistically significant. I’m sure with enough work, I could get it to be statistically signficant in some specification. In any case, it doesn’t pop out easily.
Actually, this is the second time that Ironman has raised the drought excuse. I responded in an addendum to this post. In that case, Kansas was underperforming, even after taking into account the drought. Ironman never responded to that result.
This is not a defense of using the Philadelphia Fed coincident indices in all cases; this 2013 FRB Philadelphia document details the fact that the indices do not track certain states’ GDPs (particularly commodity dependent ones). Kansas actually has a fairly high correlation, at 0.55-0.70.
So much for today’s specious statistical critique debunking. See also this post for a previous installment.


Menzie David Chinn's Blog


