
Revised Coincident Indices for the Midwest: Wisconsin at the Back of the Pack!
Again.
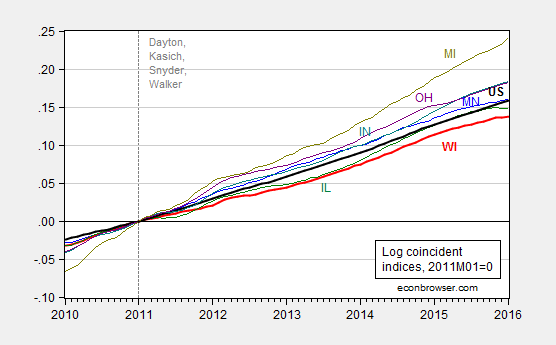
Figure 1: Log coincident indices for Minnesota (blue), Wisconsin (red), Illinois (green), Indiana (teal), Ohio (purple), Michigan (chartreuse), US (black), all normalized 2011M01=0. Source: Philadelphia Fed, January 2016 release.
(The set of states is defined as SBA Region V, used in this critique in Political Calculations. See also this post.)
The cumulative gap between Minnesota and Wisconsin as of December 2015 has widened from 2% to 2.2%, going from the December 2015 to January 2016 vintage.
Note that Wisconsin continues to lag in performance relative to what correlations with the Nation would indicate. I estimate the long run relationship between Wisconsin and US economic activity from 1990M03 to 2009M06, and use that estimated model to dynamically simulate Wisconsin’s predicted level of activity (shown as the purple line in Figure 2 below).
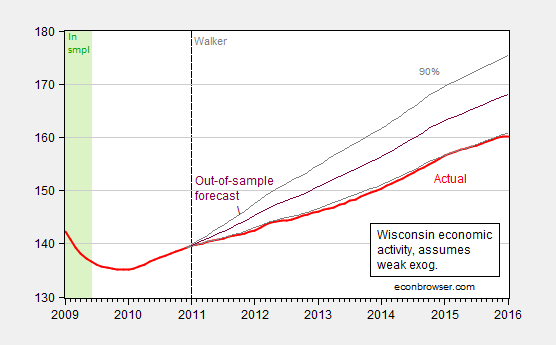
Figure 2: Wisconsin coincident index (red), forecast from ECM (black), and 90% confidence band (gray). Green shaded area denotes in-sample period. See this post for description of forecasting model; assumes weak exogeneity of US index. Source: Philadelphia Fed January 2016 release, and author’s calculations.


Menzie David Chinn's Blog


