
Not Quite: “…Wisconsin has left its former Democratic party-controlled (Midwest) peers behind”
One conservative meme is that Wisconsin’s apparently poor economic performance relative to other Midwest states is due to an inappropriate choice of reference dates; for instance, a year ago, Political Calculations made the assertion in the title, based on a July 2013 reference date. The logic?
…the tax policy of the previous Democratic party majorities in the state would remain untouched until at least July 2013, when the state’s next biennial budget would go into effect.
As events transpired, thanks to Scott Walker’s victory in the June 2012 gubernatorial recall election and the widening of Republican party control of the state’s elective institutions in subsequent elections, July 2013 marks when the state more fully adopted the Republican party’s preferred suite of economic policies.
Even using this (to me odd) criterion, it would be hard to say Wisconsin has been doing particularly well.
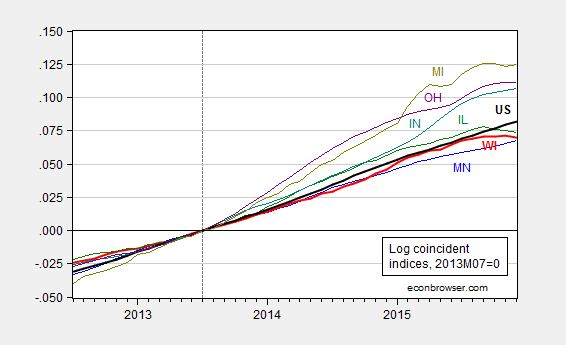
Figure 1: Log coincident index for Minnesota (blue), Wisconsin (red), Illinois (green), Indiana (teal), Michigan (teal), Ohio (chartreuse) and US (black), all normalized to 2013M07=0. Source: Philadelphia Fed and author’s calculations.
Wisconsin is a regional laggard (and as I have documented elsewhere, seems poised to lag further behind, based upon Philly Fed leading indices).
However, July 2013 is only an appropriate reference point if one takes Republican policies in Wisconsin as only having an effect starting in mid-2013. Those of us who lived in the state at the time recall the passage of many provisions [1] [2] [3] that led to a contraction of the economy and a heightening of policy uncertainty: the “budget repair bill” (which strangely enough was not viewed as necessary in the last budget cycle despite similarly tight fiscal conditions — chalk that up to “rosy scenario”), and the passage of Act 10. I think that it remains most appropriate to use a January 2011 reference date. Then, Wisconsin’s truly pathetic macro performance is made manifest.
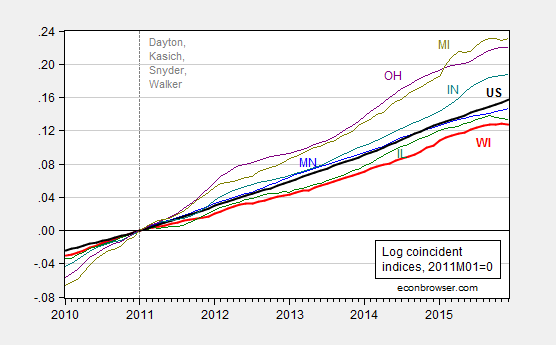
Figure 2: Log coincident index for Minnesota (blue), Wisconsin (red), Illinois (green), Indiana (teal), Michigan (teal), Ohio (chartreuse) and US (black), all normalized to 2013M07=0. Source: Philadelphia Fed and author’s calculations.
Of course, the appropriate comparison is to see whether Wisconsin is doing worse than what it should, based upon other observable factors (besides let’s say economic policies pursued in the state). And here, as shown in Figure 3, it is pretty clear that Wisconsin has been doing poorly, with statistical signficance, relative to a plausible counterfactual (see this post for an explanation of the ex post historical simulation, using US economic activity as an observable, and an error correction model specification):
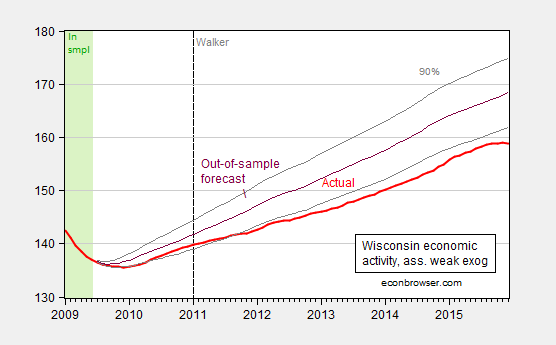
Figure 3: Wisconsin coincident index (bold red), and dynamic out-of-sample forecast (purple), and 90% band (gray lines). Green denotes in-sample period. Assumes US economic activity is weakly exogenous with respect to Wisconsin. Source: Philadelphia Fed, NBER, author’s calculations.
I am confident that some will continue to try to show that Wisconsin’s performance is, reported data notwithstanding, really, really, really good. Is that mendacity or merely incompetence? I let readers decide.
PS: Does anybody know when Department of Revenue will release the next triannual/quarterly Wisconsin Economic Outlook? The last one was released in May 2015.


Menzie David Chinn's Blog


