
Far Left-Far Right Protectionist Dreams
As noted in this post, both Senator Sanders and Mr. Trump share a belief that China should be declared a currency manipulator, so that heavy tariffs can be imposed (Secretary Clinton’s position here). Not that it matters to either individuals’ beliefs, but — based on ongoing research I am conducting with Yin-Wong Cheung (CUHK) and Xin Nong (UW) — the evidence that China is currently manipulating its currency to keep it undervalued is not particularly persuasive.
As I’ve discussed in several previous posts [1] [2] [3], there are various means of assessing currency misalignment, corresponding to different theoretical concepts.
One key approach — central to earlier assertions of massive undervaluation — is to use the Penn effect. The Penn effect is the observation that price levels are higher in higher income countries than in lower income countries. This phenomenon is shown in Figure 1 (regression line and 1 and 2 standard error bands).
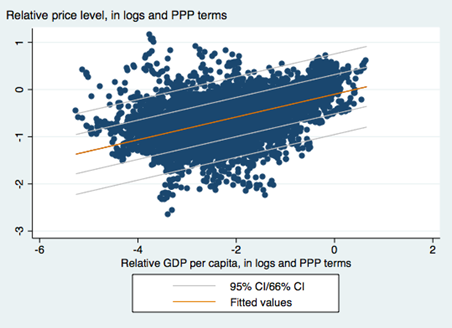
Figure 1: Scatterplot of price level against per capita income in PPP terms for full sample, 1970-2011, from Penn World Tables 8.1. OLS regression line (orange), +/- 1,2 standard error bands. Source: Cheung, Chinn, and Nong.
The elasticity of price level with respect to per capita income in PPP terms is 0.242.
One can use the relationship for non-advanced economies to infer the equilibrium price level for China. This is shown in Figure 2, along with the path China has followed (in red). The last observation in 2011.
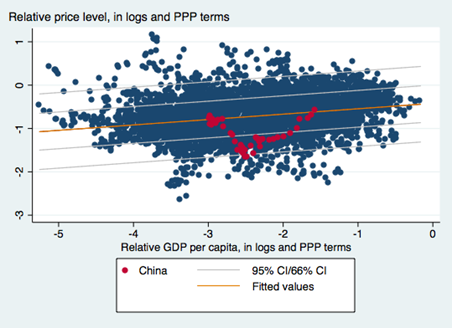
Figure 2: Scatterplot of price level against per capita income in PPP terms for non-advanced country sample, 1970-2011, from Penn World Tables 8.1. OLS regression line (orange), +/- 1,2 standard error bands. China observations in red. Source: Cheung, Chinn, and Nong.
The estimated regression equation is:
pi,t = -0.421 + 0.124yi,t + ui,t
bold figures denote statistically significant coefficients at 5% MSL. Adj.-R2 = 0.062, NObs = 4934, Sample 1970-2011.
Where p is the log price level relative to the US, and y is the per capita income relative to the US level, in logs.
As one can see, the estimated degree of misalignment is 2.81% in 2011.
Obviously, it’s not undervalued in 2011. (There is some degree of imprecision in these estimates; however, using the World Bank’s World Development Indicators data set, and a similar specification, yields estimates of substantial overvaluation, so my guess is undervaluation in 2011 is a tough case to make.) Moreover, in the succeeding years, the yuan has appreciated on a real, trade weighted basis, nearly 25% (in log terms).
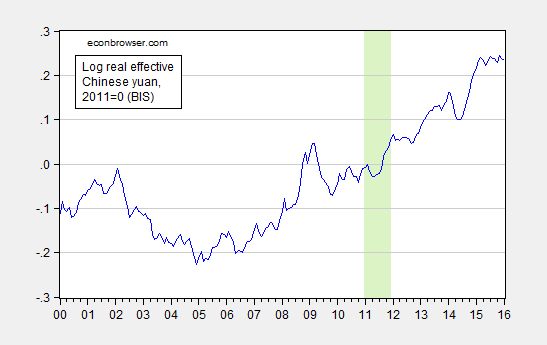
Figure 3: Log real trade weighted Chinese yuan, broad index, 2011=0. Green shading pertains to 2011. Source: Bank for International Settlements, author’s calculations.
The above series is CPI deflated. The degree of appreciation would be decreased if using a PPI to deflate.
Nonetheless, given these data (combined with the fact that Chinese fx reserves have been trending downward), it is not clear that Mr. Trump’s assertion:
Economists estimate the Chinese yuan is undervalued by anywhere from 15% to 40%. This grossly undervalued yuan gives Chinese exporters a huge advantage while imposing the equivalent of a heavy tariff on U.S. exports to China. Such currency manipulation, in concert with China’s other unfair practices, has resulted in chronic U.S. trade deficits, a severe weakening of the U.S. manufacturing base and the loss of tens of millions of American jobs.
Hence, the promise to “On day one of the Trump administration the U.S. Treasury Department will designate China as a currency manipulator”, thence validating imposition of tariffs on China, would require ignoring data (and installing instantaneously a very pliant SecTreas, I’d guess getting confirmation of the new SecTreas before being sworn in himself). (For detailed discussion of the challenges even if there were a lot of measured CNY undervaluation, see this CRS report).


Menzie David Chinn's Blog


