
Paul Gilster's Blog, page 5
April 15, 2025
New Explanations for the Enigmatic Wow! Signal

The Wow! signal, a one-off detection at the Ohio State ‘Big Ear’ observatory in 1977, continues to perplex those scientists who refuse to stop investigating it. If the signal were terrestrial in origin, we have to explain how it appeared at 1.42 GHz, while the band from 1.4 to 1.427 GHz is protected internationally – no emissions allowed. Aircraft can be ruled out because they would not remain static in the sky; moreover, the Ohio State observatory had excellent RFI rejection. Jim Benford today discusses an idea he put forward several years ago, that the Wow signal could have originated in power beaming, which would necessarily sweep past us as it moved across the sky and never reappear. And a new candidate has emerged, as Jim explains, involving an entirely natural process. Are we ever going to be able to figure this signal out? Read on for the possibilities. A familiar figure in these pages, Jim is a highly regarded plasma physicist and CEO of Microwave Sciences, as well as being the author of High Power Microwaves, widely considered the gold standard in its field.
by James Benford

The 1977 Wow! signal had the potential of being the first signal from extraterrestrial intelligence. But searches for recurrence of the signal heard nothing. Interest continues, as two lines of thought continue to ponder it.
An Astronomical Maser
A recent paper proposes that the Wow! signal could be the first recorded event of an astronomical maser flare in the hydrogen line [1]. (A maser is a laser-like coherent emission at microwave frequencies. The maser was the precursor to the laser.) The Wow frequency was at the hyperfine transition line of neutral hydrogen, about 1.4 GHz. The suggestion is that the Wow was a sudden brightening from stimulated emission of the hydrogen line in interstellar gas driven by a transient radiation source behind a hydrogen cloud. The group is now going through archival data searching for other examples of abrupt brightening of the hydrogen line.
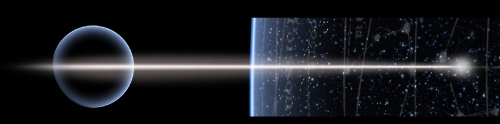
Maser Wow concept: A transient radiative source behind a cold neutral hydrogen (HI) cloud produced population inversion in the cloud near the hydrogen line, emitting a narrowband burst toward Earth [1].

Image courtesy of Abel Mendez (Planetary Habitability Laboratory, University of Puerto Rico at Arecibo).
Could aliens use the hydrogen clouds as beacons, triggered by their advanced technology? Abel Mendez has pointed out that this was suggested by Bob Dixon in a student’s thesis in 1976 [2]! From that thesis [3]:
“If it is a beacon built by astroengineering, such as an extraterrestrial civilization that is controlling the emission of a natural hydrogen cloud and using it as a beacon, then the only way that it could be ascertained as such, is by some time variation. And we are not set up to study time variation.”
How could such a beacon be built? It would require producing a population inversion in a substantial volume of ionized hydrogen. That might perhaps be done by an array of thermonuclear explosives optimized to produce a narrowband emission into such a volume [4]. Exploded simultaneously, they could produce that inversion, creating the pulse seen on Earth as the Wow.
Why does the Wow! Signal have narrow bandwidth?
In 2021, I published a suggestion that the enigmatic Wow Signal, detected in 1977, might credibly have been leakage from an interstellar power beam, perhaps from launch of an interstellar probe [5]. I used this leakage to explain the observed features of the Wow Signal: the power density received, the Signal’s duration and frequency. The power beaming explanation for the Wow accounted for all four of the Wow parameters, including the fact that the Wow observation has not recurred.
At the 2023 annual Breakthrough Discuss meeting, Mike Garrett of Jodrell Bank inquired “I was thinking about the Wow signal and your suggestion that it might be power beam leakage. But it’s not obvious to me why any technical civilization would limit their power beam to a narrow band of <= 10 kHz. Is there some kind of technical advantage to doing that or some kind of technical limitation that would produce such a narrow-band response?”After thinking about it, I have concluded that there is ‘some kind of technical advantage’ to narrow bandwidth. In fact, it is required for high-power beaming systems.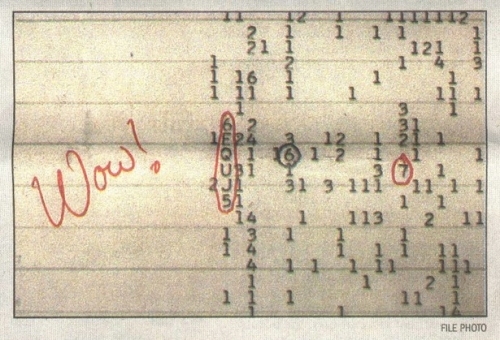
Image: The Wow Signal was detected by Jerry Ehman at the Ohio State University Radio Observatory (known as the Big Ear). The signal, strong enough to elicit Ehman’s inscribed comment on the printout, was never repeated.
A Beamer Made of Amplifiers?
High power systems involving multiple sources are usually built using amplifiers not oscillators, for several technical reasons. For example, the Breakthrough Starshot system concept has multiple laser amplifiers driven by a master oscillator, a so-called master oscillator-power amplifier (MOPA) configuration. Amplifiers are themselves characterized by the product of amplifier gain (power out divided by power in) and bandwidth, which is fixed for a given type of device, their ‘gain-bandwidth product’. This product is due to phase and frequency desynchronization between the beam and electromagnetic field outside the frequency bandwidth [6].
Therefore, for wide bandwidth, a lower power per amplifier follows. That means many more amplifiers. Likewise, to go to high power, each amplifier will have a small bandwidth. (Then the number of amplifiers is determined by the power required.) For power beaming applications, to get high power on target is essential: higher power is required, so smaller bandwidth follows.
So why do you get narrow bandwidth? You use very high gain amplifiers to essentially “eat up” the gain-bandwidth product. For example, in a klystron, you have multiple high-Q cavities that result in high gain. The high-gain SLAC-type klystrons had gains of about 100,000. Bandwidths for high power amplifiers on Earth are about one percent of one percent, 0.0001, 10-4. The Wow! bandwidth is 10 kHz/1.41 GHz, about 10-5.
So yes, the physics of amplifiers limits bandwidth in beacons and power beams because both would be built to provide very high power. So, with very high gain in the amplifiers, small bandwidth is the result.
This fact about amplifiers is another reason I think power beaming leakage is the explanation for the Wow. Earth could have accidentally received the beam leakage. Since stars constantly move relative to each other, later launches using the Wow! beam will not be seen from Earth.
Therefore I predicted that each failed additional search for the Wow! to repeat is more evidence for this explanation.
The Wow search goes on
These two very different explanations for the origin of the Wow! have differing future possibilities. I predicted that it wouldn’t be seen again. Each failed additional search for the Wow! to repeat (and there have been many) is more evidence for this explanation. Mendez and coworkers are looking to see if their process has occurred previously. They can prove their explanation by finding such occurrences in existing data. These are two very different possibilities. Only the Mendez concept can be realized soon.
References
1. Abel Mendez,1 Kevin Ortiz, Ceballos, and Jorge I. Zuluaga, “Arecibo Wow! I: An Astrophysical Explanation for the Wow! Signal,” arXiv:2408.08513v2 [astro-ph.HE], 2024.
2. Abel Mendez, private communication.
3. Cole, D. M. (1976). “A Search for Extraterrestrial Radio Beacons at the Hydrogen Line,” Doctoral dissertation, Ohio State University, 1976.
4. Taylor, T., 1986, “Third generation nuclear weapons,” Sci. Am., 256, 4, 1986.
5. James Benford “Was the Wow Signal Due to Power Beaming Leakage?”, JBIS 74 196-200, 2021.
6. James Benford, Edl Schamiloglu, John A. Swegle, Jacob Stephens and Peng Zhang, Ch. 12 in High Power Microwaves, Fourth Edition, Taylor and Francis, Boca Raton, FL, 2024.


April 11, 2025
Into Titan’s Ocean

When it comes to oceans beneath the surface of icy moons, Europa is the usual suspect. Indeed, Europa Clipper should have much to say about the moon’s inner ocean when it arrives in 2030. But Titan, often examined for the possibility of unusual astrobiology, has an internal ocean too, beneath tens of kilometers of ice crust. The ice protects the mix of water and ammonia thought to be below, but may prove to be an impenetrable barrier for organic materials from the surface that might enrich it.
I’ve recently written about abused terms in astrobiological jargon, and in regards to Titan, the term is ‘Earth-like,’ which trips me every time I run into it. True, this is a place where there is a substance (methane) that can appear in solid, liquid or gaseous form, and so we have rivers and lakes – even clouds – that are reminiscent of our planet. But on Earth the cycle is hydrological, while Titan’s methane mixing with ethane blows up the ‘Earth-like’ description. For methane to play this role, we need surface temperatures averaging −179 °C. Titan is a truly alien place.
In Titan we have both an internal ocean world and a cloudy moon with an atmosphere thick enough to keep day/night variations to less than 2 ℃ (although the 16 Earth day long ‘day’ also stabilizes things). It’s a fascinating mix. We’ve only just begun to probe the prospects of life inside this world, a prospect driven home by new work just published in the Planetary Science Journal. Its analysis of Titan’s ocean as a possible home to biology doesn’t come up completely short, but it offers little hope that anything more than scattered microbes might exist within it.

Image: This composite image shows an infrared view of Titan from NASA’s Cassini spacecraft, acquired during a high-altitude fly-by, 10,000 kilometers above the moon, on Nov. 13, 2015. The view features the parallel, dark, dune-filled regions named Fensal (to the north) and Aztlan (to the south). Credit: NASA/JPL/University of Arizona/University of Idaho.
The international team led by Antonin Affholder (University of Arizona) and Peter Higgins (Harvard University) looks at what makes Titan unique among icy moons, the high concentration of organic material. The idea here is to use bioenergetic modeling to look at Titan’s ocean. Perhaps as deep as 480 kilometers, the ocean can be modeled in terms of available chemicals and ambient conditions, factoring in energy sources (likely from chemical reactions) that could allow life to emerge. Ultimately, the models rely on what we know of the metabolism of Earth organisms, which is where we have to start.
It turns out that abundant organics – complex carbon-based molecules – may not be enough. Here’s Affholder on the matter:
“There has been this sense that because Titan has such abundant organics, there is no shortage of food sources that could sustain life. We point out that not all of these organic molecules may constitute food sources, the ocean is really big, and there’s limited exchange between the ocean and the surface, where all those organics are, so we argue for a more nuanced approach.”
Nuance is good, and one way to explore its particulars is through fermentation. The process, which demands organic molecules but does not require an oxidant, is at the core of the paper. Fermentation converts organic compounds into the energy needed to sustain life, and would seem to be suited for an anaerobic environment like Titan’s. With abiotic organic molecules abundant in Titan’s atmosphere and accumulating at the surface, a biosphere that can feed off this material in the ocean seems feasible. Glycine, the simplest of all known amino acids and an abundant constituent of matter in the early Solar System, serves as a useful proxy, as it is widely found in asteroids and comets and could sink through the icy shell, perhaps as a result of meteorite impacts.
The problem is that this supply source is likely meager. From the paper:
Sustained habitability… requires an ongoing delivery mechanism of organics to Titan’s ocean, through impacts transferring organic material from Titan’s surface or ongoing water–rock interactions from Titan’s core. The surface-to-ocean delivery rate of organics is likely too small to support a globally dense glycine-fermenting biosphere (<1 cell per kg water over the entire ocean). Thus, the prospects of detecting a biosphere at Titan would be limited if this hypothetical biosphere was based on glycine fermentation alone.

Image: This artist’s concept of a lake at the north pole of Saturn’s moon Titan illustrates raised rims and rampart-like features as seen by NASA’s Cassini spacecraft. Credit: NASA/JPL-Caltech.
More biomass may be available in local concentrations, perhaps at the interface of ocean and ice, and the authors acknowledge that other forms of metabolism may add to what glycine fermentation can produce. Thus what we have is a study using glycine as a ‘first-order approach’ to studying the habitability of Titan’s ocean, one which should be followed up by considering other fermentable molecules likely to be in the ocean and working out how they might be delivered and in what quantity. We still wind up with only approximate biomass estimates, but the early numbers are low.
The paper is Affholder et al., “The Viability of Glycine Fermentation in Titan’s Subsurface Ocean,” Planetary Science Journal Vol. 6, No. 4 (7 April 2025), 86 (full text).
April 8, 2025
On ‘Sun-like’ Stars

The thought of a planet orbiting a Sun-like star began to obsess me as a boy, when I realized how different all the planets in our Solar System were from each other. Clearly there were no civilizations on any planet but our own, at least around the Sun. But if Alpha Centauri had planets, then maybe one of them was more or less where Earth was in relation to its star. Meaning a benign climate, liquid water, and who knew, a flourishing culture of intelligent beings. So ran my thinking as a teenager, but then other questions began to arise.
Was Alpha Centauri Sun-like? Therein hangs a tale. As I began to read astronomy texts and realized how complicated the system was, the picture changed. Two stars and perhaps three, depending on how you viewed Proxima, were on offer here. ‘Sun-like’ seemed to imply a single star with stable orbits around it, but surely two stars as close as Centauri A and B would disrupt any worlds trying to form there. Later we would learn that stable orbits are indeed possible around both of these stars, and in the habitable zone, too (I still get emails from people saying no such orbits are possible, but they’re wrong).
So just how broad is the term ‘Sun-like’? One textbook told me that Centauri A was a Sun-like star, while Centauri B was sometimes described that way, and sometimes not. I thought the confusion would dissipate once I knew enough about astronomical terms, but if you look at scientific papers today, you’ll see that the term is still flexible. The problem is that by the time we move from a paper into the popular press, the term Sun-like begins to lose definition.

Image:A direct image of a planetary system around a young K-class star, located about 300 light-years away and known as TYC 8998-760-1. The news release describes this as a Sun-like star, raising questions as to how we define the term. Image credit: ESO.
G-class stars are the category into which the Sun fits, with its lifetime on the order of 10 billion years, and if we expand its parameters a bit, we can take in stars around the Sun’s mass – perhaps 0.8 to 1.1 solar masses – and in the same temperature range – 5300 to 6000 K. Strictly speaking, then, Centauri B, which is a K-class star, doesn’t fit the definition of Sun-like, although K stars seem to be good options for habitable worlds. They’re less massive (0.45 to 0.8 solar masses) and cooler (3900 to 5300 K), and they’re more orange than yellow, and they’re longer lived than the Sun, a propitious thought in terms of astrobiology.
So we don’t want to be too doctrinaire in discussing what kind of star a habitable planet might orbit, but we do need to mind our definitions, because I see the term ‘Sun-like’ in so many different contexts. When I see a statement like “one Earth-class planet around every Sun-like star,” I have to ask whether we’re talking about G-class stars or something else. Because some scientists expand ‘Sun-like’ to include not only G- and K- but F-class stars as well. Why do this? Such stars are, like the Sun, long-lived. F stars are hotter and more massive than the Sun, but like G- and K-class stars, they’re stable. Some studies, then, consider ‘Sun-like’ to mean all FGK-type stars.
Some examples. ‘COROT finds exoplanet orbiting Sun-like star’ is the title of a news release that describes a star a bit more massive than the Sun. So the comparison is to G-class stars. ‘Astronomy researchers discover new planet around a ‘Sun-like’ star’ describes a planet around an F-class star, so we are in the FGK realm. ‘First Ever Image of a Multi-Planet System around a Sun-like Star Captured by ESO Telescope’ describes a planet around TYC 8998-760-1, a K-class dwarf.
So there’s method here, but it’s not always clarified as information moves from the academy (and the observatory) into the media. Confounding the picture still further are those papers that use ‘Sun-like’ to mean all stars on the Main Sequence. This takes in the entire range of stars OBAFGKM. This is a rare usage, but there is a certain logic here as well. If you’re looking for habitable planets, it’s clear that stars in the most stable phase of their lives are the ones to examine, burning hydrogen to produce energy. No brown dwarfs here, but the category does take in M-class stars, and the jury is out on whether such stars can support life. And they take in the huge majority of stars in the galaxy.
So if we’re talking about hydrogen burning, the Main Sequence offers up everything from hot blue stars all the way down to cool red dwarfs. End the hydrogen burning and a different phase of stellar evolution begins, producing for example the kind of white dwarf that the Sun will one day become. A paper’s context usually makes it perfectly clear which of the three takes on ‘Sun-like’ it is using, but the need to clarify the term in news releases, particularly when dealing with a wide range through F-, G- and K-class stars is evident.
All of this matters to the popular perception of what exoplanet researchers do because it wildly affects the numbers. G-class stars are thought to comprise about 7 percent of the stars in the galaxy, while K-class stars take in about 12 percent, and M-class dwarfs as high as 80 percent of the stellar population. Saying there is an Earth-class planet around every Sun-like star thus could mean ‘around 7 percent of the stars in the Milky Way.’ Or it could mean ‘around 22 percent of the stars in the Milky Way, if we mean FGK host stars.
If we included red dwarf stars, it could mean ‘around about 95 percent of the stars in the galaxy,’ excluding evolved, non-Main Sequence objects like white dwarfs, neutron stars and red giants. Everything depends upon how the terms are defined. I keep getting emails about this. My colleague Andrew Le Page is a stickler for terminology in the same way I am, with his most trenchant comments being reserved for too facile use of the term ‘habitable.’
So we’ve got to be careful in this burgeoning field. Exoplanet researchers are aware of the need to establish the meaning of ‘Sun-like’ carefully. The fact that the public’s interest in exoplanets is growing means, however, that in public utterances like news releases, scientists need to clarify what they’re talking about. It’s the same thing that makes the term ‘Earth-like’ so ambiguous. A planet as massive as the Earth? A planet that is rocky as opposed to gaseous? A planet in the habitable zone of its star? Is a planet on a wildly elliptical orbit crossing in and out of the habitable zone of an F-class host Earth-like?
Let’s watch our terms so we don’t confuse everybody who is not in the business of studying exoplanets full-time. The interface between professional journals and public venues like websites and newspapers is important because it can have effects on funding, which in today’s climate is a highly charged issue. A confused public is less likely to support studies in areas it does not understand.
April 4, 2025
Protoplanetary Disks Are Smaller Than Expected

In astronomy, the first thing you see may be the least typical. A case in point: ‘Hot Jupiters.’ A few prescient souls, among them Buzz Aldrin and John Barnes in their novel Encounter with Tiber, speculated about gas giants that survived incredibly tight orbits around their star, and when asked about this in the 1990s, Greg Matloff ran the numbers and confirmed to his surprise that there was a theoretical case for their existence. Let me quote Matloff on this:
Although I was initially very skeptical since then-standard models of solar system formation seemed to rule out such a possibility, I searched through the literature and located the appropriate equation (Jastrow and Rasool, 1965)….To my amazement, Buzz was correct. The planet’s atmosphere is stable for billions of years. Since I was at the time working as a consultant and adjunct professor, I did not challenge the existing physical paradigm by submitting my results to a mainstream journal. Since “Hot Jupiters” were discovered shortly before the novel was published, I am now credited with predicting the existence of such worlds.
51 Pegasi b made the case for ‘hot Jupiters’ convincingly in 1995, and we also know that the reason we began finding these planets was that our best methods for detecting exoplanets in the mid-1990s involved radial velocity and transit measurements, both of which are most effective when dealing with large planets in close orbits. As best I can determine, current estimates find a scant ~0.5–1% of these planets around F-, G-, or K-class stars. The rarity of hot Jupiters like TOI-4201b underlines how rare these objects are around M-dwarfs.
Observational bias can be a tricky thing. So is something of the same phenomenon occurring in our study of how planets form? Protoplanetary disks are extensively studied, some of them showing what appear to be planets in their early stages of formation. As I’ve read studies about disks like those at TW Hydrae and HL Tauri, I’ve always assumed that they were massive. In some cases they extend far beyond our Solar System’s outer reaches. But now we have a new study making a strong case that disks like these are not typical.
The work in question involved data from ALMA, the Atacama Large Millimeter/submillimeter Array. It comprises data from observations from 2023 and 2024 at resolutions of 0.030 arcsecond, along with somewhat higher resolution archival data to produce a high resolution survey of an entire star-forming region. The imaging takes in all known protoplanetary disks around young stars in the Lupus star forming region, some 400 light years from Earth.
The results indicate how much we have to learn about protoplanetary disks. The smallest disk comes to only 0.6 astronomical units in radius, which means it is smaller than the Earth’s orbit. The researchers also learned that the kind of features that point to planets in formation do not occur in smaller disks. Thus lead author Osmar M. Guerra-Alvarado (Leiden University, The Netherlands):
“These results completely change our view of what a ‘typical’ protoplanetary disc looks like. Only the brightest discs which are the easiest to observe show large-scale gaps, whereas compact discs without such substructures are actually much more common.”

Image: Images of 73 protoplanetary discs in the Lupus star forming region (two of the images contain binary stars). Only a fraction of the discs extend beyond the orbit of Neptune, when compared to our own Solar System. Most of the observed discs are small and show no structures like gaps and rings. (c) Guerra-Alvarado et al.
Adds Leiden colleague Nienke van der Marel:
“The discovery that the majority of the small discs do not show gaps, implies that the majority of stars do not host giant planets. This is consistent with what we see in exoplanet populations around full-grown stars. These observations link the disc population directly to the exoplanet population.”
The smaller protoplanetary disks are found around stars massing between 10 and 50 percent of the mass of the Sun. While disks like these do not appear optimum for the formation of gas giants, they may be fertile breeding ground for super-Earths, with most of the dust located close to the host star. Given this context, our own Solar System may have been formed from a more massive protoplanetary disk large enough to produce a Jupiter and a Saturn.

Image: This is an artist’s impression of a young star surrounded by a protoplanetary disc in which planets are forming. Using ALMA’s 15-kilometre baseline astronomers were able to make the first detailed image of a protoplanetary disc, which revealed the complex structure of the disc. Concentric rings of gas, with gaps indicating planet formation, are visible in this artist’s impression and were predicted by computer simulations. Now these structures have been observed by ALMA for the first time. Note that the planets are not shown to scale. Credit: ESO/L. Calçada.
From the paper:
The fact that we observe numerous compact disks in the Lupus region, both with and without substructures, aligns with the scenario from van der Marel & Mulders (2021), in which such disks, undergoing significant radial drift, can supply enough dust material to form multiple super-Earths (Sanchez et al. 2024). This offers a potential explanation for the origin of the exoplanet populations observed around M-stars to this day. In addition, the fact that we are still observing these disks may require something to halt dust drift and trapping particles. Instead of forming a single Jupiter or Saturn-mass planet, several super-Earths or smaller planets may be forming in the inner regions of these disks, collectively stopping the drift (Huang et al. 2024b).
So we have to look at the question of observation bias once again. As with hot Jupiters, our best methods continue to improve, and as they do, we gradually form a broader picture of the phenomena being studied. In the case of the latest ALMA work, we are delving into higher-resolution measurements that can begin to tease out information about small disks that have previously been studied only in terms of brightness as opposed to size. A ‘typical’ disk turns out to be something other than the large, bright disks first revealed by ALMA.
The paper is Guerra-Alvarado et al., “A high-resolution survey of protoplanetary discs in Lupus and the nature of compact discs,” Accepted for publication in Astronomy & Astrophyiscs (preprint).
April 1, 2025
A Multiwavelength Look at Proxima Centauri’s Flares

The problem of flares in red dwarf planetary systems is stark. With their habitable zones relatively near to the star, planets that might support life are exposed to huge outbursts of particles and radiation that can strip their atmospheres. We can see that in nearby M-dwarfs like Proxima Centauri, which is extremely active not only in visible light but also in radio and millimeter wavelengths. New work at the Atacama Large Millimeter/submillimeter Array (ALMA) digs into the millimeter-wavelength activity. The results do nothing to ease the concern that systems like this may be barren of life.
Small M-dwarf stars are a problem because they operate through convection as energy from fusion at the core is transferred to the surface. A convective structure is one in which hot material from below moves constantly upward, a process that can be likened to what we see in a boiling cauldron of water. Larger stars like the Sun show a mix of radiative transfer – protons being absorbed and reabsorbed as they make their way to the surface – and convection. That enhances M-dwarf flare activity as their plasma is twisted and rotated, producing magnetic fields that snap open only to reconnect. Powerful flares and outbursts of particles are the result.
For a world in an otherwise habitable region around the star, that spells danger. Meredith MacGregor (Johns Hopkins University), who worked with Kiana Burton on the flaring at Proxima Centauri, explains:
“Our Sun’s activity doesn’t remove Earth’s atmosphere and instead causes beautiful auroras, because we have a thick atmosphere and a strong magnetic field to protect our planet. But Proxima Centauri’s flares are much more powerful, and we know it has rocky planets in the habitable zone. What are these flares doing to their atmospheres? Is there such a large flux of radiation and particles that the atmosphere is getting chemically modified, or perhaps completely eroded?”

Image: Artist’s concept of a stellar flare from Proxima Centauri. Credit: NSF/AUI/NSF NRAO/S. Dagnello.
MacGregor and Burton have been working on what they describe as the first multi-wavelength study using millimeter observations to probe into the physics of these flares. At their disposal are 50 hours of ALMA observations, covering some 463 flare events at energies between 1024 to 1027 erg. Most of these flares end quickly, ranging in duration from 3 to 16 seconds. The operative term in the study is flare frequency distribution (FFD), which maps the number of flares against energy levels. A power law function as at optical wavelengths would mean that lower-energy flares would be expected to occur more frequently than flares of higher energy, but the team found many flares within each energy range because of the high flare activity at Proxima.
Adds MacGregor:
“The millimeter flaring seems to be much more frequent–it’s a different power law than we see at the optical wavelengths. So if we only look in optical wavelengths, we’re missing critical information. ALMA is the only millimeter interferometer sensitive enough for these measurements.”
The point is significant, and I want to dig into the paper on this:
Proxima Cen has been observed frequently at optical wavelengths, with a much shallower FFD power-law index of 1.88 ± 0.06. This significant difference could indicate a disconnect between sources of optical and millimeter emission during flares. Since optical observations of stellar flares are more readily available and often used to infer the flaring flux at other wavelengths, this result underlines the need for further multiwavelength campaigns to constrain scaling relations. In particular, the higher rate of millimeter flares compared to optical flares and the tight correlation between FUV and millimeter emission observed by M. A. MacGregor et al. (2021) may suggest that the extreme-UV radiation environment of Proxima b due to small flares is also higher than predicted from the optical flare rate.
So the flare activity at Proxima Centauri is more complicated and perhaps more dangerous than we thought. As we learn more about flaring at this star, we have to hope that Proxima Centauri b has a strong magnetic field that can mitigate the effects of this incoming stream of energy and particles. The prospect of an atmosphere being stripped of ozone and water, for example, makes modification or erosion of its gases a strong possibility. Instruments like the Square Kilometer Array may one day be capable of detecting the interactions between such a magnetic field and the star’s stellar wind. But for now, we can only wait for further data.
The paper is Burton et al., “The Proxima Centauri Campaign — First Constraints On Millimeter Flare Rates from ALMA,” Astrophysical Journal Vol 982, Number 1 (17 March 2025), 43. Preprint / Abstract.
March 28, 2025
Can an Interstellar Generation Ship Maintain a Population on a 250-year Trip to a Habitable Exoplanet?

I grew up on generation ship stories. I’m thinking of tales like Heinlein’s Orphans of the Sky, Aldiss’ Non-Stop, and (from my collection of old science fiction magazines) Don Wilcox’s “The Voyage that Lasted 600 Years.” The latter, from 1940, may have been the first generation ship story ever written. The idea grows out of the realization that travel to the stars may take centuries, even millennia, and that one way to envision it is to take large crews who live out their lives on the journey, their descendants becoming the ones who will walk on a new world. The problems are immense, and as Alex Tolley reminds us in today’s essay, we may not be fully considering some of the most obvious issues, especially closed life support systems. Project Hyperion is a game attempt to design a generation ship, zestfully tangling with the issues involved. The Initiative for Interstellar Studies is pushing the limits with this one. Read on.
by Alex Tolley
“Space,” it says, “is big. Really big. You just won’t believe how vastly, hugely, mindbogglingly big it is. I mean, you may think it’s a long way down the road to the chemist, but that’s just peanuts to space..” The Hitchhikers Guide to the Galaxy – Douglas Adams.

Detail of book cover of Tau Zero. Artist: Manchu.
Introduction
Science fiction stories, and most notably TV and movies, avoid the fact of the physical universe being so vast by various methods to reduce travel time. Hyperspace (e.g. Asimov’s galaxy novels), warp speed (Star Trek), and wormholes compress travel time to be like that on a planet in the modern era. Relativity will compress time for people at the cost of external time (e.g. Poul Anderson’s Tau Zero). But the energy cost of high-speed travel has a preferred slow-speed method – the space ark. Giancarlo Genta classifies this method of human crewed travel: H1 [1]. a space-ark type, where travel to the stars will take centuries. Either the crew will be preserved with cryosleep on the journey (e.g. Star Trek TOS S01E22, “Space Seed”) or generations will live and die in their ship (e.g. Aldiss Non-Stop) [2].
This last is now the focus of the Project Hyperion competition by the Initiative for Interstellar Studies (i4is) where teams are invited to design a generation ship within various constraints. This is similar to the Mars Society’s Design a City State competition for a self-supporting Mars city for 1 million people, with prizes awarded to the winners at the society’s conference.
Prior design work for an interstellar ship was carried out between 1973 and 1978, by the British Interplanetary Society (BIS). It was for an uncrewed probe to fly by Barnard’s star 5.9 lightyears distant within 50 years – their Project Daedalus.[3] Their more recent attempt at a redesign, the ironically named Project Icarus, failed to achieve a complete design, although there was progress on some technologies [4] Project Hyperion is far more ambitious based on the project constraints including human crews and a greater flight duration .[5].
So what are the constraints or boundary conditions for the competition design? Seven are given:
1. The mission duration is 250 years. In a generation ship that means about 10 generations. [Modern people can barely understand what it was like to live a quarter of a millennium ago, yet the ship must maintain an educated crew that will maintain the ship in working order over that time – AT].
2. The destination is a rocky planet that will have been prepared for colonization by an earlier [robotic? – AT] ship or directed panspermia. Conditions will not require any biological modifications of the crew.
3. The habitat section will provide 1g by rotation.
4. The atmosphere must be similar to Earth’s. [Presumably, gas ratios and partial pressures must be similar too. There does not appear to be any restriction on altitude, so presumably, the atmospheric pressure on the Tibetan plateau is acceptable. – AT]
5. The ship must provide radiation protection from galactic cosmic rays (GCR).
6. The ship must provide protection from impacts.
7. The crew or passengers will number 1000 +/- 500.
The entering team must have at least:
One architectural designerOne engineerOne social scientist (sociologist, anthropologist, etc.)Designing such a ship is not trivial, especially as unlike a Lunar or Martian city, there is no rescue possible for a lone interstellar vehicle traveling for a quarter of a millennium at a speed of at least 1.5% of lightspeed to Proxima, faster for more distant stars. If the internal life support system fails and cannot be repaired, it is curtains for the crew. As the requirements are that at least 500 people arrive to live on the destination planet, any fewer survivors, perhaps indulging in cannibalism (c.f. Neal Stephenson’s Seveneves), means this design would be a failure.

Figure 1. Technology Readiness Levels. Source NASA.
The design competition constraints allow for technologies at the technology readiness level of 2 (TRL 2) which is in the early R&D stage. In other words, the technologies are unproven and may not prove workable. Therefore the designers can flex their imaginations somewhat, from propulsion (onboard or external) to shielding (mass and/or magnetic), to the all-important life support system.
Obviously, the life support system is critical. After Gerry O’Neil designed his space colonies with interiors that looked rather like semi-rural places on Earth, it was apparent to some that if these environments were stable, like managed, miniature biospheres, then they could become generation ships with added propulsion. [6]. The Hyperion project’s 500-1500 people constraint is a scaled-down version of such a ship. But given that life support is so critical, why are the teams not required to have members with biological expertise in the design? Moreover, the design evaluators also have no such member. Why would that be?
Firstly, perhaps such an Environmental Control and. Life Support System (ECLSS) is not anticipated to be a biosphere:
The requirements matrix states:
ECLSS: The habitat shall provide environmental control and life support: How are essential physical needs of the population provided? Food, water, air, waste recycling. How far is closure ensured?
Ecosystem: The ecosystem in which humans are living shall be defined at different levels: animals, plants, microbiomes.
This implies that there is no requirement for a fully natural, self-regulating, stable, biosphere, but rather an engineered solution that mixes technology with biology. The image gallery on the Hyperion website [5] seems to suggest that the ECLSS will be more technological in nature, with plants as decorative elements like that of a business lobby or shopping mall, providing the anticipated need for reminders of Earth and possibly an agricultural facility.
Another possibility is that prior work is now considered sufficient to allow it to be grafted into the design. It seems the the problem of ECLSS for interstellar worldships is almost taken for granted despite the very great number of unsolved problems.
As Soilleux [7] states
“To date, most of the thinking about interstellar worldships has focused, not unreasonably, on the still unsolved problems of developing suitably large and powerful propulsion systems. In contrast, far less effort has been given to the equally essential life support systems which are often assumed to be relatively straightforward to construct. In reality, the seductive assumption that it is possible to build an artificial ecosystem capable of sustaining a significant population for generations is beset with formidable obstacles.”
It should be noted that no actual ECLSS has proven to work for any length of time even for interplanetary flight, let alone centuries for interstellar flight. Gerry O’Neill did not make much effort beyond handwaving for the stability of the more biospheric ECLSS of his 1970s-era space colony. Prior work from Bios 3, Biosphere II, MeLISSA, and other experiments, has demonstrated very short-term recycling and sustainability, geared more towards longer duration interplanetary spaceflight and bases. Multi-year biospheres inevitably lose material due to imperfect recycling and life support imbalances that must be corrected via venting. The well-known Biosphere II project couldn’t maintain a stable biosphere to support an 8-person crew for 2 years, accompanied by a 10% per year atmosphere loss.
On a paper design basis, the British Interplanetary Society (BIS) recently worked on a more detailed design for a post-O’Neill space colony called Avalon. It supported a living interior for 10,000 people, the same as the O’Neill Island One design, providing a 1g level and separate food growing, carbon fixing, and oxygen (O2) generating areas. However, the authors did not suggest it would be suitable for interstellar flight as it did require some inputs and technological support from Earth. Therefore it remains an idea, and as with the hardware experiments to date, such ECLSSs remain at low TRL values. While the BIS articles are behind paywalls, there is a very nice review of the project in the i4is Principium magazine [7].

Table 1. Inputs to support a person in Space. Source: Second International Workshop on Closed Ecological Systems, Krasnoyarsk, Siberia, 1989 [8]
Baseline data indicates that a person requires 2 metric tonnes [MT] of consumables per year, of which food comprises 0.2 MT and oxygen (O2) 0.3 MT. For 1000 people over 250 years that is 500,000 MT. To put this mass in context, it is about the greatest mass of cargo that can be carried by ships today. Hence recycling to both save mass and to manage potentially unlimited time periods makes sense. Only very short-duration trips away from Earth allow for the consumables to be brought along and discarded after use, like the Apollo missions to the Moon. Orbiting space stations are regularly resupplied with consumables, although the ISS is using water recycling to save on the resupply of these consumables for drinking, washing, and bathing.
If an ECLSS could manage 100% recycling, then if the annual amount is the buffer to allow for annual crop growth, the ship could support the crew over the time period with just over 2000 MT, but of course with the added requirement for power and infrastructure and replacement parts to maintain the ECLSS.

Figure 2. Conceptual ECLSS process flow diagram for the BIS Avalon project.
A review of the Avalon project’s ECLSS [7] stated:
“A fully closed ECLSS is probably impossible. At a minimum, hydrogen, oxygen, nitrogen, and carbon lost from airlocks must be replaced as well as any nutrients lost to the ecosystem as products (eg soil, wood, fibres, chemicals). This presents a resource-management challenge for any fully autonomous spacecraft and an economic challenge even if only partially autonomous…Recycling does not provide a primary source of fixed nitrogen for new plant growth and significant quantities are lost to the air as N2 because of uncontrollable denitrification processes. The total loss per day for Avalon has been estimated at 43 kg to be replaced from the atmosphere.”
[That last loss figure would translate to 390 MT for the 1/10 scaled crewed Hyperion starship over 250 years.]
Hempsell evaluated the ECLSS technologies for star flight based on the Avalon project and found them unsuited to a long-duration voyage [9]. It was noted that the Avalon design still required inputs from Earth to be maintained as it was not fully recycled:
“So effective is this transport link that it is unlikely Earth orbiting colonies will have any need for the self-sufficiency assumed by the original thinking by O’Neill. It is argued that a colony’s ability to operate without support is likely to be comparable to the transport infrastructure’s journey times, which is three to four months. This is three orders of magnitude less than the requirements for a world ship. It is therefore concluded that in many critical respects the gap between colonies and world ships is much larger than previous work assumed.”
We can argue whether this will be solved eventually, but clearly, any failure is lethal for the crew.
One issue is not mentioned, despite the journey duration. Over the quarter millennium voyage, there will be evolution as the organisms adapt to the ship’s environment. Data from the ISS has shown that bacteria may mutate into more virulent pathogens. A population living in close quarters will encourage pandemics. Ionizing radiation from the sun and secondaries from the hull of a structure damages cells including their DNA. 250 years of exposure to residual GCR and secondaries will damage DNA of all life on the starship.
However, even without this direct effect on DNA, the conditions will result in organisms evolving as they adapt to the conditions on the starship, especially the small populations, increasing genetic drift. This evolution, even of complex life, can be quite fast, as the continuing monitoring of the Galápagos island finches observed by Darwin attests. Of particular concern is the creation of pathogens that will impact both humans and the food supply.
In the 1970s, the concept of a microbiome in humans, animals, and some plants was unknown, although bacteria were part of nutrient cycling. Now we know much more about the need for humans to maintain a microbiome, as well as some food crops. This could become a source of pathogens. While a space habitat can just flush out the agricultural infrastructure and replace it, no such possibility exists for the starship. Crops would need to be kept in isolated compartments to prevent a disease outbreak from destroying all the crops in the ECLSS.
If all this wasn’t difficult enough, the competition asks that the target generation population find a ready-made terrestrial habitat/terraformed environment to slip into on arrival. This presumably was prebuilt by a robotic system that arrived ahead of the crewed starship to build the infrastructure and create the environment ready for the human crew. It is the Mars agricultural problem writ large [10], with no supervision from humans to correct mistakes. If robots could do this on an exoplanet, couldn’t they make terrestrial habitats throughout the solar system?
Heppenheimer assumed that generation ships based on O’Neill habitats would not colonize planets, but rather use the resources of distant stars to build more space habitats, the environment the populations had adapted to [6]. This would maintain the logic of the idea of space habitats being the best place for humanity as well as avoiding all the problems of trying to adapt to living on a living, alien planet. Rather than building space habitats in other star systems, the Hyperion Project relies on the older idea of settling planets, and ensuring at least part of the planet is habitable by the human crew on arrival. This requires some other means of constructing an inhabitable home, whether a limited surface city or terraforming the planet.
Perhaps the main reason why both the teams and evaluators have put more emphasis on the design of the starship as a human social environment is that little work has looked at the problems of maintaining a small population in an artificial environment over 250 years. SciFi novels of generation ships tend to be dystopias. The population fails to maintain its technical skills and falls back to a simpler, almost pretechnological, lifestyle. However, this cannot be allowed in a ship that is not fully self-repairing as hardware will fail. Apart from simple technologies, no Industrial Revolution technology that continues to work has operated without the repair of parts. Our largely solid-state space probes like the Voyagers, now over 45 years old and in interstellar space, would not work reliably for 250 years, even if their failing RTGs were replaced. Mechanical moving parts fail even faster.
While thinking about how we might manage to send crewed colony ships to the stars with the envisaged projections of technologies that may be developed, it seems to me that it is rather premature given the likely start date of such a mission. Our technology will be very different even within decades, obsoleting ideas used in the design. The crews may not be human 1.0, requiring very different resources for the journey. At best, the design ideas for the technology may be like Leonardo Da Vinci’s ideas for flying machines. Da Vinci could not conceive of the technologies we use to avoid moving our meat bodies through space just to communicate with others around the planet.
Why is the population constraint 1000 +/- 500?
Gerry O’Neill’s Island One space colony was designed for 10,000 people, a small town. The BIS Avalon was designed for the same number, using a different configuration that provided the full 1g with lower Coriolis forces. The Hyperion starship constrains the population to 1/10th that number. What is the reason? It is based on the paper by Smith [14] on the genetics and estimated safe population size for a 5-generation starship [125 years at 25 years per generation?]. This was calculated on the expected lower limit of a small population’s genetic diversity with current social structures, potential diseases, etc. This is well below the number generally considered for long-term viable animal populations. However, the calculated size of the genetic bottleneck in our human past is about that size, suggesting that in extremis such a small population can recover, just as we escaped extinction. Therefore it should be sufficient for a multi-generation interstellar journey.
From Hein[14]:
While the smallest figures may work biologically, they are rather precarious for some generations before the population has been allowed to grow. We therefore currently suggest figures with Earth-departing (D1) figures on the order of 1,000 persons.
But do we need this population size? Without resorting to a full seed ship approach with the attendant issues of machine carers raising “tank babies”, can we postulate an approach without assuming future TRL9 ECLSS technology?
As James T Kirk might say: “I changed the conditions of the test competition!”
Suppose we only need a single woman who will bear a child and then age until death, perhaps before 100. The population then would be a newborn baby, the 25-year-old mother, the 50-year-old grandmother, the 75-year-old great-grandmother, and the deceased great-great-grandmother. 3 adults and a newborn. At 20, the child will count as an adult, with a 45-year-old mother, a 70-year-old grandmother, and possibly a 95-year-old great-grandmother, 4 adults. Genetic diversity would be solved from a frozen egg, sperm, and embryo bank of perhaps millions of individual selected genomes. The mother would give birth only to preselected, compatible females using implantation (or only female sperm) to gain pregnancy, to maintain the line of women.
This can easily be done today with minimal genetic engineering and a cell-sorting machine [11]. At the destination, population renewal can begin. The youngest mature woman could bear 10 infants, each separated by 2 years. The fertile female population would rapidly increase 10-fold each generation, creating a million women in 6 generations, about 150 years. Each child would be selected randomly from the stored genetic bank of female sperm or embryos. At some point, males can be phased in to restore the 50:50 ratio. Because we are only supporting 4 women, almost all the recycling for food and air can be discarded, just recycling water. Water recycling for urine and sweat has reached 98% on the ISS, so we can assume that this can be extended to the total water consumption. Using a conservative 98% recycle rate for water (sanitary, drinking, and metabolic), O2 replenishment from water by electrolysis (off-the-shelf kit) and an 80% recycle rate of metabolic carbon dioxide (CO2) to O2 and methane (CH4 by a Sabatier process), implies that the total water storage needs only be 5x the annual consumption. The water would be part of the hull as described by McConnell’s “Spacecoach” concept.
Based on the data in Table 1 above, the total life support would be about 125 MT. The methane could be vented or stored for the lander propulsion fuel. For safety through redundancy, the total number of women population might be raised 10x to 30-40, requiring only 1250 MT total consumables. All this does not require any new ECLSS technology, just enough self-repair, repairable, and recyclable machinery, to maintain the ship’s integrity and functioning. The food would be stored both as frozen or freeze-dried, with the low ambient temperature maintained by radiators exposed to interstellar space. This low mass requires no special nutrient recycling, just water recycling at the efficiency of current technology, O2 recycling using existing technology, and sufficient technology support to ensure any repairs and medical requirements can be handled by the small crew.
Neal Stephenson must have had something like this in mind for the early period of saving and rebuilding the human population in his novel Seveneves when the surviving female population in space was reduced to 7. Having said this, such a low population size even with carefully managed genetic diversity through sperm/ar embryo banks, genetic failure over the 10 generation flight may still occur. Once the population has the resources to increase, the genetic issues may be overcome by the proposed approach.

Table 2. ETHNOPOP simulation showing years to demographic extinction for closed human populations. Bands of people survive longer with larger starting sizes, but these closed populations all eventually become extinct due to demographic (age & sex structure) deficiencies. Source Hein [14]
From table 2 above, even a tiny, natural,human population may survive hundreds of years before extinction. Would the carefully managed starship population fare better, or worse?
Despite this maneuver, there is still a lot of handwavium about the creation of a terrestrial habitable environment at the destination. All the problems of building an ECLSS or biosphere in a zone on the planet or its entirety by terraforming, entirely by a non-human approach, are left to the imagination. As with humans, animals such as birds and mammals require parental nurturing, making any robotic seedship only partially viable for terraforming. If panspermia is the expected technology, this crewed journey may not start for many thousands of years.
But what about social stability?
I do applaud the Hyperion team for requiring a plan for maintaining a stable population for 250 years. The issue of damage to a space habitat in the O’Neill era was somewhat addressed by proponents, mainly through the scale of the habitat and repair times. Major malicious damage by groups was not addressed. There is no period in history that we know of that lasted this long without major wars. The US alone had a devastating Civil War just 164 years ago. The post-WWII peace in Europe guaranteed by the Pax Americana is perhaps the longest period of peace in Europe, albeit its guarantor nation was involved in serious wars in SE Asia, and the Middle East during this period. Humans seem disposed to violence between groups, even within families. I couldn’t say whether even a family of women would refrain from existential violence. Perhaps genetic modification or chemical inhibition in the water supply may be solutions to outbreaks of violence. This is speculation in a subject outside my field of expertise. I hope that the competition discovers a viable solution.
In summary, while it is worthwhile considering how we might tackle human star flight of such duration, there is no evidence that we are even close to solving the issues inherent in maintaining any sort of human star flight of such duration with the earlier-stage technologies and the constraints imposed on the designs by the competition. By the time we can contemplate such flights, technological change will likely have made all the constraints superfluous.
References and Further Reading
Genta, G Genta, “Interstellar Exploration: From Science Fiction to Actual Technology,”” Acta Astronautica Vol. 222 (September 2024), pp. 655-660 https://www.sciencedirect.com/science/article/pii/S0094576524003655?via%3Dihub
Gilster P, (2024) “Science Fiction and the Interstellar Imagination,” Web https://www.centauri-dreams.org/2024/07/17/science-fiction-and-the-interstellar-imagination/
BIS “Project Daedalus” https://en.wikipedia.org/wiki/Project_Daedalus
BIS “Project Icarus” https://en.wikipedia.org/wiki/Project_Icarus_(interstellar)
i4is “Project Hyperion Design Competition” https://www.projecthyperion.org/
Heppenheimer, T. A. (1977). Colonies in space: A Comprehensive and Factual Account of the Prospects for Human Colonization of Space. Harrisburg, PA: Stackpole Books, 1977
Soilleux, R. (2020) “Implications for an Interstellar World-Ship in findings from the BIS SPACE Project” – Principium #30 pp5-15 https://i4is.org/wp-content/uploads/2020/08/Principium30-print-2008311001opt.pdf
Nelson, M., Pechurkin, N. S., Allen, J. P., Somova, L. A., & Gitelson, J. I. (2010). “Closed ecological systems, space life support and biospherics.” In Humana Press eBooks (pp. 517–565). https://doi.org/10.1007/978-1-60327-140-0_11
Hempsell, M (2020), “Colonies and World Ships” JBIS, 73, pp.28-36 (abstract) https://www.researchgate.net/publication/377407466_Colonies_and_World_Ships
Tolley, A. (2023) “MaRMIE: The Martian Regolith Microbiome Inoculation Experiment.” Web https://www.centauri-dreams.org/?s=Marmie
Bio-Rad “S3e Cell Sorter” https://www.bio-rad.com/en-uk/category/cell-sorters?ID=OK1GR1KSY
Allen, J., Nelson, M., & Alling, A. (2003). “The legacy of biosphere 2 for the study of biospherics and closed ecological systems.” Advances in Space Research, 31(7), 1629–1639. https://doi.org/10.1016/s0273-1177(03)00103-0
Smith, C. M. (2014). “Estimation of a genetically viable population for multigenerational interstellar voyaging: Review and data for project Hyperion.” Acta Astronautica, 97, 16–29. https://www.sciencedirect.com/science/article/abs/pii/S0094576513004669
Hein A.M,, et al (2020). “World ships: Feasibility and Rationale” Acta Futura, 12, 75-104, 2020 Web https://arxiv.org/abs/2005.04100
March 25, 2025
The Ethics of Spreading Life in the Cosmos

We keep trying to extend our reach into the heavens, but the idea of panspermia is that the heavens are actually responsible for us. Which is to say, that at least the precursor materials that allow life to emerge came from elsewhere, and did not originate on Earth. Over a hundred years ago Swedish scientist Svante Arrhenius suggested that the pressure of starlight could push bacterial spores between planets and we can extend the notion to interstellar journeys of hardy microbes as well, blasted out of planetary surfaces by such things as meteor impacts and flung into outbound trajectories.
Panspermia notions inevitably get into the question of deep time given the distances involved. The German physician Hermann Richter (1808-1876) had something interesting to say about this, evidently motivated by his irritation with Charles Darwin, who had made no speculations on the origin of the life he studied. Richter believed in a universe that was eternal, and indeed thought that life itself shared this characteristic:
“We therefore also regard the existence of organic life in the universe as eternal; it has always existed and has propagated itself in uninterrupted succession. Omne vivum ab aeternitate e cellula!” [All life comes from cells throughout eternity].
Thus Richter supplied what Darwin did not, while accepting the notion of the evolution of life in the circumstances in which it found itself. By 1908 Arrhenius could write:
“Man used to speculate on the origin of matter, but gave that up when experience taught him that matter is indestructible and can only be transformed. For similar reasons we never inquire into the origin of the energy of motion. And we may become accustomed to the idea that life is eternal, and hence that it is useless to inquire into its origin.”
The origins of panspermia thinking go all the way back to the Greeks, and the literature is surprisingly full as we get into the 19th and early 20th Century, but I won’t linger any further on that because the paper I want to discuss today deals with a notion that came about only within the last 60 years or so. As described by Carl Sagan and Iosif Shklovskii in 1966 (in Intelligent Life in the Universe, it’s that panspermia is not only possible but might be something that humans might one day attempt.
Indeed, Michael Mautner and Greg Matloff proposed this in the 1970s (citation below), while digging into the potential risks and ethical problems associated with such a project. The idea remains controversial, to judge from the continuing flow of papers on various aspects of panspermia. We now have a study from Asher Soryl (University of Otago, NZ) and Anders Sandberg (MIMIR Centre for Long Term Futures Research, Stockholm) again sizing up guided panspermia ethics and potential pitfalls. What is new here is the exploration of the philosophy of the directed panspermia idea.

Image: Can life be spread by comets? Comet 2I/Borisov is only the second interstellar object known to have passed through our Solar System, but presumably there are vast numbers of such objects moving between the stars. In this image taken by the NASA/ESA Hubble Space Telescope, the comet appears in front of a distant background spiral galaxy (2MASX J10500165-0152029, also known as PGC 32442). The galaxy’s bright central core is smeared in the image because Hubble was tracking the comet. Borisov was approximately 326 million kilometres from Earth in this exposure. Its tail of ejected dust streaks off to the upper right. Credit: ESA/Hubble.
Spreading life is perhaps more feasible than we might imagine at first glance. We have achieved interstellar capabilities already, with the two Voyagers, Pioneers 10 and 11 and New Horizons on hyperbolic trajectories that will never return to the Solar System. Remember, time is flexible here because a directed panspermia effort would be long-term, seeding numerous stars over periods of tens of thousands of years. The payload need not be large, and Soryl and Sandberg consider a 1 kg container sufficient, one containing freeze-dried bacterial spores inside water-dissoluble UV protective sheaths. Such spores could survive millions of years in transit:
…desiccation and freezing makes D. radiodurans able to survive radiation doses of 140 kGy, equivalent to hundreds of millions of years of background radiation on Earth. A simple opening mechanism such as thermal expansion could release them randomly in a habitable zone without requiring the use of electronic components. Moreover, normal bacteria can be artificially evolved for extreme radiation tolerance, in addition to other traits that would increase their chances of surviving the journey intact. Further genetic modifications are also possible so that upon landing on suitable exoplanets, evolutionary processes could be accelerated by a factor of ∼1000 to facilitate terraforming, eventually resulting in Earth-like ecological diversity.
If the notion seems science fictional, remember that it’s also relatively inexpensive compared to instrumented payload packages or certainly manned interstellar missions. Right now when talking about getting instrumentation of any kind to another star, we’re looking at gram-scale payloads capable of being boosted to a substantial portion of lightspeed, but directed panspermia could even employ comet nuclei inoculated with life, all moving at far slower speeds. And we know of some microorganisms fully capable of surviving hypervelocity impacts, thus enabling natural panspermia.
So should we attempt such a thing, and if so, what would be our motivation? The idea of biocentrism is that life has intrinsic merit. I’ve seen it suggested that if we discover that life is not ubiquitous, we should take that as meaning we have an obligation to seed the galaxy. Another consideration, though, is whether life invariably produces sentience over time. It’s one thing to maximize life itself, but if our actions produce it on locations outside Earth, do we then have a responsibility for the potential suffering of sentient beings given we have no control over the conditions they will inhabit?
That latter point seems abstract in the extreme to me, but the authors note that ‘welfarism,’ which assesses the intrinsic value of well-being, is an ethical position that illuminates the all but God-like perspective of some directed panspermia thinking. We are, after all, talking about the creation of living systems that, over billions of years of evolution, could produce fully aware, intelligent beings, and thus we have to become philosophers, some would argue, as well as scientists, and moral philosophers at that:
While in some cases it might be worthwhile to bring sentient beings into existence, this cannot be assumed a priori in the same way that the creation of additional life is necessarily positive for proponents of life-maximising views; the desirability of a sentient being’s existence is instead contingent upon their living a good life.
Good grief… Now ponder the even more speculative cost of waiting to do directed panspermia. Every minute we wait to develop systems for directed panspermia, we lose prospective planets. After all, the universe, the authors point out, is expanding in an accelerated way (at least for now, as some recent studies have pointed out), and for every year in which we fail to attempt directed panspermia, three galaxies slip beyond our capability of ever reaching them. By the authors’ calculations, we lose on the order of one billion potentially habitable planets each year as a result of this expansion.
These are long-term thoughts indeed. What the authors are saying is reminiscent in some ways of the SETI/METI debate. Should we do something we have the capability of doing when we have no consensus on risk? In this case, we have only begun to explore what ‘risk’ even means. Is it risk of creating “astronomical levels of suffering” in created biospheres down the road? Soryl and Sandberg use the term, thinking directed panspermia should not be attempted until we have a better understanding of the issue of sentient welfare as well as technologies that can be fine-tuned to the task:
Until then, we propose a moratorium on the development of panspermia technologies – at least, until we have a clear strategy for their implementation without risking the creation of astronomical suffering. A moratorium should be seen as an opportunity for engaging in more dialogue about the ethical permissibility of directed panspermia so that it can’t happen without widespread agreement between people interested in the long-term future value of space. By accelerating discourse about it, we hope that existing normative and empirical uncertainties surrounding its implementation (at different timescales) can be resolved. Moreover, we hope to increase awareness about the possibility of S-risks resulting from space missions – not only limited to panspermia.
By S-risks, the authors refer to those risks of astronomical suffering. They assume we need to explore further what they call ‘the ethics of organised complexity.’ These are philosophical questions that are remote from ongoing space exploration, but building up a body of thought on the implications of new technologies cannot be a bad thing.
That said, is the idea of astronomical suffering viable? Life of any kind produces suffering, does it not, yet we choose it for ourselves as opposed to the alternative. I’m reminded of an online forum I once participated in when the question of existential risks to Earth by an errant asteroid came up. In the midst of asteroid mitigation questions, someone asked whether we should attempt to save Earth from a life-killer impact in the first place. Was our species worth saving given its history?
But of course it is, because we choose to live rather than die. Extending that, if we knew that we could create life that would evolve into intelligent beings, would we be responsible for their experience of life in the remote future? It’s hard to see this staying the hand of anyone seriously attempting directed panspermia. What would definitely put the brakes on it would be the discovery that life occurs widely around other stars, in which case we should leave these ecosystems to their own destiny. My suspicion is that this is exactly what our next generation telescopes and probes will discover.
The paper is Soryl & Sandberg, “To Seed or Not to Seed: Estimating the Ethical Value of Directed Panspermia,” Acta Astronautice 22 March 2025 (full text). The Mautner and Matloff paper is “Directed Panspermia: A Technical and Ethical Evaluation of Seeding the Universe,” JBIS, Vol. 32, pp. 419-423, 1979.
March 20, 2025
Why Do Super-Earths and Mini-Neptunes Form Where They Do?

Exactly how astrophysicists model entire stellar systems through computer simulations has always struck me as something akin to magic. Of course, the same thought applies to any computational methods that involve interactions between huge numbers of objects, from molecular dynamics to plasma physics. My amazement is the result of my own inability to work within any programming language whatsoever. The work I’m looking at this morning investigates planet formation within protoplanetary disks. It reminds me again just how complex so-called N-body simulations have to be.
Two scientists from Rice University – Sho Shibata and Andre Izidoro – have been investigating how super-Earths and mini-Neptunes form. That means simulating the formation of planets by studying the gravitational interactions of a vast number of objects. N-body simulations can predict the results of such interactions in systems as complex as protoplanetary disks, and can model formation scenarios from the collisions of planetesimals to planet accretion from pebbles and small rocks. All this, of course, has to be set in motion in processes occurring over millions of years.
Image: Super-Earths and mini-Neptunes abound. New work helps us see a possible mechanism for their formation. Credit: Stock image.
Throw in planetary migration forced by conditions within the disk and you are talking about complex scenarios indeed. The paper runs through the parameters set by the researchers as to disk viscosity and metallicity and uses hydrodynamical simulations to model the movement of gas within the disk. What is significant in this study is that the authors deduce planet formation within two rings at specific locations within the disk, instead of setting the disk model as a continuous and widespread distribution. Drawing on prior work he published in Nature Astronomy in 2021, Izidoro comments:
“Our results suggest that super-Earths and mini-Neptunes do not form from a continuous distribution of solid material but rather from rings that concentrate most of the mass in solids.“

Image: This is Figure 7 from the paper. Caption: Schematic view of where and how super-Earths and mini-Neptunes form. Planetesimal formation occurs at different locations in the disk, associated with sublimation and condensation lines of silicates and water. Planetesimals and pebbles in the inner and outer rings have different compositions, as indicated by the different color coding (a). In the inner ring, planetesimal accretion dominates over pebble accretion, while in the outer ring, pebble accretion is relatively more efficient than planetesimal accretion (b). As planetesimals grow, they migrate inward, forming resonant chains anchored at the disk’s inner edge. After gas disk dispersal, resonant chains are broken, leading to giant impacts that sculpt planetary atmospheres and orbital reconfiguration (c). Credit: Shibata & Izidoro.
Thus super-Earths and mini-Neptunes, known to be common in the galaxy, form at specific locations within the protoplanetary disk. Ranging in size from 1 to 4 times the size of Earth, such worlds emerge in two bands, one of them inside about 1.5 AU from the host star, and the other beyond 5 AU, near the water snowline. We learn that super-Earths form through planetesimal accretion in the inner disk. Mini-Neptunes, on the other hand, result from the accretion of pebbles beyond the 5 AU range.
A good theory needs to make predictions, and the work at Rice University turns out to replicate a number of features of known exoplanetary systems. That includes the ‘radius valley,’ which is the scarcity of planets about 1.8 times the size of Earth. What we observe is that exoplanets generally form at roughly 1.4 or 2.4 Earth size. This ‘valley’ implies, according to the researchers, that planets smaller than 1.8 times Earth radius would be rocky super-Earths. Larger worlds become gaseous mini-Neptunes.
And what of Earth-class planets in orbits within a star’s habitable zone? Let me quote the paper on this:
Our formation model predicts that most planets with orbital periods between 100 days < P < 400 days are icy planets (>10% water content). This is because when icy planets migrate inward from the outer ring, they scatter and accrete rocky planets around 1 au. However, in a small fraction of our simulations, rocky Earthlike planets form around 1 au (A. Izidoro et al. 2014)… While the essential conditions for planetary habitability are not yet fully understood, taking our planet at face value, it may be reasonable to define Earthlike planets as those at around 1 au with rocky-dominated compositions, protracted accretion, and relatively low water content. Our formation model suggests that such planets may also exist in systems of super-Earths and mini-Neptunes, although their overall occurrence rate seems to be reasonably low, about ∼1%.
That 1 percent is a figure to linger on. If the planet formation mechanisms studied by the authors are correct in assuming two rings of distinct growth, then we can account for the high number of super-Earths and mini-Neptunes astronomers continue to find. Such planets are currently thought to orbit about 30 percent of Sun-like stars, meaning that there would be no more than one Earth-like planet around every 300 such stars.
How seriously to take such results? Recognizing that the kind of computation in play here take us into realms we cannot verify through experiment, it’s important to remember that we have to use tools like N-body simulations to delve deeply into emergent phenomena like planets (or stars, or galaxies) in formation. The key is always to judge computational results against actual observation, so that insights can turn into hard data. Being a part of making that happen is what I can only call the joy of astrophysics.
The paper is Shibata & Izidoro, “Formation of Super-Earths and Mini-Neptunes from Rings of Planetesimals,” Astrophysical Journal Letters Vol. 979, No. 2 (21 January 2025), L23 (full text). The earlier paper by Izidoro and team is “Planetesimal rings as the cause of the Solar System’s planetary architecture,” Nature Astronomy Vol. 6 (30 December 2021), 357-366 (abstract).
March 18, 2025
Deep Space and the Art of the Map

NASA’s recently launched SPHEREx space telescope will map the entire celestial sky four times in two years, creating a 3D map of over 450 million galaxies. We can hope for new data on the composition of interstellar dust, among other things, so the mission has certain astrobiological implications. But today I’m focusing on the idea of maps of stars as created from our vantage here on Earth. How best to make maps of a 3D volume of stars? I’ve recently been in touch with Kevin Wall, who under the business name Astrocartics Lab has created the Astrocartics and Interstellar Surveyor maps he continues to refine. He explains the background of his interest in the subject in today’s essay while delving into the principles behind his work.
by Kevin Wall
The most imposing aspect of the universe we live in is that it is 3-dimensional. The star charts of the constellations that we are most familiar with show the 2-dimensional positions of stars fixed on the dome of the sky. We do not, however, live under a dome. In the actual cosmography of the universe some stars are farther and some are closer to us and nothing about their positions is flat in any way. Only the planets that reside in a mostly 2D plane around the Sun can be considered that way.
Now if your artistic inclinations make you want a nice map of the Solar System, you can find many for sale on Amazon with which you can decorate your wall. But if your space interests lie much farther than Pluto or Planet 9 (if it exists) and you want something that shows true cosmography then your choices are next to zero. This has been true since I became interested in making 3D maps of the stars in the mid-90s.
A map of the stars nearest the Sun is of particular interest to me because they are the easiest to observe and will be the first humanity visits. These maps are not really that hard to make and there are a few that you can find today. There is one I once saw on Etsy which is 3D but has a fairly plain design. There are some you can get from Winchell Chung on his 3D Star Maps site, but they are not visually 3D (a number beside the star is used for the Z distance). Also, there are many free star maps on the Internet, but none that really capture the imagination, the sort of thing one might want to display..
So why can’t star travel enthusiasts get a nice map of the nearest stars to Earth with which they can adorn their wall? With that question in mind, I started my interstellar mission to make a map that might be nice enough to make people more interested in star travel. Although I do not consider myself an artist. I thought a map done with more attention to detail and maybe a little artistry would be appreciated. My quest to map the sky has many antecedents, as the image of an ancient Chinese map below shows.

Image: An early star chart. This is the Suzhou Planisphere, created in the 12th Century and engraved in stone some decades later. It is an astronomical chart made as an educational tool for a Chinese prince. Its age is clear from the fact that the north celestial pole lies over 5° from Polaris’ position in the present night sky. Credit: History of Chinese Science and Culture Foundation / Ian Ridpath.
How to Make a 3D Star Chart
Before I go any farther, I need to explain that this article is about how to map objects in 3D space onto a flat 2D map surface. It is not about 3D models, which can be considered a sort of map but clearly involve different construction methods. It is also not quite about computer star map programs. I use the word “quite” because although a star map program is dynamic and seems different from a static wall map, the scene on your flat computer screen is still 2D. The projection your program is using is the same as ones for paper maps but you get to pick your view angle.
The first thing you need to do in making a 3D star map is get the 3D coordinates. This is not really hard but involves some trigonometry. I will not go into the details here because this article is about how to put 3D stars on the maps once you have the coordinates and data for them. I refer you to the 3D Star Maps site for trigonometry assistance.
The basic 3D star map is a 2D X-Y grid with Z coordinates printed next to the stars. The biggest thing going for it is efficient use of map area and, in fact, it is the only way to make a 3D star map with scores of stars on it. This map makes for a good reference; however, visualizing the depth of objects on it is hard. Although you can use graphics to give this type of map some 3D, you really need to use the projection systems invented for illustrations.
Much has been learned about how to show 3-dimensional images on a 2-dimensional surface and I cannot cover everything here. Therefore, I will summarize the methods I have seen used for most 3D star maps. They engage the visual cues that we use to see depth in real life to make all 3 dimensions easy for your map users to read. There are basically 2 ways of projection to visually show the 3D dimensions of something on a flat piece of paper: Parallel and Perspective.
The basic 3D star map uses a parallel projection. In parallel projection, all lines of sight from objects on the map to the viewer are parallel to each. So, unlike in human vision where things get smaller as they get farther away, everything in this sort of projection stays the same size into infinity. Because of this and the fact that such a star map has an X-Y plane that is parallel to the viewing plane, the Z coordinates are perpendicular to the viewing plane so that you can’t see a line connecting the X-Y plane to a star. However, if you tilt the XY plane so that it is no longer parallel, you can see the z dimension as it also is no longer perpendicular to the viewing plane.
Rotating the axes like this is called axonometric projection. It is used for most of the 3D star maps I have seen and is easy to create. It also gives a good illusion of depth. The scale of distances on the map changes depending on the angles an object makes with the map origin point. Although this is not a problem for viewers who only need estimates between objects, if you want to calculate the real distances you will need to do some arithmetic.
Perspective projection simulates the natural way humans see depth. That is, things that are farther from us look smaller. In perspective drawings, lines are drawn toward one or more points on the 2D surface. They determine the progressively smaller proportions of objects in the drawing that are farther from the viewer where the point(s) are considered to be at infinity. Star maps that use this will have distances that scale smaller the farther they are away from the reader. This makes for inconsistent distances, but it allows for maps to have extremely deep objects included on them.
My first map was large and had a simple design. It had a lot of stars (20 LY radius) and used an axonometric projection but it was not much different from the free maps that were available. Looking at it, I saw the problems a map reader would have in using it. These were things my latest map tries to correct, as I elaborate on later.
The main thing I didn’t like about it, however, was that it was not good art and not good star map art as well. It just wasn’t achieving my goal of being something a lot of people would consider putting on their wall. I have already admitted that being an artist is not one of my strong points. However, there are star maps out there that look good. So, I tried to see what the nicest ones had in common and tried to make something different as I moved on to my next star map iteration.
The Art in the Science
A map is like a scientific hypothesis. It attempts to model a physical aspect of the natural world and then it is tested through observation and measurement. This means that map designs have to be based on logical and testable methods. But unlike other sciences, cartography can use art to elaborate on those methods. Therefore, things like color and graphic design and the artistic beauty of the map are important factors.
The art in star maps can go beyond just the graphical enhancements that were intended. Looking at the night sky gives people a sense of wonder. Star maps, if done right, can capture that sense of wonder. Most maps have minimalist art designs that seem to do that best – circles and lines amidst white dots on a dark background. Fantasy star map art goes a bit farther in design and creativity but such maps are always recognized as having to do with that wonder. However, I think the more minimalist ones show the mystery better. Here is a minimalist fantasy star map without any 3D aspect to it that I made that has some of the aesthetics that I like.

Another map that has captured this quality of mystery is called ‘Star Chart for Northern Skies.’ Published by Rand McNally in 1915, it is a sky map of the northern hemisphere, one that interior designer Thomas O’Brien referenced in the magazine Elle Décor and later discussed in one of his books. It is a real map intended for reference and maybe to decorate classroom walls. It is one of the maps that have a simple style that nevertheless gives that sense of wonder. Although having a star map in an astronomy magazine is great, Elle Décor magazine reaches a much wider audience of people who would never have given this subject a single thought. This minimalist style of star map art is what I wanted for my own map.

Image: The Rand McNally star chart as seen displayed in Thomas O’Brien’s home. Credit: Thomas O’Brien.
To make a minimalist art 3D star map demands a projection system that has some visual way to show depth without needing a lot of lines drawn on it. The axonometric and perspective projections seemed to me to require too much background graphics. So, I had to come up with something a bit different than what has been used before.
Eventually I thought of what was to be the 3D depth graphics of the map I call the Astrocartica (shown below). The graphics show visually the Z dimension of the star systems on it, but it is not as intuitively obvious as the other projections I have mentioned. You can use the map to find accurate distances between star systems with a ruler and without resorting to a calculator or even doing arithmetical estimating in your head.
I have found since making the Astrocartica that more than a few people have difficulty seeing how the graphics work to show the third dimension. Possibly this is because the system I use is unfamiliar to most people and my illustrations and efforts to explain it do not seem to be sufficient. So, I decided to make another star chart that was more user friendly.

Image: The Astrocartica Interstellar Chart
The Science in the Art
A book called Envisioning Information by Edward Tufte (Graphics PR, 1990) has greatly influenced my star map designs. Tufte is an expert in his field of behavioral science and his book covers many aspects of data presentation such as layering and color. I had read the book while doing the Astrocartica star map and what I took away was just how art and science need to work together for good information display. I can’t say I succeeded completely in applying every principle in the book, but Tufte did make me aware of what a good design for readability needs to accomplish.
In the Astrocartica map, I emphasized the art. But, in my next chart I wanted to emphasize the readability of a star map because of my experience with my other maps. Since the depth projection was the chief issue with the Astrocartica, I considered the proven ways to illustrate 3 dimensions on a flat surface. The parallel and perspective projections were designed to work with the use of the visual cues that humans use and they have been used for centuries. So, I decided to use one of these. I felt perspective is more appropriate for pictures and painting and that, for a map, the scaling for objects in a perspective illustration makes it hard to measure accurate distances without doing arithmetic. I chose axonometric because scales were not as inconsistent as perspective. Also, parallel projection is often used for scenes in computer games and is familiar to people as a way to illustrate 3D on a flat computer screen.
My first map had a single plane. This put some stars that were far from the plane on the end of long extenders that made reading their X-Y position awkward. Also, having all the extenders on the one plane made it crowded and hard to differentiate them. So, I tried maps with several planes and settled on a design with three.
I also put several visual cues on the new map, called Interstellar Surveyor, to show the differences in the local space cosmography. First, the grid lines that are close to the stars are a lighter color that stands out compared to the lines that are farther that are darker. This shows areas of local space that are relatively empty. Also, the edges of the parts of the planes that have stars are thicker than the parts that do not.
One thing that I took from the Astrocartica was the star system graphics. It shows distances in star systems by increasing scale by a magnitude of 10x as you go away from the primary. I tilted the system plane to match the main ones for the sake of the art.
I think, overall, the Interstellar Surveyor map is more user-friendly than the Astrocartica or the first map I attempted.

Image: The Interstellar Surveyor Chart.
Astrocartics
I think the cartography of outer space is a long neglected field of study. Cartography has a unique connection with the human understanding of the world around us. It seems to serve both our rationalizing and aesthetic senses at the same time. That alone makes it important to develop and expand. But, while cartography has been engaged in studying the Earth, it really hasn’t explored the rest of the universe like some other sciences have even though it can.
In every field of study that is based on science there are logical principles. General cartography principles divide map projections of the Earth into how they transform areas and distances. Maps of outer space also have differences and patterns that seem to be able to be put into a categorical system. Here is a possible system to categorize and (more importantly) understand maps of outer space. It attempts to put the different projection systems into categories and is based on how the X-Y plane of a map is rotated in 3-space.
Type I – Planes are parallel to the viewing plane – these would be flat maps with little 3D relief.
Type II – Planes are at an angle between parallel and perpendicular – these would use mostly axonometric projections for 3D relief.
Type III – Planes are perpendicular – for deep field maps and art.
There is one other thing – the name of the field. The term “stellar cartography” would be the first choice. But it is very deeply rooted in sci-fi and is too often pictured as the map room of a starship. That is not necessarily a bad thing but another problem is that there is more to mapping outer space than just stars – there are nebulas and planets with moons and perhaps other kinds of space terrains. Outer space mapping is more than just “stellar”. The word “astrocartography” is another logical choice. However, it has been used as a label for a branch of astrology for many decades now. Also, the word is trademarked. The word “astrography” is astro-photography.
The word “astrocartics” means charts of outer space. It comes from the word “astro” which means “star” but can also mean “outer space” and the word “carte” which is an archaic form of the word “chart” or “map”. So this is my proposal for a name. Also, I think it sounds cool.
Well, I think I have said all that I can about astrocartics. I am going to be making new maps. There will be an Astrocartica 2.0, a solar system map with unique graphics and a map that might be considered astro-political in essence. I will also be adding a blog to my store in a few months. I am willing to talk to anyone who wishes about space maps.
March 14, 2025
Are Supernovae Implicated in Mass Extinctions?

As we’ve been examining the connections between nearby stars lately and the possibility of their exchanging materials like comets and asteroids with their neighbors, the effects of more distant events seem a natural segue. A new paper in Monthly Notices of the Royal Astronomical Society makes the case that at least two mass extinction events in our planet’s history were forced by nearby supernova explosions. Yet another science fiction foray turned into an astrophysical investigation.
One SF treatment of the idea is Richard Cowper’s Twilight of Briareus a central theme of which is the transformation of Earth through just such an explosion. Published by Gollancz in 1974, the novel is a wild tale of alien intervention in Earth’s affairs triggered by the explosion of the star Briareus Delta, some 130 light years out, and it holds up well today. Cowper is the pseudonym for John Middleton Murry Jr., an author I’ve tracked since this novel came out and whose work I occasionally reread.

Image: New research suggests at least two mass extinction events in Earth’s history were caused by a nearby supernova. Pictured is an example of one of these stellar explosions, Supernova 1987a (centre), within a neighbouring galaxy to our Milky Way called the Large Magellanic Cloud. Credit: NASA, ESA, R. Kirshner (Harvard-Smithsonian Center for Astrophysics and Gordon and Betty Moore Foundation), and M. Mutchler and R. Avila (STScI).
Nothing quite so exotic is suggested by the new paper, whose lead author, Alexis Quintana (University of Alicante, Spain) points out that supernova explosions seed the interstellar medium with heavy chemical elements – useful indeed – but can also have devastating effects on stellar systems located a bit too close to them. Co-author Nick Wright (Keele University, UK) puts the matter more bluntly: “If a massive star were to explode as a supernova close to the Earth, the results would be devastating for life on Earth. This research suggests that this may have already happened.”
The conclusion grows out of the team’s analysis of a spherical volume some thousand parsecs in radius around the Sun. That would be about 3260 light years, a spacious volume indeed, within which the authors catalogued 24,706 O- and B-type stars. These are massive and short-lived stars often found in what are known as OB associations, clusters of young, unbound objects that have proven useful to astronomers in tracing star formation at the galactic level. The massive O type stars are considered to be supernova progenitors, while B stars range more widely in mass. Even so, larger B stars also end their lives as supernovae.
Making a census of OB objects has allowed the authors to pursue the primary reason for their paper, a calculation of the rate at which supernovae occur within the galaxy at large. That work has implications for gravitational wave studies, since supernova remnants like black holes and neutron stars and their interactions are clearly germane to such waves. The distribution of stars within 1 kiloparsec of the Sun shows stellar densities that are consistent with what we find in other associations of such stars, and thus we can extrapolate on the basis of their behavior to understand what Earth may have experienced in its own past.
Earlier work by other researchers points to supernovae that have occurred within 20 parsecs of the Sun – about 65 light years. A supernova explosion some 2-3 million years ago lines up with marine extinction at the Pliocene-Pleistocene boundary. Another may have occurred some 7 million years ago, as evidenced by the amount of interstellar iron-60 (60Fe), a radioactive isotope detected in samples from the Apollo lunar missions. Statistically, it appears that one OB association (known as the Scorpius–Centaurus association) has produced on the order of 20 supernova explosions in the recent past (astronomically speaking), and HIPPARCOS data show that the association’s position was near the Sun’s some 5 to 7 million years ago. These events, indeed, are thought by some to have produced the so-called Local Bubble, the low density cavity in the interstellar medium within which the Solar System currently resides.
Here’s a bit from the paper on this:
An updated analysis with Gaia data from Zucker et al. (2022) supports this scenario, with the supernovae starting to form the bubble at a slightly older time of ∼14 Myr ago. Measured outflows from Sco-Cen are also consistent with a relatively recent SN explosion occurring in the solar neighbourhood (Piecka, Hutschenreuter & Alves 2024). Moreover, there is kinematic evidence of families of nearby clusters related to the Local Bubble, as well as with the GSH 238+00 + 09 supershell, suggesting that they produced over 200 SNe [supernovae] within the last 30 Myr (Swiggum et al. 2024).
But the authors of this paper focus on much earlier events. Earth has experienced five mass extinctions, and there is coincidental evidence for the effects of a supernova in the late Devonian and Ordovician extinction events (372 million and 445 million years ago respectively). Both are linked with ozone depletion and mass glaciation.
A supernova going off within a few hundred parsecs of Earth would have atmospheric effects but little of significance. But the authors point out that if we close the range to 20 parsecs, things get more deadly. The destruction of the Earth’s ozone layer would be likely, with resultant mass extinctions a probable result:
Two extinction events have been specifically linked to periods of intense glaciation, potentially driven by dramatic reductions in the levels of atmospheric ozone that could have been caused by a near-Earth supernova (Fields et al. 2020), specifically the late Devonian and late Ordovician extinction events, 372 and 445 Myr ago, respectively (Bond & Grasby 2017). Our near Earth ccSN [core-collapse supernova] rate of ∼2.5 per Gyr is consistent with one or both of these extinction events being caused by a nearby SN.
So this is interesting but highly speculative. The purpose of this paper is to examine a specific volume of space large enough to draw conclusions about a type of star whose fate can tell us much about supernova remnants. This information is clearly useful for gravitational wave studies. The supernova speculation in regard to extinction events on Earth is a highly publicized suggestion that grows out of this larger analysis. In other words, it’s a small part of a solid paper that is highly useful in broader galactic studies.
Supernovae get our attention, and of course such discussions force the question of what happens in the event of a future supernova near Earth. Only two stars – Antares and Betelgeuse – are likely to become a supernova within the next million years. As both are more than 500 light years away, the risk to Earth is minimal, although the visual effects should make for quite a show. And we now have a satisfyingly large distance between our system and the nearest OB association likely to produce any danger. So much for The Twilight of Briareus. Great book, though.
The paper is Van Bemmel et al., “A census of OB stars within 1 kpc and the star formation and core collapse supernova rates of the Milky Way,” accepted at Monthly Notices of the Royal Astronomical Society (preprint).
Paul Gilster's Blog

- Paul Gilster's profile
- 7 followers

