
Paul Gilster's Blog, page 159
February 10, 2016
A Future We Can Choose
The very small may lead us to the very large. Payload sizes, for one thing, can be shrunk as we increasingly master the art of miniaturization, giving us far more bang for the buck. In that sense, we can think about tiny interstellar probes that may one day be sent, as Robert Freitas has envisioned, in waves of exploration, each of them no larger than a sewing needle, but armed with artificial intelligence and capable of swarm-like behavior. Mastering the tiny thus enables the longest of all journeys.
But thinking about small payloads also makes me ponder much larger constructs. Suppose in a hundred years we can work at the atomic level to build structures out of the abundant raw material available in the asteroid or Kuiper belts. It’s possible to imagine enormous arcologies of the kind discussed by Gerard O’Neill that may one day house substantial human populations. In this way nanotech opens the door to renovation in the realm of gigantic colony worlds.
And if one of these colony worlds, eventually exploring ever deeper into the Solar System, becomes so taken with life off-planet that it continues its outward movement, perhaps we’ll see nearby stars explored in millennial time-frames, harvesting Oort Cloud materials and their counterparts among nearby stars. For that matter, could nanotech one day help us build the kind of lens structures Robert Forward envisioned to focus laser beams on departing interstellar craft containing humans? Using these technologies, Forward could work out travel times in decades rather than millennia. The art of the small may work in both these directions.

Image: Don Davis produced this image of a toroidal-shaped space colony for NASA, emphasizing not only its size but its closed ecosystem. Credit: Don Davis / NASA Ames Research Center.
The Next Hundred Years
Closer to our own time, virtual reality enabled by miniaturization and microsatellites may play a large role in how we explore Mars. Robotic bodies, as Emily Lakdawalla points out in a Nautilus essay called Here’s What We’ll Do in Space by 2116, have no need for the mammalian necessities of water and shelter. Putting robots on the Martian surface that serve as avatars for humans in Mars orbit would allow us to map and explore vast areas with minimal risk to life. Now we’re talking building up infrastructure of the sort that may eventually fill the Solar System.
A ‘virtual Mars’ from orbit is one Elon Musk would dislike, given his intention of walking the Martian surface one day, and given the growth of commercial space, it’s possible that private companies will be on the surface before a NASA or ESA-led robotic effort of the kind Lakdawalla imagines might be attempted. But surely there’s a rational mix between human and robotic to be found here. We’ll never tame the questing spirit that drives some to push for manned missions — nor should we — but the advantages of robotics will surely play a huge role in the creation of a human presence around and on whatever bodies we explore in the coming century.
I’m much in favor of Lakdawalla’s ideas on what happens next:
Most of the planets that we’ve discovered beyond the solar system are Neptune-sized, so it would behoove us to understand how this size of world works by visiting one with an orbiter. Uranus is closer, so quicker and easier to get to; but because of its extreme tilt, it’s best to visit near its equinox, an event that happens only once in 42 years. The last equinox was in 2007; I will be sorely disappointed if we do not have an orbiter at or approaching Uranus in 2049. But we may choose to orbit Neptune before we travel to Uranus, because Neptune has an additional draw: its moon Triton, likely a captured Kuiper belt object, and a world where Voyager 2 saw active geysers.
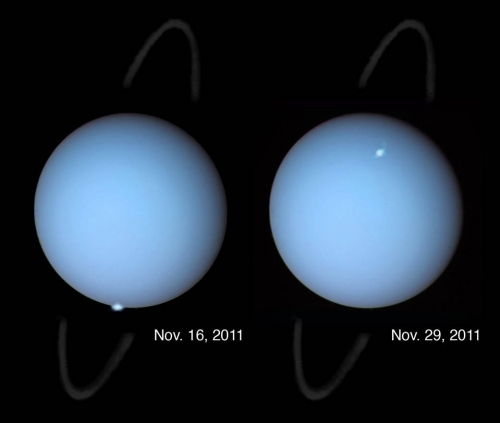
Image: Hubble observations of Uranus, among the first clear images, taken from the distance of Earth, to show aurorae on the planet. Imagine what we could learn with an orbiter in place here. Credit: NASA, ESA, and L. Lamy (Observatory of Paris, CNRS, CNES).
Triton may prove irresistible, especially given what we’ve seen at Pluto, but so too are Kuiper Belt objects like Haumea. This is an interesting place, a fast-spinner (about once every 3.9 hours) that is orbited by two moons, one of them (Hi’iaka) a whopping 300 kilometers in diameter. The scientific interest here is quickened by the belief that Haumea’s oblong shape resulted from a collision, perhaps giving us an opportunity to deeply investigate its composition. In any case, its highly reflective surface seems to be covered with water ice, so perhaps there is some form of cryovolcanism going on here. Triton again comes to mind.
For a look at a Haumea mission concept, see Fast Orbiter to Haumea and Haumea: Technique and Rationale, based on ideas Joel Poncy (Thales Alenia Space, France) presented at the Aosta interstellar conference back in 2009. But in weighing outer system missions, keep in mind as well the search for the putative Planet 9, the discovery of which would doubtless fuel speculation on the kind of technologies that might reach it. Lakdawalla mentions the possibility but, noting that the world would be ten times further out than Pluto, says that it would take a revolution in spacecraft propulsion to get to it in less than a hundred years.
The FOCAL Mission’s Allure
True enough, but the very presence of this intriguing object poses yet another driver for the development of technologies to reach it. So does a target with an equally compelling justification, the Sun’s gravitational lensing focus beginning at 550 AU. A spacecraft sent out from our system in such a trajectory that it would observe gravitational lensing of its target — on the other side of the Sun — could yield huge returns, given the vast magnifying power of the lens. Bear in mind that the focal line in a gravitational lens runs to infinity, so as the spacecraft receded, continuing observations could be made across a wide range of wavelengths.
FOCAL is the name of the mission, given Claudio Maccone’s championing of the concept and the name dating back to the early 1990s, and you can see the design of such a mission in his book Deep Space Flight and Communications: Exploiting the Sun as a Gravitational Lens (Springer, 2009). We continue to explore sail missions with gravity assist and, further in the future, beamed laser or microwave methods to reach the needed velocities.
Meanwhile, FOCAL’s allure is bright: As Michael Chorost writes in The Seventy Billion Mile Telescope, “For one particular frequency that has been proposed as a channel for interstellar communication, a telescope would amplify the signal by a factor of 1.3 quadrillion.” SETI anyone?
Then again, suppose Pale Red Dot, now working hard on Proxima Centauri using the HARPS spectrograph at ESO’s 3.6-meter telescope at La Silla, turns up an interesting planet in the habitable zone. Or perhaps David Kipping will find something in the MOST data he is currently working on. As we learned more about such a planet (and other possibilities around Centauri A or B), the idea of turning a FOCAL-like lens upon the stars would become irresistible.
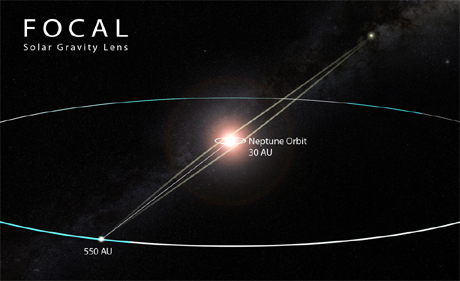
Image: Beyond 550 AU, we can start to take advantage of the Sun’s gravitational lens, which may allow astrophysical observations of a quality beyond anything we can do today. Credit: Adrian Mann.
With all this in mind, though, we can’t forget not only how far we have to go before we’re ready for FOCAL, but how many things we can accomplish much closer to home. Lakdawalla writes:
Some people have suggested floating balloons under the Venusian sulfuric-acid cloud deck to search for active volcanoes, or sending similar balloons under the smog of Saturn’s moon Titan to watch its methane rivers flow and possibly even touch down in a Titanian ethane lake. We’ve dreamed of touring the populations of icy worlds that float ahead of and behind the giant planets in their orbits; many of these worlds have binary companions, and some of them have rings. We’ve suggested setting up lunar bases on polar crater rims where the Sun always shines, and sending rovers into crater bottoms where the Sun never does, where water ice may have been preserved over the age of the solar system.
All true, and I still love the AVIATR concept (Aerial Vehicle for In-situ and Airborne Titan Reconnaissance), a 120 kg airplane fueled by Advanced Stirling Radioisotope Generators (ASRG), which demand less plutonium-238 than earlier RTGs and produce less waste heat. AVIATR could stay airborne in Titan’s benign conditions (benign, that is, because of a dense atmosphere and light gravity) for a mission lasting as long as a year, exploring the moon by powered flight. See AVIATR: Roaming Titan’s Skies for background on the concept. There has been no shortage when it comes to intriguing concepts for exploring Titan.
My belief is that an interplanetary infrastructure will one day lead to our first interstellar missions, but just when those will occur is impossible to know. In any case, building the infrastructure will be so fraught with discovery that every step of the way is cause for celebration, assuming we have the sense to continue the push outwards. That, of course, is an open issue, and I suspect there will never be a time when expansion into space is anything but controversial. As always, I fall back on Lao-Tzu: “You accomplish the great task by a series of small acts.”
Keep working.


February 9, 2016
Inside Rocky Exoplanets
We’ve gone from discovering the presence of exoplanets to studying their atmospheres by analyzing the spectra produced when a planet transits in front of its star. We’re even in the early stages of deducing weather patterns on some distant worlds. Now we’re looking at probing the inside of planets to learn whether their internal structure is something like that of the Earth.
The work is led by Li Zeng (Harvard-Smithsonian Center for Astrophysics), whose team developed a computer model based on the Preliminary Reference Earth Model (PREM), the standard model for the Earth’s interior. Developed by Adam Dziewonski and Don L. Anderson for the International Association of Geodesy, PREM attempts to model average Earth properties as a function of radius. Zeng adjusted the model for differing masses and compositions and applied the revised version to six known rocky exoplanets with well understood characteristics.
The work shows that rocky worlds should have a nickel/iron core that houses about thirty percent of the planet’s mass, with the remainder being mantle and crust. “We wanted to see how Earth-like these rocky planets are,” says Zeng. “It turns out they are very Earth-like.”
From the paper:
These dense exoplanets between 2 and 5 M⊕ so far appear to agree with the mass-radius relation with CMF [Core Mass Fraction] ≈ 0.26, suggesting that they are like the Earth in terms of their proportions of mantle and core. But their surface conditions are utterly different as they are much too hot. This is due to observational bias that currently it is much easier for us to detect close-in planets around stars. The fact that we now see so many of them suggests there may be abundant Earth-like analogs at proper distances from their stars to allow existence of liquid water on their surfaces.
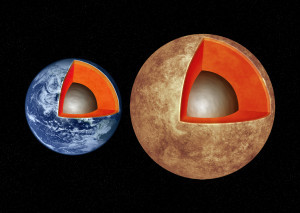
Image: This artist’s illustration compares the interior structures of Earth (left) with the exoplanet Kepler-93b (right), which is one and a half times the size of Earth and 4 times as massive. New research finds that rocky worlds share similar structures, with a core containing about a third of the planet’s mass, surrounded by a mantle and topped by a thin crust. M. Weiss/CfA.
The paper points out that these conclusions fit with studies of disintegrated planet debris in polluted white dwarf spectra. Here the remnant of a star like the Sun has evidently swallowed up planetary materials, usefully producing spectra that can be analyzed to see what elements emerge. Such studies indicate debris that resembles the composition of the Earth, where over 85 percent of the mass is composed of oxygen (O), magnesium (Mg), silicon (Si), and iron (Fe). Moreover, we find similar ratios of iron to silicon and magnesium to silicon. These ratios indicate formation processes similar to those we find in our own Solar System:
Current planet formation theory suggests that the solar nebula was initially heated to very high temperatures to the extent that virtually everything was vaporized except for small amount of presolar grains… The nebula then cools to condense out various elements and mineral assemblages from the vapor phase at different temperatures according to the condensation sequence… Fe-Ni [nickel] metal alloy and Mg-silicates condense out around similar temperatures of 1200-1400K (depending on the pressure of the nebula gas) according to thermodynamic condensation calculation… Oxygen, on the other hand, does not have a narrow condensation temperature range, as it is very abundant and it readily combines with all kinds of metals to form oxides which condense out at various temperatures as well as H [hydrogen], N [nitrogen], C [carbon] to form ices condensing out at relatively low temperatures… As supported by the polluted white dwarf study, we expect other exoplanetary systems to follow similar condensation sequence as the solar system in a H-dominated nebular environment for the major elements: Fe, Mg, Si, and O…
The assumption of chemical compositions similar to the Earth’s may come into question in parts of the galaxy that are less rich in metals, in which case different planetary interior structures could evolve, a subject Zeng and team plan to investigate in future research.
The paper is Zeng et al., “Mass-Radius Relation for Rocky Planets based on PREM,” accepted at The Astrophysical Journal (preprint).


February 8, 2016
Probing the Interior of a Comet
Knowing what comets are made of — dust and ice — only begins to answer the mystery of what is inside them. A compact object with this composition should be heavier than water, but we know that many comets have densities much lower than that of water ice. The implication is that comets are porous, but what we’d still like to know is whether this porosity is the result of empty spaces inside the comet or an overall, homogeneous low-density structure.
For answers, we turn to the European Space Agency’s continuing Rosetta mission. In a new paper in Nature, Martin Pätzold (Rheinische Institut für Umweltforschung an der Universität zu Köln, Germany) and team have gone to work on the porosity question by analyzing Comet 67P/Churyumov-Gerasimenko, around which Rosetta travels. It’s no surprise to find that 67P/Churyumov-Gerasimenko is a low-density object, but an examination of the comet’s gravitational field shows that we can now rule out a cavernous interior.
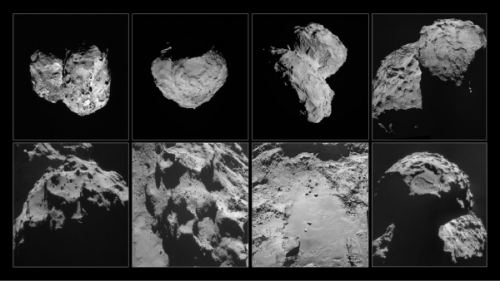
Image: These images of comet 67P/Churyumov-Gerasimenko were taken by Rosetta’s navigation camera between August and November 2014. Top row, left to right: Comet pictured on 6 August 2014, at a distance of 96 km; 14 August, at a distance of 100 km; 22 August, at a distance of 64 km; 14 September, at a distance of 30 km. Bottom row, left to right: Comet pictured on 24 September, at a distance of 28 km; 24 October, at a distance of 10 km; 26 October, at a distance of 8 km; 6 November, at a distance of 30 km. Copyright: ESA/Rosetta/NAVCAM, CC BY-SA IGO 3.0.
This is tricky work performed using Rosetta’s Radio Science Experiment (RSI) to examine just how the Rosetta orbiter is affected by the gravity of the comet. And just as we do when measuring the tiniest motions of distant stars to search for planetary companions, the researchers use Doppler methods to make the call, measuring how signals from the spacecraft change in frequency as Rosetta is affected by the comet’s gravity. In this way we can build up a picture of the gravity field across the comet while working to rule out other influences.
“Newton’s law of gravity tells us that the Rosetta spacecraft is basically pulled by everything,” says Pätzold, the principal investigator of the RSI experiment. “In practical terms, this means that we had to remove the influence of the Sun, all the planets – from giant Jupiter to the dwarf planets – as well as large asteroids in the inner asteroid belt, on Rosetta’s motion, to leave just the influence of the comet. Thankfully, these effects are well understood and this is a standard procedure nowadays for spacecraft operations.”
As this ESA news release explains, the team wasn’t through even after compensating for all these other Solar System bodies. Also to be considered was the pressure of solar radiation and the gas escaping through the comet’s tail. Rosetta uses an instrument called ROSINA to measure the flow of gas past the spacecraft, allowing its effect to be measured. No sign of large internal caverns emerged from the analysis.
We’re lucky with 67P/Churyumov-Gerasimenko in that the comet turned out not to be round, as ground-based observations had previously suggested. As we’ve gotten to know the comet, its distinctive double-lobed shape has proven not only visually interesting but scientifically helpful. The twin lobes mean that differences in the gravity field are more pronounced and easier to study from the 10 kilometer distance Rosetta had maintained for reasons of safety. With variations in the gravity field already showing from 30 kilometers out, the much richer measurements from 10 kilometers could proceed.
The result: Comet 67P/Churyumov-Gerasimenko is found to have a mass of slightly less than 10 billion tonnes. By using images from Rosetta’s OSIRIS camera, the team was able to model the comet’s shape so as to produce a volume of approximately 18.7 km3, yielding a density of 533 kg/m3. Given this and the lack of large interior spaces, we can look at the comet’s porosity as a property of its constituents. Rather than a compacted solid, comet dust is more of a ‘fluffy’ aggregate of high porosity and low density.
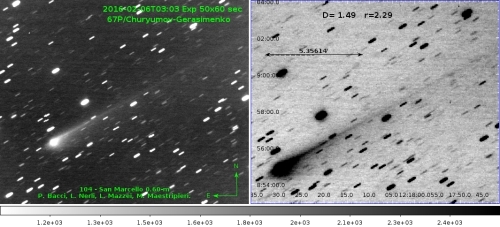
Image: Rosetta from Earth, in an image taken by Paolo Bacci on February 6, 2016 from San Marcello Pistoiese, Italy.
Keep your eye on Rosetta. In September, the spacecraft will be brought in for a controlled impact on the surface, a challenging navigational feat for controllers at ESA’s European Space Operations Centre (ESOC) in Darmstadt, Germany. Closing on the comet will allow the gravity observations to continue at a much higher level of detail, making it possible for caverns only a few hundred meters across to be detected, if indeed they are there at all.
The paper is Pätzold et al., “A homogeneous nucleus for comet 67P/Churyumov–Gerasimenko from its gravity field,” Nature 530 (04 February 2016), 63-65 (abstract).


February 5, 2016
The Distant Thing Imagined
If there’s one thing Pluto turned out to have beyond all expectation, it’s geological activity. New Horizons is now showing us what researchers are calling ‘hills of water ice’ floating in a sea of frozen nitrogen, much like icebergs moving through our own Arctic Ocean. The isolated hills are thought to be fragments of the water ice in the surrounding upland regions. Measuring several kilometers across, they are found in Sputnik Planum, a plain within Pluto’s ‘heart.’

Image: The image shows the inset in context next to a larger view that covers most of Pluto’s encounter hemisphere. The inset was obtained by New Horizons’ Multispectral Visible Imaging Camera (MVIC) instrument. North is up; illumination is from the top-left of the image. The image resolution is about 320 meters per pixel. The image measures a little over 500 kilometers long and about 340 kilometers wide. It was obtained at a range of approximately 16,000 kilometers from Pluto, about 12 minutes before New Horizons’ closest approach on July 14, 2015. Credit: NASA/Johns Hopkins University Applied Physics Laboratory/Southwest Research Institute.
The hills, according to this JHU/APL news release, are probably upland fragments that are being carried by nitrogen glaciers into the ice plain. When they reach the central cellular terrain of Sputnik Planum, convective motion of the nitrogen ice pushes them to the edges of the cells, where they can be found in groups. Look toward the top of the image for Challenger Colles, where a large number of hills are found in an area roughly 60 by 35 kilometers. Near the boundary with the uplands and away from Sputnik Planum’s cellular terrain, this may be a region where the hills have run aground thanks to the shallowness of the nitrogen ice.
Learning about Pluto’s terrain as New Horizons data continues to stream in, I’m remembering how we used to imagine it. Digging around recently in my collection of old magazines, I uncovered the June, 1935 issue of Astounding Stories, then in the hands of editor F. Orlin Tremaine (this was two years before John Campbell took over). A story by Raymond Z. Gallun caught my eye because of its title: “Blue Haze on Pluto.” You’ll recall that last Monday we took another look at the real blue haze on Pluto as seen by New Horizons.
In Gallun’s story, a stranded astronaut has crashed into a deep crevasse and is forced to trek to a settlement on Pluto, learning as he does about a strange form of life that, in the Plutonian night, “…glimmered like serried hosts of huge gems in whose hearts icy fire of every hue throbbed and cascaded.” All of this in a landscape of “steep crags, part ice, part frozen atmosphere” that could stand in pretty well for parts of Pluto we see today. It’s not a bad tale for its day (our hero is, of course, rescued, with the ‘blue haze’ playing an inadvertent role), but for me its value is in that interesting interplay between the distant thing imagined and the distant thing observed, that generative place where our preconceptions are transformed by the incoming flow of data.


February 4, 2016
Saturn’s Rings: Puzzling Mass Density Findings
Given that we have four planets in our Solar System with rings, it’s a natural thought that if so-called Planet Nine does exist, it might likewise show a system of rings. After all, Caltech’s Konstantin Batygin and Mike Brown are talking about a planet with a mass on the order of ten times that of the Earth. Neptune is about 17 Earth masses, while Uranus is 14.5 as massive. If Planet Nine is an ejected ice giant, perhaps it joins Uranus, Neptune, Jupiter and Saturn in having a ring system of its own, along with a thick atmosphere of hydrogen and helium.
Of course, we have to discover Planet Nine first, a process that may take some time if, indeed, it is successful. Meanwhile, we have interesting developments in the Solar System’s most intriguing ring system. As compared with those of other planets, Saturn’s rings are visually stunning. The B ring is the brightest and most opaque of the planet’s rings, but now we’re finding out that brightness and opacity have little correlation with how dense a ring may actually be. In fact, more opaque areas in the rings do not necessarily contain more material.
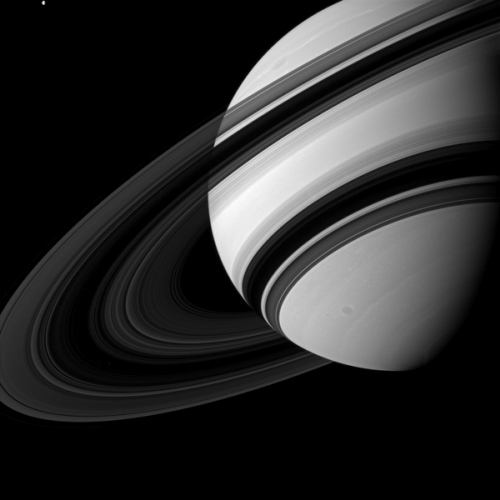
Image: Even Saturn’s rings appear to dwarf Tethys (1,062 kilometers across), which is in the upper left of the image, although scientists believe the moon to be many times more massive than the entire ring system combined. This view looks toward the unilluminated side of the rings from about 18 degrees below the ringplane. The image was taken in green light with the Cassini spacecraft wide-angle camera on Aug. 19, 2012. The view was acquired at a distance of approximately 2.4 million kilometers from Saturn and at a Sun-Saturn-spacecraft, or phase, angle of 63 degrees. Image scale is 138 kilometers per pixel. Credit: NASA/JPL-Caltech/Space Science Institute.
This is work using Cassini data that goes about the complicated process of ‘weighing’ the opaque center of the B ring, which involves analyzing spiral density waves within the structure. These fine-scale ring features are pulled into existence by Saturn’s gravity and that of individual moons tugging on ring particles, their structure reflecting the amount of mass in given parts of the rings. While different levels of opacity are obvious, the results on mass are puzzling.
Matthew Hedman (University of Idaho), who is lead author on the work and a participating scientist in the Cassini mission that collected the needed data, frames the problem this way:
“At present it’s far from clear how regions with the same amount of material can have such different opacities. It could be something associated with the size or density of individual particles, or it could have something to do with the structure of the rings.”
So we have a prominent B ring whose opacity varies markedly across its width, while the amount of material in it does not seem to vary greatly from one part of the ring to another. Cassini co-investigator Phil Nicholson (Cornell University) notes that appearances aren’t always what we think. “A good analogy is how a foggy meadow is much more opaque than a swimming pool,” says Nicholson, “even though the pool is denser and contains a lot more water.”
Just what it is about Saturn’s rings that sets them so far apart from the other rings in our Solar System is an open question. As this JPL news release points out, an earlier study by Cassini’s composite infrared spectrometer team has suggested that there was less material in the B ring than researchers once thought. This new work measures the density of mass in the ring for the first time to corroborate the idea. The researchers were able to use data from Cassini’s visible and infrared mapping spectrometer as the craft looked through the rings toward a bright star. The method helped to identify spiral density waves that were otherwise not apparent.
From the paper in press:
… this new estimate of the ring’s total mass is based on just a few locations in the B ring, and so one could argue that most of the B-ring’s mass is hidden in the truly opaque parts of the rings. However, the measurements considered here include regions with optical depths between 3.5 and 4.5, so these massive regions would have to be those with opacities above 4 or 5. Note that only about 27% of the ring’s surface area has an optical depth greater than 4, and less than 16% has an optical depth above 5, so there is not much space to hide a large amount of mass.
Understanding how the rings are constituted is a step toward understanding their age and origin. While the B ring is thought to contain the bulk of material in the ring system, it’s still surprising that the B ring may have only two to three times the mass of the A ring. Parts of the B ring are, after all, up to ten times more opaque than the A ring. We can look to one of Cassini’s last acts, in 2017, to help extend our data. The spacecraft, enroute to an ultimate descent into Saturn’s clouds, will fly just inside the rings, offering measurements that will help us separate the mass of the rings in the aggregate from the previously measured combined mass of planet and rings.
The paper is Hedman and Nicholson, “The B-ring’s surface mass density from hidden density waves: Less than meets the eye?” in press at Icarus and available online 22 January 2016 (abstract).


February 3, 2016
A New Look at the ‘Big Whack’
Somewhere a decade or so back in these pages a Centauri Dreams commenter described the event that formed our Moon as ‘the big whack.’ Although I hadn’t run across it before, the phrase turns out to have been common parlance for what is now thought to be a massive collision between the Earth and an early planetesimal. But whatever the case, we know a bit more about the cataclysm thanks to new work out of UCLA, as reported in the journal Science.
The impactor, which struck about 4.5 billion years ago, is commonly called Theia. So how do we analyze such a remote event? The key, as discussed in this UCLA news release, is oxygen, which makes up 90 percent of the volume of lunar rocks the team of geochemists studied, and 50 percent of their weight. Usefully, oxygen can manifest itself in various isotopes, the most common on Earth being O-16, meaning each atom holds eight protons and eight neutrons.

Image: Light image of a lunar rock from the Apollo 17 mission. Credit: NASA.
Heavier isotopes like O-17 (with one extra neutron) and O-18 (with two) occur, though on Earth 99.9 percent of the oxygen is O-16. But each of the planetary bodies in our Solar System has a unique ratio of O-17 to O-18, making for a characteristic signature.
To analyze these ratios, the team studied seven moon rocks from Apollo missions 12, 15 and 17, while also working with five volcanic rocks from Hawaii and one from Arizona. Led by UCLA’s Edward Young, the team found no difference between the Earth’s oxygen isotopes and those of the Moon. This contradicts a 2014 study from Germany (also published in Science) that argued for a distinct ratio of oxygen isotopes on the Moon as opposed to the Earth.
Theia was probably a growing object that would have become a planet in its own right. It may have been as large as the Earth, though some believe it was closer in size to Mars. If the UCLA work is correct, the oxygen isotope data tell us that the collision would have been head-on, for if it had been a glancing blow, the great bulk of the Moon would have been made up of Theia, and would thus have shown different oxygen isotope ratios than the Earth’s. A head-on collision should have produced a similar chemical composition on both Earth and Moon.
“Theia was thoroughly mixed into both the Earth and the moon, and evenly dispersed between them,” Young said. “This explains why we don’t see a different signature of Theia in the moon versus the Earth.”
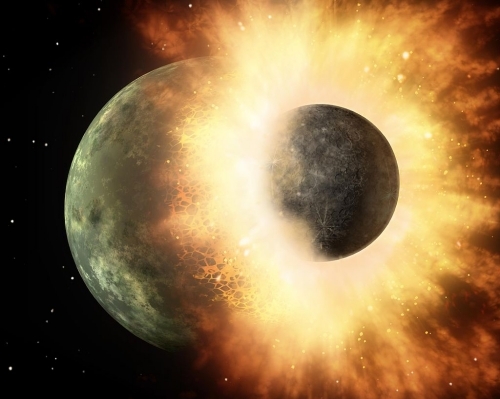
Image: Artist’s depiction of a collision between two planetary bodies. Such an impact between the Earth and a Mars-sized object likely formed the Moon. Credit: NASA/JPL-Caltech.
Thus a head-on collision, as theorized in 2012 by Matija Ćuk (SETI Institute) and Sarah Stewart (UC-Davis), and also by Robin Canup (SwRI) in the same year, now has more weight. The catastrophic impact’s possible role in removing any water found in the early Earth is not known, though water from small asteroid and comet impacts would eventually be plentifully available.
The paper is Young et al., “Oxygen isotopic evidence for vigorous mixing during the Moon-forming giant impact,” Science Vol. 351, Issue 6272 (2016), pp. 493-496 (abstract).


February 2, 2016
A Telescope Eight Times the Diameter of Earth
If you’re looking for detailed imagery of a distant astronomical object, VLBI (Very Long Baseline Interferometry) can deliver the goods. As witness the image below, which the National Radio Astronomy Observatory (NRAO) is calling “the highest resolution astronomical image ever made.” Here we see radio emission from a jet of particles moving close to the speed of light. The particles are being accelerated by a supermassive black hole at the core of the galaxy BL Lacertae, a highly variable ‘active galaxy’ some 900 million light years from the Earth.

Image (click to enlarge): Signals from 15 ground-based radio telescopes, combined with data from the RadioAstron orbiting satellite, produced the highest resolution astronomical image ever made. Credit: Gomez, et al., Bill Saxton, NRAO/AUI/NSF. Artwork by Jon Lomberg.
What fascinates me about this work is the technique. Very Long Baseline Interferometry works by collecting a signal at multiple radio telescopes, the distance between them being calculated from the different arrival times of the radio signal at the different installations. The calculations are made using a local atomic clock, with the data correlated with data from other antennae in the array to produce an image.
The upshot is that VLBI methods allow us to work with an emulated ‘telescope’ that has a size equal to the maximum separation between the constituent telescopes in the array. Conventional interferometry does much the same thing, but VLBI does not demand the physical coaxial cable or optical fiber connections of the former, allowing for greater distances between the telescopes.
In this case, we have fifteen ground-based radio telescopes combining their data with signals from the Spektr-R satellite of the RadioAstron mission, a Russian spacecraft with a 10-meter radio telescope. Launched in July of 2011, Spektr-R can work with large Earth-based radio telescopes to form interferometric baselines that extend up to 350,000 kilometers. In this case, working with radio telescopes in Europe and nine antennae from the Very Long Baseline Array in the US, the image produced was one with the resolving power of a telescope 100,000 kilometers wide, roughly eight times the diameter of the Earth. From the paper:
RadioAstron provides the first true full-polarization capabilities for space VLBI observations on baselines longer than the Earth’s diameter, opening the possibility to achieve unprecedentedly high angular resolution in astronomical imaging. In this paper we present the first polarimetric space VLBI observations at 22 GHz, obtained as part of our RadioAstron KSP [Key Science Program] designed to probe the innermost regions of AGN and their magnetic fields in the vicinity of the central black hole.

Image credit: Gomez, et al., A. Lobanov.
Above we see the jet from BL Lacertae fitted within a diagram of our local interstellar neighborhood. Notice that if we take the Oort Cloud as the outer perimeter of our Solar System, the jet just about fits within the system or, if we imagine one end of the jet at the outer edge of the Oort, the jet would extend almost to the Alpha Centauri stars. The detail we can see here is roughly equivalent to seeing a 50-cent coin on the Moon. The image elongation results from the greater resolving power in the direction of the satellite as compared to the ground telescopes, with resolution in the orthogonal direction being exaggerated to compensate for the effect.
As for BL Lacertae itself, it was originally thought to be a variable star within the Milky Way after its discovery in 1929, but was later identified as a bright radio source. Subsequent redshift measurements showed a recession velocity of 21,000 kilometers per second, implying a distance of 900 million light years. BL Lacertae is considered an AGN, or active galactic nucleus galaxy, the latter being a designation for a galaxy with a compact region at its center that has a much higher than normal luminosity over at least part of the electromagnetic spectrum.
The paper is Gómez et al., “Probing the innermost regions of AGN jets and their magnetic fields with RadioAstron. I. Imaging BL Lacertae at 21 microarcsecond resolution,” Astrophysical Journal Vol. 817, No. 2 (26 January 2016). Preprint available.


February 1, 2016
New Pluto Imagery
Newly interpreted data from the New Horizons spacecraft tells us that Pluto has more water ice on its surface than we once thought. The image below tells the tale, a false-color view derived from observations by the Ralph/Linear Etalon Imaging Spectral Array (LEISA) instrument. Here we’re at infrared wavelengths and can see areas showing the spectral signature of water ice. Note the sharp contrast between the left and right sides of the image below.
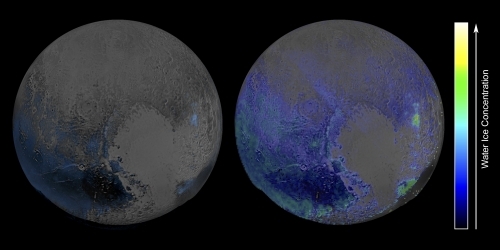
Image: This false-color image is derived from observations in infrared light by the Ralph/Linear Etalon Imaging Spectral Array (LEISA) instrument. It is based on two LEISA scans of Pluto obtained on July 14, 2015, from a range of about 108,000 kilometers. Credit: NASA/Johns Hopkins University Applied Physics Laboratory/Southwest Research Institute.
The two scans, as this JHU/APL news release explains, were taken about fifteen minutes apart and merged into a ‘data cube’ — a three-dimensional array covering the hemisphere New Horizons could see during the flyby last summer, where an image of Pluto is formed at each wavelength of light to which LEISA is sensitive. The map on the left was made by comparing LEISA spectra with a pure water ice template spectrum. When using this technique, methane ice can easily mask the spectral signature of water ice.
The result: A map sensitive only to those areas particularly rich in water or depleted in methane. On the right is an image that more fully models the various ices, showing the true extent of water ice. Interestingly, we still see little water ice in Sputnik Planum (left of Pluto’s ‘heart’) and Lowell Regio (far north on the encounter hemisphere). This would indicate that the ice ‘bedrock’ is buried beneath a thick blanket of ices like methane, nitrogen and carbon monoxide.
Infrared Views of Pluto’s Atmosphere
We’re also working with data from the LEISA instrument in the image below. Captured on July 14, 2015 at a distance of 180,000 kilometers, the image covers the full spectral range (1.25 to 2.5 microns) of the instrument. North in the image is at about the 10 o’clock position.
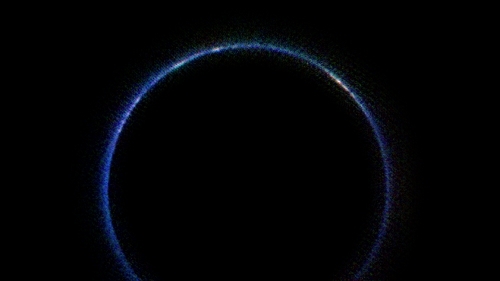
Image: This image from NASA’s New Horizons spacecraft is the first look at Pluto’s atmosphere in infrared wavelengths, and the first image of the atmosphere made with data from the New Horizons Ralph/Linear Etalon Imaging Spectral Array (LEISA) instrument. Credit: NASA/Johns Hopkins University Applied Physics Laboratory/Southwest Research Institute.
The blue ring we see in the image is the result of sunlight scattering off haze, as JHU/APL explains in this second news release:
…scientists believe the haze is a photochemical smog resulting from the action of sunlight on methane and other molecules, producing a complex mixture of hydrocarbons such as acetylene and ethylene. These hydrocarbons accumulate into small particles – a fraction of a micrometer in size – which scatter sunlight to make the blue haze.
Infrared images like these can be combined with images made at shorter wavelengths to help researchers understand the size distribution of the particles. The New Horizons team tells us that the white patches that show up around Pluto’s limb are where sunlight is bouncing off more reflective areas on Pluto’s surface. The largest of these would be the the area now being called Cthulhu Regio (the H.P. Lovecraft reference still delights me). We have much more data ahead from New Horizons, and can expect fuller views of the atmosphere in the course of the year.
A Change at the Top

I also want to note that New Horizons has a new project manager. Helene Winters takes over the role from Glen Fountain, who had been project manager since early 2004. Winters served as project manager for the Mini-RF lunar radar instrument, and most recently as project manager for the MESSENGER mission, which orbited Mercury for four years before a planned dive into Mercury’s surface last April. Winters will also continue as MESSENGER project manager through that mission’s closeout stages. Says principal investigator Alan Stern:
“Over the past 15 years New Horizons has had two of the finest project managers in the space business, the late Tom Coughlin, who helped conceive the mission, and the legendary Glen Fountain, who built New Horizons and flew us to Pluto. Helene Winters, from a new generation and with incredible experience behind her, is going to set new milestones flying the spacecraft farther, hopefully to the first ever flyby of a Kuiper Belt object and onward toward the edge of our planetary system!”
The outer system, as we’ve learned in recent days, is getting more and more interesting. As we look forward to the New Horizons KBO flyby in January of 2019, we should also keep pondering the kind of follow-up mission that New Horizons merits. We need observations of the local interstellar medium beyond the heliosphere and we also have a wide range of Kuiper Belt targets, not to mention the eventual goal of reaching the Sun’s gravity focus at 550 AU. Tune up the technologies to reach these distances and, if it’s really out there, we might just visit the hypothesized Planet Nine.


January 29, 2016
Starship Thinking
It’s been awhile since I’ve seen Ian Crawford (Birkbeck College, London) — I think we last talked at one of the 100 Year Starship events — but I’m pleased to see his latest popular essay How to build a starship – and why we should start thinking about it now. A professor of planetary sciences and advocate of manned space exploration here in the Solar System, Crawford takes on the necessary task of acquainting a larger audience with something Robert Forward put forth as a maxim: ‘Starflight is difficult and expensive, but not impossible.’
Following decades of work on beamed sail technologies, antimatter and space tethers, Forward wrote that line in 1996, but it summed up statements he had been making for decades. Gregory Matloff and Eugene Mallove would echo him in their Starflight Handbook (Wiley, 1989), with an emphasis on the ‘difficult’ aspect of the journey: “Starflight is not just very hard, it is very, very, very hard!” So I guess we could say starflight is hard3. Matloff, who knew Forward well, has never entertained any illusions about the magnitude of the task.
Neither has Ian Crawford, who wants to keep Forward’s injunction out there. If there were some aspect of known physics that would have to be contradicted to make star travel possible, we would look at the matter differently. But instead we find vast problems of engineering and the need to overcome huge distances with craft that can operate for decades and perhaps centuries, returning data at the end of the journey. Crawford’s work has always engaged me because of his inherent optimism, and here he makes the case that ongoing work in areas like nanotechnology may get us to at least small, robotic space probes sooner than we think.
Igniting the Effort

The driver for such an attempt, in my view, would be the discovery of a nearby world in the habitable zone of its star. But it would take more than its presence. We would also have to have data from future space missions (and the next generation of ground-based telescopes) that showed biosignatures in the planet’s atmosphere. If we could make a strong case for there being a living world around, say, a planet of Proxima Centauri, we would surely want to make closeup investigations to learn about how evolution has played out on such a world.
Crawford gives a nod to the five craft that are currently on track to leave our Solar System altogether — the two Pioneers, the two Voyagers, and New Horizons. All will fall silent long before they approach another star, though I have been trying to resurrect a Sagan idea from the early Voyager days that one or both craft could have their trajectories adjusted with a final, tank-emptying burn to make a stellar encounter more likely in tens of thousands of years. If this sounds quixotic, it’s meant to be. It would be a purely symbolic statement of what our species can do (and as for the more practical details, I’ll turn you to my essay Voyager to a Star).
Image: Professor Ian Crawford doing astrobiological fieldwork on the Kverkfjoll volcano, Iceland. Credit: Ian Crawford.
But actual scientific return is another matter. It will require not ‘new physics’ but an expansion of our existing capabilities into areas of long-lifetime instrumentation and advanced laser communications, not to mention propulsion technologies like beamed power, fusion or more exotic methods. We’ve investigated the latter in the pages of Centauri Dreams, and Crawford has written them up in a 2010 paper called “‘A Comment on ‘The Far Future of Exoplanet Direct Characterization’ – The case for Interstellar Space Probes” (citation below).
Over the years, scientists have worked out a number of propulsion designs that might be able to accelerate space vehicles to these velocities… While many of these designs would be difficult to construct today, as nanotechnology progresses and scientific payloads can be made ever smaller and lighter, the energies required to accelerate them to the required velocities will decrease.
So we can talk about nuclear possibilities. Here I lean much more strongly toward nuclear pulse methods (think Project Orion) than fusion, though it will be interesting to see what the Icarus Interstellar team comes up with as it continues to refine the 1970’s-era Project Daedalus starship, which itself was based on a still-unavailable method called inertial confinement fusion, as studied by Friedwardt Winterberg. Using the energy released by either splitting or fusing atomic nuclei has long been studied by interstellar theorists, as has the much more powerful annihilation of matter and antimatter, though this is plagued by production problems (we can’t produce remotely enough) and certainly by storage issues for large amounts of antimatter.
Everything from interstellar ramjets to beamed laser or microwave sails is in the database here. Of the latter, Crawford says this:
Spacecraft using “light-sails” pushed by lasers based in the solar system are also a possibility. However, for scientifically useful payloads this would probably require lasers concentrating more power than the current electrical generating capacity of the entire world. We would probably need to construct vast solar arrays in space to gather the necessary energy from the sun to power these lasers.
Absolutely so, making the construction of a space-based infrastructure here in the Solar System a prerequisite for sending our first true interstellar probes. As Crawford notes, we are talking about systems far too large and certainly too power-laden to contemplate launching from Earth. They’ll be constructed in space as an outgrowth of this infrastructure. “This means,” Crawford adds, “that interstellar space travel is only likely to become practical once humanity has become a spacefaring species.”
Incremental Growth into Space
So there is a path for development here that acknowledges our current inability to send craft with data return capability to nearby stars, and addresses the problem by moving step by step to gradually acquire the needed expertise. This takes us to the Moon and Mars and beyond:
We need to progressively move on from the International Space Station to building outposts and colonies on the Moon and Mars (as already envisaged in the Global Exploration Roadmap). We then need to begin mining asteroids for raw materials. Then, perhaps sometime in the middle of the 22nd century, we may be prepared for the great leap across interstellar space and reap the scientific and cultural rewards that will result.

Image: To make the first interstellar mission a reality, we’ll need to move step by step from current space technologies toward a true infrastructure moving well beyond Earth orbit. Credit: NASA.
Crawford’s is a vision that places interstellar efforts into a broad context, one that will have to build the necessary levels of public support, and of course it will also have to show short-term value by way of scientific return and, in the case of asteroid mining, the necessary raw materials for growing the infrastructure. I think the middle of the 22nd Century is a highly optimistic goal, but it’s one worth working toward, and we can’t know what kind of breakthroughs may occur along the way (again, my money is on nanotech) to make the process quicker and more effective. Star travel may be hard3, but what else would we expect when it comes to translating a great imaginative venture into a mission that will someday fly?
Ian Crawford’s paper on interstellar propulsion technologies is “A Comment on “The Far Future of Exoplanet Direct Characterization”—The Case for Interstellar Space Probes,” Astrobiology 10(8) (November, 2010), pp. 853-856 (abstract).


January 28, 2016
Bradley Schaefer: A Response to Michael Hippke
The question of a gradual dimming of KIC 8462852 continues to make waves, the most recent response being Michael Hippke’s preprint on the arXiv site, discussed in the post immediately below. Bradley Schaefer (Lousiana State University), who published his work on the dimming he found in now digitized photographs in the archives of Harvard College Observatory, disagrees strongly with Hippke’s findings and is concerned that the paper impugns the solid work being performed by DASCH (Digital Access to a Sky Century@Harvard). Below is Dr. Schaefer’s response with details on the astrophotographic photometry at the heart of the issue.
by Bradley E. Schaefer

A few hours ago, Michael Hippke posted a manuscript to arXiv (http://arxiv.org/abs/1601.07314), and submitted the same manuscript to the Astrophysical Journal Letters (ApJLett). This manuscript claims to have found that the DASCH data produces light curves with secular trends (both systematic dimmings and brightenings) over the century-long records. This same DASCH data (from the collection of archival sky photographs now at Harvard Observatory) was used to recognize a dimming of KIC 8462852 (a.k.a. ‘Tabby’s Star’ or the ‘WTF star’) at an average rate of 0.165±0.013 magnitudes per century from 1890 to 1989.
This dimming from the DASCH data is just a long-time scale version of the dimming also seen with the Kepler spacecraft, and these dimmings are still a high mystery and a perplexing problem. Hippke is taking his claimed result (that the majority of DASCH light curves have major and widespread calibration errors resulting in apparent secular trends) as then implying that KIC 8462852 does not have any secular trend. This claim is easily proved wrong.
Hippke made two major errors, both of which are beginner’s mistakes, and both of which will erroneously produce apparent dimmings and brightenings when none exist. First, Hippke explicitly includes red-sensitive and yellow-sensitive photographs together with the blue-sensitive photographs. The different colors will produce systematically different brightnesses (magnitudes). The trouble is further that the red and yellow photographs are predominantly at late times in the century-long light curve (in the 1970s and 1980s), so the inclusion of many magnitudes that are systematically high or low only at the end of the century will artificially make the star appear to brighten or dim over the century.
Second, Hippke explicitly includes magnitudes from photographs with known and recognized defects. The Harvard photographs are not perfect, with some having long-trailed images, some being double exposures with stars overlapping, and some having various plate defects where the emulsion is nicked or such. The DASCH scanning and software has a robust means of identifying problem photographs, and these are objective measures independent of the magnitude. These known-poor-quality magnitudes should not be used for any sensitive purposes. Colloquially put, these are ‘garbage’. Hippke keeps all the many good DASCH magnitudes and he also adds in the garbage magnitudes, so his final light curves have many points that are systematically skewed.
The frequency of the poor-quality magnitudes varies over time, usually with more early-on during the century. And the erroneous magnitudes are variously systematically brighter or dimmer, also varying over the century. The result of Hippke’s good+garbage light curves is that the garbage points tilt the light curve by a bit. This is seen when I take all of Hippke’s same stars and data and go from his sloped light curves (including his garbage points) to flat light curves (with only the good points). The bottom line is that Hippke’s second big mistake was to include the poor-quality photographs. Garbage-in, garbage-out.
So we understand why Hippke’s secular trends are wrong. But we already knew this very well anyway. The reason is that the DASCH people have already measured many (likely up around the millions) of light curves for single main sequence stars (i.e., stars that really should be perfectly constant) and found that their light curves are actually very flat. This is in stunning contradiction to the claims of Hippke that the majority show big secular trends.
Hippke’s paper has a title of “KIC 8462852 Did Likely Not Fade During the Last 100 Years”, yet his paper never discusses or analyses any data from KIC 8462852. One reason is perhaps that he cannot get around the flatness of the five check star light curves. That is, these five stars always appear within 3 millimeters of Tabby’s Star on these 10″x8″ phootgraphs, these stars are all of similar brightness as Tabby’s Star, and they all have similar color as Tabby’s Star.
If there were any systematic problems for the DASCH data with Tabby’s star, then we should see the exact same dimming trend in the check stars as is seen for Tabby’s Star. But we do not. These ‘check stars’ serve as the classic control study in science. They serve as proof that neither the check stars nor Tabby’s Star have any substantial systematic problem. They serve as proof that Hippke’s title is wrong.
Hippke submitted his draft manuscript to ApJLett, to arXiv and to reporters even before he had any checks with experts on archival sky photographs. For example, I first read his email just about the time that he was submitting his manuscript. He did not contact any of the DASCH people, despite them being the target of his attack. Indeed, he has not talked with anyone who has any experience with or knowledge of any archival photographs. This topic has a lot of detail and many quirks, but Hippke apparently did not have the realization or the will to check out his claims. And, in an email from Hippke from early this morning, he explicitly labelled himself as “a novice” for this technical topic. So he is a novice working without bothering to check with anyone knowledgeable. As such, it is not surprising that he made beginner’s blunders.
A broader problem is now that DASCH has the publicly-stated claim that it has major, widespread, persistent calibration and measurement errors. In knowledeable circles, Hippke’s paper won’t come to anything. But these circles are not large, because few people really understand the working of DASCH or plate photometry.
So most people will simply look at the paper’s conclusions, not recognize the horrible beginner’s blunders that create the false conclusion, and only come away thinking that the DASCH light curves are “wrong” or at least “questionable”. Public perceptions do matter for many aspects. Most important for DASCH is their future success rate in funding proposals, the reception of all future papers relating to DASCH, and the future useage of the DASCH data.
Perhaps from a journalistic point of view, any ‘stirring of the pot’ is good copy. But from the point of view of science and knowledge, putting up unchecked and false claims is bad all the way around. Science has a great strength of being error-correcting, with the normal procedure now for the DASCH people to put out a full formal refutation of Hippke’s claims, and such will appear in many months. But with the one-day turn-around of arXiv and with fast journalist response, there will be many months where the reputation of DASCH is maligned. So Hippke’s choice of running to reporters before the paper appeared publicly, and disdaining any experienced advice despite being a self-proclaimed “novice”, is not good science.


Paul Gilster's Blog

- Paul Gilster's profile
- 7 followers

