
Tim Matthews's Blog, page 4
March 1, 2017
The Importance of Matching Demand Generation with Sales Capacity
Estimated Reading Time: 4 minutes
 When it comes to leads, most people assume more is better. That’s not always true. Sometimes you have more than your sales team can actually handle, in which case your leads go cold. The flip side—when you have more sales capacity than lead flow—is equally bad. This is why it’s so important to balance demand generation with sales capacity. Let’s take a closer look.
Establishing Your Quarterly Demand Goals
First off, you need to establish your desired lead flow. I like to model mine to be even throughout the quarter. The ideal flow is to add the exact same number of leads per week, summing up to the total you need for the quarter. You can see this represented by the straight diagonal line (“Target” in light green) from week one through week 13 in Figure 1 below. No one is that good, so you should aim to hug that diagonal target line as closely as possible. A little under and a little over are okay.
In this example, we did pretty well. We were a little light at the beginning of the quarter in weeks one to five, then a little over in weeks eight through eleven, and ended up at 105% attainment, shown in purple text.
Figure 1: Quarterly demand-generation attainment graph
Why is an even flow important? Well, if you have no demand in a given week, your salespeople have nothing to do—in other words, more capacity than leads. On the other hand, if you spike demand—say, by exhibiting at a large event—your salespeople are flooded with leads they can’t necessarily handle. To prevent this, anticipate spikes and dial down other programs to compensate. Alternatively, have your lead qualification team take a first pass on these leads. That way the leads don’t go cold; you just pass a smaller number of better-qualified leads to the sales team.
I started using the graph above in my weekly demand-generation review meetings with sales management to illustrate how we’re doing for the quarter. In addition, it shows how we’re doing in terms of having the right demand flow for the sales team.
The Per-Rep Demand Model
One mistake demand marketers make is to use company new revenue as their target. But you need to figure our how much demand you need for the reps. Here’s why.
Sales leaders assign quota assuming that some reps will not make it. In other words, they hedge. If you add up all the rep quotas, the total will be more than the company revenue target. This means you actually need a higher number of leads to generate that higher amount of quota new revenue. If you don’t do this, then all of your reps will have fewer leads than they need, and you will be affecting the good reps along with the underperformers.
Let’s say that a rep’s quota is $1 million for the year. That means every quarter the company needs $250,000 in closed deals for that rep to hit 100% of his or her quota. Let’s assume a rep closes one out of every four opportunities—a 25% conversion rate. I divide $250,000 by .25 to get my pipeline requirement, which is $1 million per quarter. If our average deal size is $50,000, that’s 20 opportunities. I know that one in five leads converts to an opportunity, a 20% conversion rate. Thus, I divide 20 opportunities by .2, which is 100 leads per quarter. That’s our per-rep model. Multiplied by my total number of reps is my total number of leads per quarter.
A quick way to hedge is to have 125% of quota coverage to compensate for only 80% of reps hitting their target. Here’s how the math works. Say your company’s revenue target is $10 million. Quota is set at $12.5 million. Eighty percent of $12.5 is $10 million. You are now covered if 20% of the reps have zero attainment, which is possible if you have long sales cycles, but not likely. You’ll have upside if those reps come close to quota or the other 80% of reps overachieve.
One other important aspect of per-rep modeling is geographic distribution of your leads. I’ve had quarters in the past where we had more than enough leads per rep, but they were not evenly distributed around the world. Reps in certain territories had too few leads to work. We had to create programs just for those territories on top of what we were already running.
Hiring New Reps and Annual Planning
One of the problems I’ve experienced running demand-generation teams is the sudden addition of sales capacity. When does has happen? Usually at the start of a new fiscal year. When a company does well the previous year, a head of sales typically wants to add more salespeople to take advantage of the momentum. This may sound like common sense, but it comes with a potential problem. What if your sales capacity outstrips your demand?
Let’s say your head of sales wants to add five new reps to our ten-person sales team. For simplicity of the example, we’ll assume that we ramp right away and are ready to start selling. That means that you suddenly have 50% more sales capacity than in the previous year. What if your demand only grows 20% a quarter? (This, by the way, would compound to 100% a year.) You’re going to have one to two quarters where you have more demand than the previous year, but with a lot more reps, and therefore each rep will have fewer leads. This causes existing reps to become dissatisfied, and new reps not having enough leads to hit their quotas.
To solve this, sit down with your head of sales in the quarter before the new year and plan the hiring so it phases in according to your demand plan. Hopefully, what you can do is more or less align your demand growth and your sales-capacity growth so they’re about even.
David Skok from Matrix
Partners takes it a step further, believing that in addition to leads, a sales person needs to have full supporting staff resources to be effective. As he put it succinctly in an email to me:
Hiring more sales people without creating more leads for them results
in a very expensive unproductive resource. The planning unit that I
recommend companies use when modeling their business going forward is a
salesperson. They have to consider the marketing investment needed to
generate the right amount of leads to support that salesperson, as well
as the investments in customer success, onboarding, renewals, and other
resources required to support the customers that are signed up by the
salesperson.
Here’s an easy way to visualize the concept from a presentation David gave at the 2017 SaaStr conference.
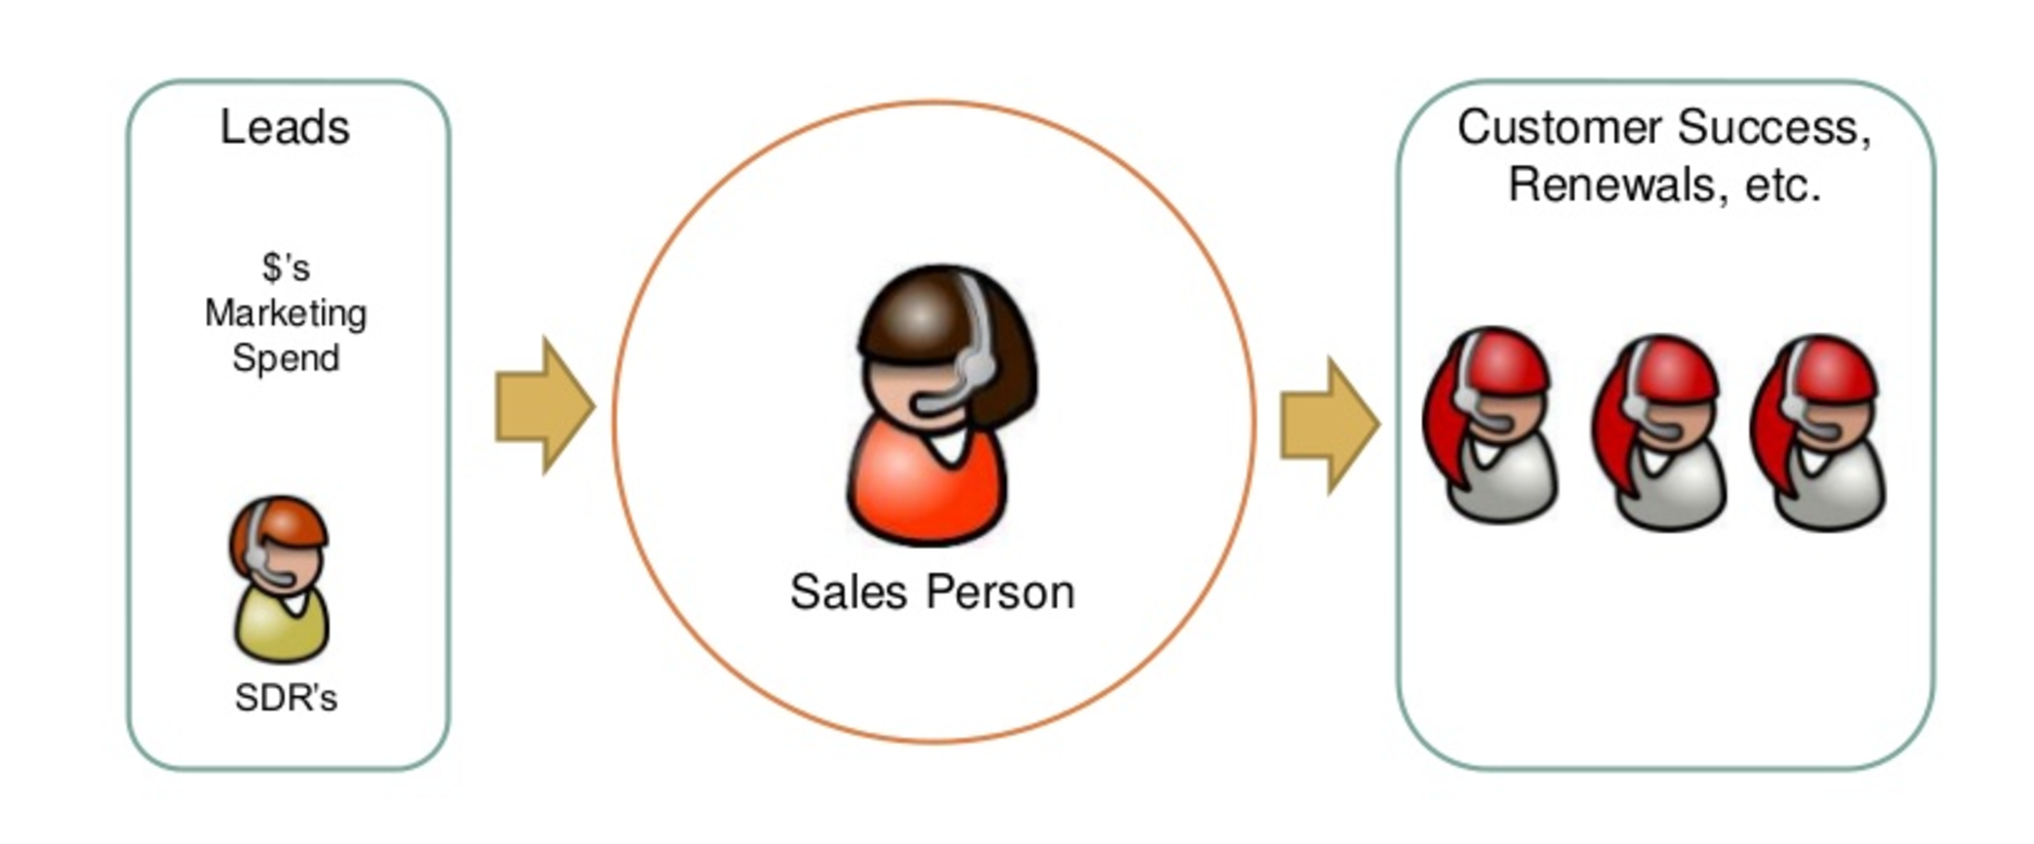
Figure 2: A sales person needs leads, sales development reps (SDRs),
and renewal reps to be effective. (Courtesy of David Skok)
At the beginning of a new year, make sure you’re aligned with your head of sales so you’re not going to set yourself up for failure by having too many reps with not enough to do.
The name of the game in demand generation is matching the capacity of your sales team with the volume of leads from your demand generation. Having a mismatch either way—too many leads or too few leads—can result in either missed opportunities or dissatisfied sales people.
The post The Importance of Matching Demand Generation with Sales Capacity appeared first on Matthews on Marketing.


February 14, 2017
Content Marketing Economics – Part II: Consumption and Profitability
Estimated Reading Time: 5 minutes
 In the first part of this post, we discussed the production and distribution of content. Here, we’ll going to dig into how people consume your content, the desired outcomes of that consumption, and whether what it costs you is generating a profitable return.
How does consumption relate to production and distribution? It can be represented by this simple equation:
Consumption = Production * Distribution
The better the quality of the content – the production – multiplied by a larger or more targeted channel – the distribution – the greater the consumption.
Obviously, the value of consumption needs to be greater than the cost of production and distribution. To help get to that level, let’s start by putting a value on consumption.
Valuing Consumption
Remember, we’re thinking like economists here, so that’s how we’ll frame things. Ask yourself these three questions about consumption. What are you after? What are you paying for? and What is the value?
What are you after?
Ultimately, you are trying to convince someone to buy your product, but you may be early in the buyer journey – at the very top of the funnel, if you prefer to think of it that way. You are paying for outcomes, which are not necessarily purchases of your product.
Here are three outcomes marketers typically seek:
Awareness – Introducing a product or brand to a consumer to increase his or her predisposition to buy. Most advertising and PR is aimed here.
List building – Growing the number of people in a database, so you can later market to them. Any form that captures an email address, such as a blog subscription form, fits this category. Fun fact: Did you know product warranty cards are aimed at list building, since the manufacturers lose their direct connection with the consumer once their product is sold through distribution?
Lead conversion – Converting either a new prospect or someone in your database into someone ready to buy.
What are you paying for?
To achieve the three outcomes above, there are six basic actions that a potential customer can take. Each of these actions is paid for.
Views – Awareness
Shares – Awareness
Clicks – Awareness (via future online retargeting)
Subscribes – List building
Form fills – List building or lead conversion
Contact sales – Lead conversion
You can buy views in a number of ways. One of the most common is buying display ads. Shares are an organic activity, so what you are really paying for is great content that cries out to be shared. Clicks are not really worth much on their own, though many marketers report on them. What really matters is what you do with the click. To me, the value is in the fact that the user has now been tagged with an ad-retargeting pixel. Subscribes and form fills are not actions you can buy directly, but rather something you earn with good content or a great offer. Sales contact requests are really the cumulative costs it takes someone to be ready to buy.
What is the value?
How do you value these actions? Alas, I can’t give you absolute numbers, but I can describe how to derive their value. It varies by company, and possibly by product line if you have more than one.
To begin valuing different actions, we’ll think about four stages of a lead: pre-funnel, top of funnel, mid-funnel, and bottom funnel. Pre-funnel is the stage when someone is either unaware of or not engaged with your brand or product. Top of funnel is when they express some initial interest, or are considering a potential purchase.
Moving down, mid-funnel is when they are seriously considering a purchase and probably doing some research or comparing prices. Bottom funnel is when they are engaged with your sales team or online store. The time spent in each stage of the funnel will vary. Generally speaking, the more expensive a product, the more time spent in each stage. You spend more time shopping for a car than deciding on which drink to pick out of the cooler in the convenience store, for example.
Why is the funnel stage important? Because buying is a journey and can be thought of as a funnel. You have lots of people in a market (pre-funnel) and many who are potential buyers (top of funnel). The number is winnowed in each phase of the process, until you end up with a certain number of customers. When considering your costs, you may need to think about content costs for each stage. Hopefully, as they enter the final two stages, these customers are in your database, so your distribution costs drop or become essentially free.
Assigning a specific value may be difficult if you are just starting out with your demand-generation efforts or have not been measuring all aspects of your funnel. Measuring awareness is hard at any stage, though display advertising costs and conversions can be tracked. This is how I look at measuring each action.
Action
What to Measure
Views
The number of people who see your ad or content
Shares
The number of people who share your content
Clicks
The percent of clickers who later convert via ad retargeting
Subscribes
The percent of subscribers who later fill out forms or contact sales
Form fills
Your known lead conversion rate from forms
Contact sales
Your known lead conversion rate from sales contact forms
If you have a mature funnel, and you have been measuring, you can plug in values for each action. Let’s assume we have a product that sells for $1000. Let’s also assume some conversion rates. Think of views and shares as pre-funnel, and the subsequent rows moving down the funnel. The closer we are to the bottom, the higher the conversion rate.
Action
Conversion Rate
Average
Value
Views
0.1%
$1
Shares
0.1%
$1
Clicks
1%
$10
Subscribes
5%
$50
Form fills
10%
$100
Contact sales
25%
$250
These are average values, since some leads never convert. For example, if 1 out of 100 leads converts (1%), and our sales price is $1000, the actual value of 99 of your leads is zero, but the average value of each one is $10 ($1000 * 1%). So, each click above is worth $10. You can do the math for the other actions.
Again, these are just example values; you will have to come up with your own. How do you do that? If you are already tracking everything, you know the value of a lead (subscribes, form fills, contact sales). Likewise, you probably know the value of a click from your PPC or paid social activities, as this is the step before conversion. Views and shares will be very low, typically, and something you can really only measure by doing it. To get started, pick a number much lower than your click conversion rate, at least by a factor of ten.
So, now that we know the value of each action, it’s time to think about whether we are making or losing money – our profitability.
Profitability
Deriving the overall profitability is straightforward. It’s nothing more than an ROI equation.
Value of Actions – Cost of Production – Cost of Distribution
__________________________________________
Cost of Production + Cost of Distribution
Let’s use the example from above. Each click is worth $10 to us, and we get 1500 of them. (You need to calculate this on aggregate, typically, as the cost of production is a one-time expense amortized over the lifetime of the piece.) We paid a writer $2500, and a designer $1000, to create an ebook for our product. Then, we spent $1500 on Twitter promoting the ebook to our audience.
$15,000 – ($2500 + $1000) – $1500
__________________________
($2500 + $1000) + $1500
This reduces to
$10,000
______ = 200%
$5000
When you are really good, you will add up all costs of actions during an entire buyer journey. For example, the initial display ad or content that let you drop a retargeting pixel, plus the cost of the retargeting, and maybe the production cost of the report that caused them finally to ask to speak to a sales person.
Now you have a framework to use when planning your content marketing strategy. By understanding the cost of production and distribution, weighted against the value of specific actions, you can remove subjectivity from the process and base your investments on their profitability.
The post Content Marketing Economics – Part II: Consumption and Profitability appeared first on Matthews on Marketing.
January 11, 2017
Content Marketing Economics – Part I: Production and Distribution
Estimated Reading Time: 3 minutes
 English majors certainly have a leg up in the content marketing world, what with their trove of literary references and practiced writing flow. But what about Econ majors? It struck me recently that there’s an important contribution that knowledge of economics could make to help your content marketing execution.
Economics is the study of the production, distribution, and consumption of goods and services. Content marketing fits neatly into this context. It’s not about amassing a stockpile of assets but rather creating a system of production and distribution that gets the job done at the right price.
We’ll take a look at content marketing through an economist’s lens, first covering production and distribution, and then moving on to consumption and profitability. Of course, when you create content, you need to begin with the ultimate consumer in mind, but I think it’s a worthwhile exercise to consider how you can reach your audience before getting too concerned with measuring the outcome.
Production
You can spend a lot on content, or you can spend almost nothing. For ease of comparison, we’ll assume that your content marketing team’s salaries constitute a fixed cost and focus on the variable cost of paying writers, graphic artists, or analysts to produce various assets.
Let’s look at three typical assets you might produce: a blog post, a nice infographic, and an in-depth survey. Hiring a freelancer to write a short blog post costs in the neighborhood of $500. A professionally done infographic can set you back $5,000. Hiring a specialist research firm to write and conduct a survey, including paying for the research panel, can easily cost $50,000. I’m using round numbers that are in the ballpark of what I have seen available on the market to make the math easy for all you English majors. You can certainly pay less or more.
Here we have three different potential assets, each an order of magnitude different in price. How do you decide where to spend your money? You could have ten blogs for each infographic and a hundred for each study!
Obviously, if you are budget constrained, you stick to blogging. But if you have $10,000, how should you spend it? It’s actually too early to answer that question, because you have not taken the cost of distribution into account. Sure, you can post it on your blog, but do you have the audience? Unless you can get it viewed widely via organic means, you will need to pay to promote it.
You should also factor in—as we’ll discuss in the second part of this post—what you can ask in return for access. For a post on your own site, you get retargeting for free, and you can begin to show readers display ads via Google AdWords or AdRoll. With a well done pop-up, you can convert a fraction of new visitors to blog subscribers. A more valuable approach, like an in-depth study based on survey results, will yield a higher number of more valuable conversions that contain name, email, and perhaps other valuable details.
Ultimately, determining how to spend that $10,000 comes down to consumption. For example, you may be able to drive the traffic you need with blog posts, but only a survey report with hard-to-get information will convince someone to give you their details. Or maybe you are in a very crowded market, with lots of bloggers posting on topics you want to own. A spiffy infographic with a unique angle might stand out.
Once you have a sense of what you want to produce, it’s time to consider what type of distribution you will need and what it will cost.
Distribution
Distribution is the movement of goods from the source through the channel to the ultimate consumer. These days, thanks largely to social media, there are all kinds of inexpensive distribution channels through which you can deliver your content to customers. Which is the right one to use?
There are three considerations: cost, reach, and ownership.
Cost is a straightforward component. Going organic via your blog, Twitter feed, or Facebook account are essentially free. You can also pay to use some of those channels. So-called paid social, such as promoted tweets, costs money per conversion. Content syndication through a service like Madison Logic, Outbrain, Taboola, or TechTarget can be just as expensive for lower quality traffic. Just like physical goods, you have production costs and distribution costs.
Next is reach. You may not be able to get in front of the customers you want. That’s why Google, Twitter, LinkedIn, and others will sell you audiences. You may not have the ability to reach every pet food tester in North America for your new halitosis treatment. So you will need to pay. Content syndicators sell you access to the demographic you want to read your content. Building your own audience organically takes time you might not have.
Last is ownership. I work in the software business, and at every company I’ve worked, there’s been a tension between taking advantage of the reach of distribution and sacrificing direct access to the customer. Building your own database is always preferable, but it can take years. So you will likely need some paid distribution as you build your list.
Next up, consumption and profitability. We’ll take a look at what your conversion goals are, how much it costs per conversion, and what it’s really worth. You won’t always have these numbers to work with when you start, so you may need to make some assumptions about production and distribution when you start out.
The post Content Marketing Economics – Part I: Production and Distribution appeared first on Matthews on Marketing.
December 22, 2016
Burn Pixels, Marketing Math, Classic Texts: Most Popular Posts of 2016
Estimated Reading Time: 1 minute
I’ve covered quite a bit of ground these past twelve months. Here are five of my most popular posts — durable lessons on marketing math, spending your budget wisely, building an LDR/SDR team, email marketing, and a little marketing lingo. Enjoy.
 Three Math Tricks Every SaaS CMO Should Know
Time was when you just needed to be an idea guy to be a great CMO. When it came to academic strong suits, English was desirable, and maybe Art if you were really good. But marketing has changed. Numbers are much more important than words or pictures. To be a great CMO, you need to be great at math, too. This shift to numbers is even more pronounced when it comes to running marketing at subscription businesses like SaaS. Read more.
 Marketingspeak – What’s a Burn Pixel?
I’d heard of pixels being fired, but never burned. The term burn pixel was a new one on me. Read more.
 Three Classic Books for Email Marketers
Anyone who practices email marketing knows that there are days when you just can’t quite think of what to write. Or can’t bring yourself to write yet another variation on the same subject line. Days when you wonder why, after all the effort, your emails are just not converting. I’d like to recommend three great books that I am sure will help. Read more.
 A Step by Step Guide to Building an LDR or SDR Team – Part 1 – Strategy and Structure
Sales Development Reps (SDRs) and Lead Development Reps (SDRs) are not new. But they are a hot topic right now, especially in the SaaS and Cloud marketing circles I frequent. With all the buzz, I’m surprised how few people truly understand proper strategy and structure for these roles. Quite often, these teams underperform because the up-front thinking has not been done. Read more.

Market Like You Are an Investor – Why Changing Your Mindset Will Rocket Your Career
Thinking and acting like an investor will not only solve your communications issues, but it will make you into a better businessperson. Moving away from a narrow minded focus on marketing stats to a broader view of how marketing contributes to the bottom line is a much more useful and objective viewpoint. Ready to start? Read more.
Liked another post of mine better? Let me know.
The post Burn Pixels, Marketing Math, Classic Texts: Most Popular Posts of 2016 appeared first on Matthews on Marketing.
December 12, 2016
Teaching an Old Dog New Tricks: How to Transform into a SaaS Marketer
Estimated Reading Time: 3 minutes
 Even an old dog can learn a new trick.
Can marketers change? Are we nonmillennials doomed to fade from the scene, our old ways weighing us down like a boat anchor? While it may be true that a leopard can’t change its spots, I don’t think it’s true that old-hand marketers are immutable. Old salts, perhaps, but not old dogs. Anyone can change course and become a successful SaaS marketer.
I know this, because I made the switch. After a good ten years of marketing enterprise software, I had to change my stripes. I was happily marketing a portfolio of on-premise software products when, thanks to an acquisition, my portfolio grew to include two SaaS products. It was OJT time. I had to learn the difference between marketing software with a perpetual license model and marketing software with an annual subscription license model.
Looking back, it was not all smooth sailing. There were four key changes I had to make in my approach to the job. I’ve listed them below in the order they became evident to me. Hopefully, this list will help you old salts out there set a new tack.
Mindset – if you are going to change your marketing ways, having an open mind is essential. Easy to say, but harder in practice. When do you rely on your years of marketing nous, and when do you decide that it’s dated or even irrelevant? Being a life learner is, I think, the most important thing. I’ve learned volumes since making the switch to being a SaaS marketer, and I have loved every minute of it. For example, I now think of our blog not as a corporate newsletter (a hodgepodge of items we want to communicate) but rather as a key means to grow web traffic by appealing to the specific needs of our target buyer. Of course, I’m not afraid to call someone out if I think the emperor is not wearing any clothes, as I’ve done before on growth hacking gone overboard and startups who claim they do no marketing. SaaS has not changed everything in marketing.
Skills – in my estimation, the biggest difference with SaaS is that numbers become even more important. SaaS companies live or die by metrics (as we’ll discuss below), so you have got to be adept with numbers. No more faking your way through; you have got to prove things. Take, for example, the trial signup page on your website (a genetic marker of SaaS applications). Your signup page is both the first place someone experiences your application and the first step toward closing the deal. The marketing team needs to be on top of conversion rate and abandonment rate on a cohort basis (see below) and must report out to the rest of the organization. Related to math skills are development skills (you are building the front door to your SaaS application) and a scientist’s bent toward experimentation (conversion rate optimization is a series of hypotheses proven or disproven by experiments).
Tactics – depending on your product, you may never meet the people who sign up to use your SaaS application. Quite a change from manning a trade show booth or putting on a seminar. So you need to emphasize tactics like search engine optimization (SEO) and conversion rate optimization (CRO). As I like to say, every SaaS sale starts with a Google search. Your buyer’s journey is quite different, so your marketing mix is going to be different. Said another way, your focus will be more on inbound marketing rather than on the conventional outbound marketing techniques.
Metrics – I have come to love metrics. I wish I had learned the importance of metrics first in my conversion to a SaaS marketer. I recommend you do. As I said, SaaS companies live and die by metrics. The first three you need to learn are churn rate, CAC ratio and cohort analysis. David Skok, whose For Entrepreneurs blog helped me climb the learning curve, has an in-depth guide to SaaS metrics. I highly recommend it. If you don’t love metrics and your math skills are limited, you may have a hard time making the switch.
 Your churn rate can make a big difference in how long you keep customers.
Remember: It’s still marketing. Not everything you know has gone out the window. Many of the tactics are the same, but you need to split from the dying “marcom faction” that ruled in days gone by. That style of marketing just won’t get it done anymore.
So turn over a new leaf. SaaS is here to stay. I’m personally addicted to recurring revenue. I think you will be, too.
If you are ready to start your education, take a look at The SaaS Marketing Handbook, written by yours truly.
The post Teaching an Old Dog New Tricks: How to Transform into a SaaS Marketer appeared first on Matthews on Marketing.
November 1, 2016
How to Prioritize Marketing Investments Using the Demand Maturity Matrix
Estimated Reading Time: 3 minutes
 Explaining how you are spending your marketing dollars is a challenge that all heads of marketing face. Cynics in your company are always happy to point out a failed program, which tars all your demand efforts with the same brush. What to do? Counterintuitive as it may seem, start by pointing out your failures. Here’s how.
Many marketing teams make the mistake of lumping all of their demand generation programs together. So all people hear about is the total number of leads delivered to sales. But when you do this, one bad program taints all leads. Stop letting that happen. Instead, use what I call the “Demand Maturity Matrix” to present a structured view of your demand generation efforts.
The matrix is useful in communicating to other teams as well as within your own. Prioritizing your demand generation efforts in this way is helpful in communicating to your CEO or your board. The matrix demonstrates you have a plan and a disciplined approach to marketing investment. By pointing out programs that have failed, you remove that dart from the cynic’s blowgun. Failed programs are just a matter of course.
Your marketing team will also benefit. Conversations within your team will become more objective. I’ve also found this approach encourages creativity by allowing the introduction of new ideas in a metered fashion while not taking too much budget away from programs that are working. Having a category for failed efforts tells your team that it’s okay to fail—it’s expected, really—and you can conduct constructive post mortems on things that didn’t work.
Here are my five categories of demand generation programs in the Demand Maturity Matrix. I suggest you use these five, but adjust the thresholds according to your business or budget.
Moneymakers: These are your mature programs with a known ROI. You can tell your CEO how much pipeline one dollar of investment will yield. Arguably, you could stick only to these programs if there is enough headroom to get you all of the leads you need.
Emerging: These programs are showing a positive ROI, but maybe not quite as much as your guaranteed moneymakers. Perhaps they are not optimized or have not had enough time to yield. You should use your judgment on how long to run them until they either graduate to become Moneymakers or are retired.
Experimental: Marketing teams should always be innovating—or copying programs they have seen elsewhere (no sin in this, as it says in one of my fave books to flip through, Steal Like an Artist). Allocate small budgets to these until you can tell whether they are moving up or out. This categorization is also really effective with budget gatekeepers. Just show them that you’re allocating a small amount for an experiment that could get big. If you have an example of an experiment that made it all the way to the Moneymakers stage, even better. “You wouldn’t want your parsimony over a $5000 purchase order to stand in the way of a big payoff, would ya, boss?”
Bullpen: For those few humans who have never watched a baseball game, the bullpen is where relief pitchers warm up. Put your ideas for experiments here until you have time to work on them.
Retired: Not all programs work. Put your failed Experimental and Emerging programs here. I find this effective in demonstrating one’s fiduciary responsibility to one’s superiors. You are not a wanton spendthrift. You pull the plug on stuff that does not work.
Importantly, programs can only move up or move all the way down to Retired. You can’t cheat by simply knocking a program down one level. Cut the ballast and move on.
Here’s an example of how you might display the matrix. I’ve made these numbers up; I’m not going to telegraph my marketing mix. Plus, they really vary by company.
[image error] The Demand Maturity Matrix – track your successes and your failures plus your up-and-comers.
The table above is pretty straightforward to read. I’ve intentionally left out CPL and conversion rates for this “executive summary” version. It’s pretty easy for a CEO to look at this table and understand the yield on marketing investment per program. The emerging paid social program is ROI positive but not at the level of the Google AdWords program. The comments field shows what is being done to improve its performance, or the impetus for planned experiments. For the partner webcasts experiment—which was inspired when someone noticed higher registration when a system integrator partner spoke on a webcast—I’ve included an estimate, which should serve as a target for the experiment.
You can create a more robust version of the matrix for your team. In that I would include not only the CPL and conversion rates but the quarterly lead counts per program.
Organize your demand generation programs into these five categories, and you will find it easier to ask for more money and still have room for creativity. Give your successes, crazy ideas and failures equal billing, and watch your demand soar.
The post How to Prioritize Marketing Investments Using the Demand Maturity Matrix appeared first on Matthews on Marketing.
October 3, 2016
Four Mistakes (Bad) Presenters Make
Estimated Reading Time: 2 minutes
 Bad presenters bore audiences.
I was at a conference in San Francisco last week. It was at the of the moment event space known as The Village. A massive video screen – hundreds of feet wide and nearly floor to ceiling – covers the entire back wall, adding to the feel of electricity. The setting demands dramatic presentations.
Then came the first presenter. And the second. And the third. In the span of just two hours, I saw three smart people make all four of the mistakes I’m going to cover below. And the gaffes just killed the energy. I’m not going to name names. Truth be told, I could probably find these same errors if I went to a conference every day. But if you care to be a presenter that the audience admires and roots for, read on.
There are plenty of great books on how to be a great presenter. You won’t become one in just the three minutes it takes to read this post. What I can do in those minutes is move you out of the basement of bad presenters. Just don’t do these four things and you will be on your way.
Reintroducing Yourself – “Please join me in welcoming Jack Smith, head of R&D from Acme Widgets” [applause] [Jack takes the stage] “Hi, I’m Jack Smith, head of R&D from Acme Widgets.” Really? You have nothing else to add? You need to engage the audience right away.
Garr Reynolds, author of the must-have book Presentation Zen, puts it well:
“Start strong. The first 2-3 minutes of the presentation are the most important. The audience wants to like you and they will give you a few minutes at the beginning to engage them — don’t miss the opportunity. Most presenters fail here because they ramble on too long about superfluous background information or their personal/professional history, etc.”
Staring at the AV Guy – AV problems will happen. Always have, always will. While the AV guy is fixing your slides, don’t turn your back on the audience and stare at him. Silently. For several minutes of dead air. You should have your whole presentation memorized. If you can’t (and you can), then memorize your opening slides. Just start giving the presentation and catch up to your slide when the glitch has been fixed.
Pacing – Back and forth and back and forth and back and forth and back and forth. That sentence was annoying to read, wasn’t it? That’s how we feel when you pace. The very worst pacing presenters don’t even look at the audience, walking back and forth looking toward the edge of the stage. If you are a pacer, try what I call ‘stand and deliver.’ Walk to a spot, deliver a slide or two, and then move to another spot and do the same thing. Movement can be effective, but not if it’s peripatetic and distracting.
Reading Your Slides – Are you a presenter or a narrator? It’s not called a ‘narration,’ after all. We can read the slide just as well as you can. We are here to hear you and what you have to say. Give us your perspective. Tell us a story. Please.
Once you banish these behaviors, you will be moving out of the basement of bad presenters, on your way to the keynote stage. Promise me you will never ever do any of these four again and I will be right there, in the front row, rooting for you.
For extra credit, and if you really do want to become a great presenter, I highly recommend The Power Presenter by Jerry Weissman, and my chapter on giving presentations from The Professional Marketer.
The post Four Mistakes (Bad) Presenters Make appeared first on Matthews on Marketing.
September 20, 2016
Market Like You Are an Investor – Why Changing Your Mindset Will Rocket Your Career
Estimated Reading Time: 4 minutes
The famous investor JP MorganA CMO can get stuck in their own marketing world. As a head of marketing myself, I have occasionally fallen into what I call marketing tunnel vision. The condition has three symptoms: it complicated communications with other executives, especially your CEO; it distracts CMOs from the bigger picture of the business; and it perpetuates the stereotype that marketers are lightweight business people.
It doesn’t have to be this way. I have the cure, and it’s as simple as changing your mindset – to that of an investor. Not only will it cure you of these symptoms, but I believe it will prove a boost to your career.
Why is it so many CMOs have a hard time communicating or relating to their CEO? Let’s think about a chief executive. His job is to grow the return for investors – the board members for a private company or the institutional investors of a public company. No matter what type of company. Investors care about earnings. CMOs need to talk to their CMO in these terms.
When a CMO reports his department’s growth in MQLs, on its own this stat is several equations away from return on investment, and thus harder for an earnings-oriented thinker to process.
CMOs should not expect a CEO to fill in the gaps any more than they should expect a customer to translate their product’s features into benefits. Shame on us. CMOs know better, after all. Our whole job is to put our products or services into the context of our buyers – understanding what motivates them and ultimately to speak their language. We need to do the same for CEOs.
And it’s not just you as the CMO. Your team needs to speak in terms of investment when they are presenting to the CEO or to the Board. As John Ellett, author of The CMO Manifesto, pointed out in a recent conversation:
“Your team is your responsibility as a CMO, and how they communicate to other executives is ultimately a reflection on you as the marketing leader. You need to train your team to communicate in terms other departments will understand. Marketing metrics are not necessarily best.”
Thinking and acting like an investor will not only solve your communications issues, but it will make you into a better businessperson. Moving away from a narrow minded focus on marketing stats to a broader view of how marketing contributes to the bottom line is a much more useful and objective viewpoint. Ready to start? Here’s how:
Stop spending, start investing – Strike the word ‘spend’ from your vocabulary. Start using the word ‘invest.’ Move the perception of your team from a cost center to a profit center. After all, you are investing the company’s dollars to generate leads that turn into deals.
 Show ROI and conversion rate for all of your programs.
Pay attention to returns – Here’s a simple question: How much do you make from every dollar you invest? Keep tabs on your marketing effectiveness by tracking the return on every program. Don’t present marketing statistics like website growth and email conversion rate to your CEO or executive team. Share with them the return of each program (positive or negative; remember, not all investments make money) and your overall return on marketing spend.
Have a hedging strategy – Do you hedge your bets? By that I mean your programs. I do. I know that I have a certain growth target, and not all of my programs are going to return what I forecast. So I hedge, in multiple ways. I have a backup program that can compensate for those that fall short. I use the lower end of known conversion rates when I calculate my funnel. I estimate full price for program costs, and then I make sure to get a discount from the vendor to bring my costs down. Aim for success, but prepare for failure.
Act like it’s your money – You are the steward of the company’s money, so act like it. Better yet, act like it’s your money. Did you pay full price for your last car, or did you shop around? Ask for a discount? So many marketing teams pay full price because they are embarrassed to ask for a discount, or uncertain how to go about it. All you need to do is ask. And by the way, if you pay less than your competition for trade show space or ad inventory, that’s a competitive advantage.
Think long term and short term – Just like investments, some will pop right away, and some will vacillate but grow over time. Do keep a gimlet eye on your returns, but don’t kill long term growers too early. As the “Oracle of Omaha” Warren Buffet so aptly put it, “Someone’s sitting in the shade today because someone planted a tree a long time ago.” Nurturing programs are a great way to execute on this philosophy, and are essentially free.
Successful fund managers attract more money – Want a bigger marketing budget next year? Then get a great return this year. Just like a successful fund manager attracts more investment. If your CEO knows he will get a higher return on investment by adding to the marketing budget instead of hiring more sales people or engineers, he will give you more money. He almost has to, out of fiduciary responsibility.
You don’t need to turn into Gordon Gekko to succeed (lunch is still allowed). But I believe that thinking
 Investment advice from the notorious investor himself
like an investor will bridge the communications gap and help your business, and in return, your career.
So, channel your inner Warren Buffett. Invest like it’s your own money. Put your marketing dollars into things that you truly believe in and success will be merely an investment away.
The post Market Like You Are an Investor – Why Changing Your Mindset Will Rocket Your Career appeared first on Matthews on Marketing.
September 14, 2016
How De-positioning Works: Dissecting a Shane Co. Radio Ad
Estimated Reading Time: 3 minutes
 Positioning – how your product is perceived in the mind of your buyer – is critical for any marketing organization. Creating a positioning statement is an essential skill for marketers to master. In crowded markets, where the capacity of a buyer’s mind is already filled with competitors, another key concept is critical – de-positioning. I came across a great example recently, which I’m going to dissect to illustrate the concept.
If you live in the San Francisco Bay Area, as I do, you know Tom Shane. Not personally, but from the radio. We all know Tom’s gravelly voice from the ads he’s voiced for over 20 years.
I can almost recite Shane Co.’s ads by heart, and apparently I’m not alone. A recent post on Reddit, “You know you’re from the Bay Area when you’ve memorized what the Shane Company’s locations & store hours are,” inspired 228 comments from people who did.
Yesterday, driving home and listening to KFOG, I was struck by Shane Co.’s most recent spot. Done interview style, the ad starts out with Tom’s typical, homespun exposition on how diamonds should be bought, his personal relationship with buyers in Antwerp and Tel Aviv (a very simply device that tells you Shane Co. is both cosmopolitan and connected), and why he will get you the best deal around.
What stood out for me is how this spot does a great job of de-positioning the jeweler’s competitors. Here’s how the ad continues:
Ethan: Is that so different from other jewelers?
Tom: Totally different. Every year, our buyers examine hundreds of thousands of diamonds, one at a time.
Ethan: Whoa.
Tom: We pick only those diamonds that sparkle the most. Our rejects get sold to middle men, and wind up at other jewelers.
Ethan: Really?
Tom: What even they reject gets listed by online only sellers to be sold sight unseen.
This is clearly aimed at Shane Co’s competition, the other jewelers and online sellers. The jewelry market is a crowded one. There are over 80,000 jewelry stores in the United States, plus online retailers like Blue Nile. So Shane Co. needs to stand out, and de-positioning is a great technique. Let’s understand what de-positioning is. From my chapter on positioning and brand in The Professional Marketer:
To combat [a] crowding problem, sometimes a marketer needs to create a little room in the customer’s mind – elbow their way in, so to speak. This approach is called de-positioning and refers to efforts to change the identity of competing products, relative to the identity of your own product, in the collective minds of the target market.
The line “Our rejects get sold to middle men, and wind up at other jewelers” tells you that the competition gets second-rate diamonds. The claim is almost impossible to verify, of course, but it positions Shane Co. as the purveyor of the best diamonds around. In so doing, other Bay Area jewelers are de-positioned by Tom into a second-rate category that he created.
 Tom Shane in studio
Tom goes on to de-position online retailers as third rate and unscrupulous: “What even they reject gets listed by online only sellers to be sold sight unseen.” So you might be lured by a better price, but caveat emptor.
Very simple, and very effective. He’s our “friend in the diamond business,” as his motto tells us. (I actually had a friend in the diamond business, or I might have stopped by one of his stores to buy my wife’s ring.) Most men only buy one engagement ring, and know very little about diamonds. Tom’s ads aim to educate, and though biased, are one of the few sources of information. The spots are played just about every day on rock and pop radio stations that target the 18 to 35 year old demographic.
Though not related to positioning, one of my favorite lines in the spot is “We pick every diamond by hand.” I’m no expert, but I’m pretty sure that all diamonds are picked by hand. But I love that they call it out, because no one else does. I find many marketers are reluctant to call out features of their product or service that they consider obvious, and yet it’s an opportunity to communicate something desirable or beneficial to their customers.
I’m sure I’ll hear Tom’s ads for years to come. And I’m sure he’ll keep hammering away to secure his company’s position and elbow aside competitors. To paraphrase the famous De Beers ad campaign, while a diamond may last forever, market position may not. Especially if you use de-positioning.
The post How De-positioning Works: Dissecting a Shane Co. Radio Ad appeared first on Matthews on Marketing.
August 23, 2016
Three Math Tricks Every SaaS CMO Should Know
Estimated Reading Time: 2 minutes
Time was when you just needed to be an idea guy to be a great CMO. When it came to academic strong suits, English was desirable, and maybe Art if you were really good. But marketing has changed. Numbers are much more important than words or pictures. To be a great CMO, you need to be great at math, too. This shift to numbers is even more pronounced when it comes to running marketing at subscription businesses like SaaS.
That may be a tall order for some. You can’t just decide to become a Jacob Bernoulli overnight (and probably not even if you go to night school). You can get better by focusing key metrics important to SaaS, like churn and the magic number, aka the CAC ratio.
For CMOs looking for a leg up, I offer three quick math tricks. You will find these not only useful in the day-to-day oversight of your business, but used judiciously, you might even get a raised eyebrow or nod of opprobrium from your CFO in the boardroom.
Calculating Customer Lifetime – I have Joel York from Markodojo to thank for this one. When reviewing an early draft of The SaaS Marketing Handbook, he rightly told me that this is the only true way to calculate customer lifetime.
To calculate your customer lifetime, divide 1 by your churn rate. The formula is used to calculate exponential decay, and in addition to customer lifetime is also used to calculate credit payments and how long radioactive material will last (throw that one out if you really want to impress your head of R&D). If your annual churn rate is 20%, then your customer lifetime is 1 ÷ 0.20, or five years. Not only is this a handy trick, but it’s crucial for a new business or product line, when you have not even existed for as long as a potential customer lifetime.
Translating CAC Ratios to ROI – Though a simple concept, many people just can’t quit grasp what a Customer Acquisition Cost (CAC) ratio is. If you are a SaaS marketer, you should (and can find our more in my “Becoming a Metrics Ninja” chapter here). But as a SaaS CMO myself, I’ve been in situations where I’ve explained it to a colleague and just got that MEGO look back.
What to do? Most people can understand ROI. So here’s a quick way to state a CAC ratio in terms of ROI. A CAC ratio of 1 means your company will take a year to make your money back, and 13 months to be ROI positive. CAC ratios over 1 are great because you are ROI positive in the first year, and all of the out years on your customer lifetime (see above) are gravy. Here’s the quick math for your Rain Man moment.
.5 CAC Ratio is ROI positive in 25 months
1 CAC Ratio is ROI positive in 13 months
1.25 CAC Ratio is ROI positive in 10 months (9.6 actually, for those who relish precision)
1.5 CAC Ratio is ROI positive in 9 months
100% Annual Growth – If you want to grow 100% a year, you need to grow 19% a quarter. I think it’s cool to have such an arbitrary number in your head, and you won’t sound like those numbnuts who think 25% QoQ growth equals 100% a year.
Here’s how it works. Let’s say you end Q4 with $100 in sales. We’re going to multiply the previous quarter’s revenue by 1.19 each quarter. Watch:
Q1: $100 x 1.19 = $119
Q2: $119 x 1.19 = $141.61
Q3: $141.61 x 1.19 = $168.51
Q4: $168.51 x 1.19 = $200.53 (consider the 53 cents a tip)
Keep these tips at the ready. Faster than taking STAT 510 – Statistical Inference or becoming your CFO’s golfing buddy.
And for those former poets and artists among you who want to jump into the decimal deep end, I highly recommend the wonderful little primer Beyond Numeracy by John Allen Paulos.
Know another good trick? I’d like to hear it.


![[image error]](http://i1.wp.com/www.matthewsonmarketing.com/wp-content/uploads/2016/10/Screen-Shot-2016-10-30-at-8.57.17-AM.png)