
Gennaro Cuofano's Blog, page 275
July 8, 2016
The Three Most Important Financial Ratios for the Manager
Often managers start from the assumption that a profitable business is also a successful one. Often this assumption is extremely flawed. Why? Because profitability is just one of the possible perspectives from which the manager should focus to understand the performance of a business.
In fact, often you see profitable businesses, which inevitably fail because of a shortage of short-term resources, which can be defined as liquidity.
The part of the balance sheet that you look at to assess liquidity is the current asset section and compare it with the current liabilities section.
Of course, the most appropriate ratios to measure liquidity are the Quick Ratio or Acid Test or the Current Ratio. At other times you can use the Absolute Ratio but it is a less reliable measure compared to the previous ones.
On the one hand, these ratios give us a good picture of the business ability to produce liquidity. On the other hand, we are still missing something.
In fact, if we want to know whether the business is really successful when it comes to the management side, we should look at the efficiency of the operations. Therefore, if the manager wants to judge his/her contribution to the business the emphasis should be placed on three main items of the balance sheet:
Accounts receivable: sums of money to be received by customers.
Inventories: materials held into the business to be ultimately sold or transformed in final product.
Accounts payable: sums of money to be given to suppliers for the purchase of row materials or other services.
These three items can make or brake a business. For instance, imagine to own a restaurant, which is very successful. In fact, each night you have hundreds of customers.
The weird thing though is that when you look at your financial statements, although an extremely high net profit, your operating cash flow and your bank account show a shortage of money, you are out of business! How did it happen?
Well, you didn’t pay enough attention to your accounts receivable. In fact, even though the restaurant was fully booked each night, most of the customers had opened accounts, which allowed them to pay at a later date.
Therefore, you were recording the revenues coming from these customers, although no cash was received. Eventually, your income statement showed a very high net profit, which gave you the impression that things were working out fine, but all the money was lumped into the accounts receivable. In conclusion, the business failed for the inability to convert accounts receivable into cash as quickly as possible.
For such reason, it is crucial to verify that the business is efficiently managed. Some financial ratios to determine the efficiency of the business are the following:
Inventory Turnover: CoGS/Average Inventory. This ratio allows to determine the ability of the business to convert inventory in sales. Therefore, it will expressed as a number. For instance, if we have CoGS for $60K, and Average Inventory for $10K, the inventory turnover will be 6 (60/10). This means that the inventory will be converted three times in a year. As you can imagine the higher the ratio the better for the business. In fact, it is crucial to be able to have fast inventory turnover. From this ratio, we can also derive the inventory in days by dividing 365 by the inventory turnover. For instance, in this particular case we will have 365/6 = 60 days. Therefore, the inventory will be converted in sales each 60 days.
Account Receivable Turnover: this ratio allows us to determine how many times in a year the accounts receivable will be converted into cash. As I mentioned before in the example, the more quickly the accounts receivable will be converted in cash the more liquidity the business will have. This ratio is given by Sales or Net credit sales/Average accounts receivable. It will be expressed as a number. An higher ratio is a good sign, since it implies a more efficient organization, which in turn is able to generate more short-term resources for the business. Also in this case the ratio can be converted in account receivable in days. For instance, if we have a accounts receivable turnover of 5, we can divide 365/5 = 73 days. It means that the business is able to convert its receivable in cash each 73 days.
Accounts Payable Turnover: this ratios is the flip side of the Account Receivable Turnover. In fact, the ratio tells us how many times in a year we pay back our suppliers. The ratios is given by Credit Purchases/Average Payable. It will be expressed as a number. For instance, a payable turnover of 5 indicates that the business pays back its purchases five times through the year. Here we can convert this ratio in payable in days by dividing up 365/5 = 73 days. Therefore, each 73 days all the credit purchases are paid back to suppliers.
These three ratios are not absolute measure. It means, that they can be higher or lower according to the industry or business we are analyzing.
Therefore, when it comes to ratio analysis it is always advisable to perform a trend analysis, by comparing how the financial ratios evolved over time.
It is also crucial to compare these ratios to determine the performance of the business in its competitive environment, by selecting a group of comparable.
Knowing how the above ratios evolve overtime is crucial for any financial manager. For instance, a company able to shorten its receivable turnover to 30 days, while stretching out its payable turnover to 60 days (thanks to good relationship with suppliers) would be able to generate extra liquidity. In this case, in fact, the customers are de facto financing the business operations in the short-term.
If you have already a foundation fo financial accounting and you want to learn more about Financial Ratios and how to use them in financial analyses you can consult my book:
Fundamental Analysis – Simplified Manual: Simplified Manual to Understanding Fundamental Analysis (The Toolbox of the Finance Professional) (Volume 2): Mr Gennaro Cuofano MBA: 9781533267894: Amazon.com: Books
But if you lack a foundation of financial accounting and want to start from scratch, up to ratio analysis you can consult my book: Accounting Revealed in 100 Pages.: Mr Gennaro Cuofano: 9781517566708: Amazon.com: Books


July 6, 2016
Introduction To Commercial Lease Agreements | Real Estate Essentials
The following article has been extracted from the manual “Fast Tenant’s Guide to Understanding Commercial Lease Agreements.“
Let’s cover some basics. A lease contract is an agreement entered between two parties, the tenant and the landlord. The tenant, which usually in the contract is defined as lessee will enter the agreement to gain the right to use a certain premise for commercial purposes, such as renting a office, operating a restaurant, opening a retail store and so on. To gain this right, the lessee will pay in exchange a sum of money that is called rent. The rent can be fixed, variable or additional. We are going to cover more in detail each of these aspects. On the other side of the agreement there is the Landlord, which in legal lingo is called lessor. The lessor surrenders his right to use the premise that he owns or that he manages but in exchange he will gain the right to receive a sum of money, which is called rent.
Therefore so far we have two parties, the Lessee, or tenant or renter, and the Lessor, or landlord, or lessor. But why in the first place would you enter a lease agreement? Wouldn’t you be better off without one?
The Advantage of Signing a Written Agreement
Although this may sound trivial, entering a written lease agreement is convenient for both landlord and tenant. In fact, since in most cases things work out smoothly between the parties, this creates in people’s mind the feeling that a written agreement may be not needed. Many other in fact, realize the importance of a written agreement when things get messy. In that case not having a written agreement in your favor can turn really bad. In fact, although you may think that an agreement is just a piece of paper where you note how much rent you will have to pay to the landlord, this piece of paper is much more than that. Imagine the case in which things don’t work out as planned. You didn’t deem necessary to enter a written agreement, since you trusted the landlord of the rented premise, because you knew him since long time. Unfortunately you learned that when it comes to money people could change their attitude very quickly. Indeed, the landlord does not keep the promise he had made when he shook your hand and now he is asking you to leave the premise immediately. There is a problem though. You performed some renovation on his premises just because you agreed to be there for few years, thus you rightfully want your money back. The landlord/dishonest person does not agree and he gets the premise back without paying you a dime. In turn, you bring him to court, and since you are in the right you also believe that you will easily win against the landlord. Once in court, the judge asks for evidence but the only existing agreement between you and the landlord is a handshake. You say the truth, that the landlord agreed you could stay in the premise for few years and that is why you renovated the building. The landlord on his side lies shamelessly. Yet the judge doesn’t know that. Therefore, the judge declines your claim. In conclusion, you lost time, health and money, for what? You could have saved all that by just signing a written agreement! You learned your lesson and moved forward. This means that the agreement is a tool that clarifies the responsibilities of each party.
As we saw in the previous example, while the lease agreement will save you in the event in which things will not work out as they were supposed to. On the other hand, the lease agreement can also be very tricky for the tenant if he doesn’t know its content. Let’s see why it is important to know the content of the lease agreement.
The Importance of Carefully Reading the Lease Agreement
If the contract is a helpful tool that can rescue the tenant from screw-ups, at times it can also be a tricky tool used by the landlord to mess up with the tenant. I know you may be thinking, “a lease is just a piece of paper and of course I am going to read it carefully before signing it” but in my experience this does not often happen. Many tenants don’t really know the content of their lease agreements. The only exception is for tenants that aren’t physical persons but corporations, which have a dedicated department for legal matters, thus they usually know more in detail the content of the commercial lease. Does it mean that you have to hire someone to carefully read your lease? Absolutely not, in this manual I will explain what are the strategies to use to carefully understand your lease agreement. Beside, I am not accusing tenants to be shallow, quite the opposite. At times it is the way the legal system works that makes things too complex for the average person. In fact a commercial lease at times can be as long as 100 pages! In addition, you will find terms such as eminent domain, estoppel certificate; lien and so on that only help to generate more confusion. In addition to that usually a lease can have the so-calledaddenda (plural for addendum), which are specifications to the main lease. I am not surprised that eventually the tenant is unwilling to deal with all these boring papers. On the other hand, it is crucial to learn how to deal with commercial leases if you are an entrepreneur or merchant because this understanding can save you thousand of dollars.
This article provided a quick introduction to Commercial Leases. To know more about the topic consult the short-manual from which this article has been extracted “Fast Tenant’s Guide to Understanding Commercial Lease Agreements.“


What is Risk?
Guest post by Gennaro Cuofano @ http://www.becomefinancialanalyst.com
The Oxford Dictionary defines risk as:
“A situation involving exposure to danger” and it goes on “The possibility that something unpleasant or unwelcome will happen.”
Thus we want to define what is danger and what is this unpleasant thing we want to avoid. A first obstacle stands in the way of defining risk. In fact, each of us seems to have a different perception of what danger is. For instance, you may be a firefighter that is so brave to jump into homes on fire and save people and still be very fearful when it comes to investing!
In addition, in the investing world there is a term used behavioral economists, which is “loss aversion.” In short, it seems that we perceive losses way more than we actually perceive gains. This bias was first elaborated and verified by Amos Tversky and Daniel Kahneman. In other words, a 10$ gain is perceived more than twice less satisfactory of a loss of the same amount. This seems to be a built in bias. Thus, we can do our best to define risk, although our definition may not be perfect.
Since, risk is different according to the perspective of the investor, A. Damodaran proposes a useful approach, which is that of the “marginal investor.” In short, to define risk you have to define the marginal investor first. But who is this marginal investor?
The marginal investor is the person or institution that at any time may hold the stocks of a company and therefore also influences its prices. The next step is to identify the marginal investor. How? Well, we have just to look at the ownership structure of our target company. For instance, let’s look at who the marginal investors are for Apple:
For instance, Apple’s main shareholders are Institutions and Mutual Funds. In fact, insiders hold just a tiny part of Apple’s issued shares. Thus, we can easily assume that Apple’s marginal investors are well diversified. This means that they will have a lower risk compared to a non-diversified investor. Why?
Let’s assume that you have all your capital invested in one company. What happens if that company goes bankrupt? You will lose all your wealth, wouldn’t you? Conversely if you have your eggs in different baskets, if one basket falls you will still have the other eggs. If you are an individual you can diversify your financial risk by investing in different stocks or for instance in a stock index. What about a business? How can a business diversify (thus reduce) its risk exposition?
To answer to this question we have to analyze the several components of risk. To know more about risks and how to measure it, check out the corporate finance simplified manual here.


April 28, 2016
How to Overcome Writer’s Blocks
This article was not meant for publication since it was a personal experiment on how to overcome writer blocks. But I eventually decided to publish it, since thanks to the principles underlined in this article I was able to overcome my block. You will notice at the beginning of the article that I didn’t even know what the topic was supposed to be, until I figured it out naturally (it was so logical!).
This is an experiment. I heard of many stories of people that have writer blocks and suddenly they manage to get out of them. Few days ago I was reading a book, “Intuition Pumps” by Dan Dennett.
At a certain point the author asserts that most of the time writer blocks are due to our tendency to look for perfection (although the topic of the chapter was not related to writing), and our hardwired fear of making mistakes.
Therefore, I am going to write whatever comes to mind without trying to think what the topic is and how the article has to be organized. And that is exactly what I am doing right now. I am not sure this is working but I notice that words are starting to flow and I am still trying to make sense out of it.
But let’s start with order. Why am I not able to write whenever I want? Wouldn’t be cool to be able to write at command? Then, why is it so difficult to achieve that?
Sometimes it is lack of inspiration, some other times, laziness, and others fear. The problem lays in the fact that we all want to tell something interesting but not so many of us succeed in that. (I was still trying to figure things out).
For instance, there are times in which I don’t write for weeks and then a day I start writing and it feels so natural and other times it feels frustrating.
What I notices is that this is also due to the fact that I usually try to write things that can be appealing to a large audience. May that be the real problem? Shouldn’t I focus on just writing what I love, also if none may care about it?
That may be the solution: “write what you love, independently by the fact that others will like it or not.” (Here it seems I figured what I was going to write, although still in the process of shaping the content)
Eustress vs. Distress
Another huge problem with blogging (if you do it full time) is the fact that it becomes like a job. And as we know when things become forced on us, they lose the attractiveness they once had and suddenly become stressful.
You can now seem to understand those people that value money over time. Until you put things in perspective. You have already been through the “rat race”, part of these people, sitting in their cubicle, hating their job, and looking forward to the weekend.
But if we are not part of that group of people, then how to avoid falling back into “I just do it for the paycheck” fallacy?
The right thing to do is to make sure that most of the tasks you perform as freelance writer, or blogger are actually interesting and also engaging to you. Although you may feel stressed at times this is not necessarily a bad thing. In fact, in modern society everyone is familiar with the term “stress” that has strongly entered our vocabulary.
You may have not known that there are two forms of stress: eustress and distress. In fact, the latter is the stress that you want to avoid, since this leads to negative physical and psychological consequences; the former is a form of stress that is more natural and it actually allows you to overcome barriers. Let’s try now to see how to make ourselves more prone to eustress rather than distress. Here I want to analyze three things that really help me in overcoming writer blocks, like for instance, in this case.
Avoid Perfectionism
Our fear of making mistakes is sometimes greater that our willingness to act. This in turn leads to inaction and lack of motivation. Think of how many times you had wanted to do something, but didn’t find the momentum to act on that, because you feared to be judged by others on your lack of perfection! It is time to stop that thought before it arises and just start writing like I did in this article. The problem also lays in the fact that too often we hear everywhere things on productivity, organization and so on. It feels like we have to have a preset plan also to write an article. While this method may work in normal times, when blocks arise I would suggest you actually do things without any preconceived plan. Don’t worry eventually you will figure things out and even if the article at first won’t make sense as you hoped, you will see that part of the content you wrote may still be useful for other purposes. In short, writing is like reading, the more the better.
Rule n.1 (don’t take me too seriously with the order of the rules, they can be easily exchanged): Write without premeditation or a preconceived plan. You will figure things out eventually.
Stop Procrastinating
This point is connected to the previous one, although less deliberate. In fact, while when we look for perfectionism, we deliberately chose not to act, because the result of our writing may be not as good as we hope to be; in this second case, instead, we don’t really choose but find excuses not to act (write). Think how many times you said yourself I am going to write that article, about that interesting topics, “but before I do that” I have to read another article, watch that YouTube video, finish to read that book that may help me to write the article, and so on until infinity.
Well, do you want to overcome procrastination? Stop to say, “Before I do that” and just do it. Remember, that it is not important if you write a line or ten pages, what really matters is that you act now! I am sure that to write an article researching into the topic is a very important thing to do, especially if you are someone that follows a content marketing strategy. On the other hand, I found that most of the best researches I’ve done for my articles happened when I eventually decided to write. In fact, most of the times when I start writing I also figure out that many of the researches I wanted to include in my article would actually bring me way too far from the topic. This is due to the fact that there is a huge Gap between thinking and writing. Indeed, when we think we do so in images, while when we write, we do so through words. This implies that we use different parts of our brain, which need to be coordinated if we want to come out with something that makes sense. How many times you thought something that seemed so clear and brilliant in your mind and suddenly it loses meaning when you end up writing or expressing it in word? Don’t worry this is normal to any of us.
The only way to pass that psychological barrier is to order that set of images that you have in your brain and that seems so clear, and make sure they also make sense on a piece of paper.
Rule n.2 “What seems to make sense in your brain may not make sense on your computer’s screen. Therefore, do not look for excuses; write, write, write”
Praise Yourself
This is the one I like the most, since I do not often follow this advice. In fact, another main reasons for writer’s blocks are due to our tendency to be hard on ourselves, up to the point of burn out. To avoid any of that, it is good at the end of any achievement to stop, celebrate, and take some time off. From a psychological standpoint this allows you to be less hard on yourself. From a biological standpoint this allows your body to keep in check all the chemicals in your body and mind that will favor your productivity and creativity in the long run.
Rule n. 3 “Don’t be too hard on yourself when making a mistake. Praise yourself when achieving an objective (small or big it doesn’t matter).
Monetization Problem
A last point that I want to touch is the fact that most of the time what makes us stressed is the fact that we think of our writing in terms of money. In short, we ask often the wrong question: “how much money will this article make?” in fact, this kind of question puts you in the wrong mindset. At that point there is not difference anymore between being a freelance writer (notice the word free into the word freelance) and an employee in suit and tie.
But what is the right question? I guess there are many others better than asking how much you can make with an article, but the one that I find most helpful is: “will my article contribute to other’s people lives?” and also “will writing this article improve the depth of my understanding for the topic of my interest?”
In fact, with this kind of reasoning, I get out of it as a winner in any case. Indeed, if the article really helps others, then this would be the best-case scenario. But also if eventually people don’t find my article interesting, I still made the most out of it, because I wrote about a topic of my interest and I improved my understanding of that topic by writing about it.
Summary
In conclusion in this article I wrote about my experience with writers blocks. And I found that the strategy of writing whatever comes to mind without a preset agenda really helped me in writing this article. In fact, if you told me I would have been able to write an article of well over 1,000 words before starting I would have deemed it impossible. But apparently I was able to overcome my block and also deliver hopefully something that could be helpful to others. The best cure to inaction (due to our tendency to be perfect, lazy or fearful) is to act independently from the consequences it will lead to.


How to Overcome Writer Blocks
This article was not meant for publication since it was a personal experiment on how to overcome writer blocks. But I eventually decided to publish it, since thanks to the principles underlined in this article I was able to overcome my block. You will notice at the beginning of the article that I didn’t even know what the topic was supposed to be, until I figured it out naturally (it was so logical!).
This is an experiment. I heard of many stories of people that have writer blocks and suddenly they manage to get out of them. Few days ago I was reading a book, “Intuition Pumps” by Dan Dennett.
At a certain point the author asserts that most of the time writer blocks are due to our tendency to look for perfection (although the topic of the chapter was not related to writing), and our hardwired fear of making mistakes.
Therefore, I am going to write whatever comes to mind without trying to think what the topic is and how the article has to be organized. And that is exactly what I am doing right now. I am not sure this is working but I notice that words are starting to flow and I am still trying to make sense out of it.
But let’s start with order. Why am I not able to write whenever I want? Wouldn’t be cool to be able to write at command? Then, why is it so difficult to achieve that?
Sometimes it is lack of inspiration, some other times, laziness, and others fear. The problem lays in the fact that we all want to tell something interesting but not so many of us succeed in that. (I was still trying to figure things out).
For instance, there are times in which I don’t write for weeks and then a day I start writing and it feels so natural and other times it feels frustrating.
What I notices is that this is also due to the fact that I usually try to write things that can be appealing to a large audience. May that be the real problem? Shouldn’t I focus on just writing what I love, also if none may care about it?
That may be the solution: “write what you love, independently by the fact that others will like it or not.” (Here it seems I figured what I was going to write, although still in the process of shaping the content)
Eustress vs. Distress
Another huge problem with blogging (if you do it full time) is the fact that it becomes like a job. And as we know when things become forced on us, they lose the attractiveness they once had and suddenly become stressful.
You can now seem to understand those people that value money over time. Until you put things in perspective. You have already been through the “rat race”, part of these people, sitting in their cubicle, hating their job, and looking forward to the weekend.
But if we are not part of that group of people, then how to avoid falling back into “I just do it for the paycheck” fallacy?
The right thing to do is to make sure that most of the tasks you perform as freelance writer, or blogger are actually interesting and also engaging to you. Although you may feel stressed at times this is not necessarily a bad thing. In fact, in modern society everyone is familiar with the term “stress” that has strongly entered our vocabulary.
You may have not known that there are two forms of stress: eustress and distress. In fact, the latter is the stress that you want to avoid, since this leads to negative physical and psychological consequences; the former is a form of stress that is more natural and it actually allows you to overcome barriers. Let’s try now to see how to make ourselves more prone to eustress rather than distress. Here I want to analyze three things that really help me in overcoming writer blocks, like for instance, in this case.
Avoid Perfectionism
Our fear of making mistakes is sometimes greater that our willingness to act. This in turn leads to inaction and lack of motivation. Think of how many times you had wanted to do something, but didn’t find the momentum to act on that, because you feared to be judged by others on your lack of perfection! It is time to stop that thought before it arises and just start writing like I did in this article. The problem also lays in the fact that too often we hear everywhere things on productivity, organization and so on. It feels like we have to have a preset plan also to write an article. While this method may work in normal times, when blocks arise I would suggest you actually do things without any preconceived plan. Don’t worry eventually you will figure things out and even if the article at first won’t make sense as you hoped, you will see that part of the content you wrote may still be useful for other purposes. In short, writing is like reading, the more the better.
Rule n.1 (don’t take me too seriously with the order of the rules, they can be easily exchanged): Write without premeditation or a preconceived plan. You will figure things out eventually.
Stop Procrastinating
This point is connected to the previous one, although less deliberate. In fact, while when we look for perfectionism, we deliberately chose not to act, because the result of our writing may be not as good as we hope to be; in this second case, instead, we don’t really choose but find excuses not to act (write). Think how many times you said yourself I am going to write that article, about that interesting topics, “but before I do that” I have to read another article, watch that YouTube video, finish to read that book that may help me to write the article, and so on until infinity.
Well, do you want to overcome procrastination? Stop to say, “Before I do that” and just do it. Remember, that it is not important if you write a line or ten pages, what really matters is that you act now! I am sure that to write an article researching into the topic is a very important thing to do, especially if you are someone that follows a content marketing strategy. On the other hand, I found that most of the best researches I’ve done for my articles happened when I eventually decided to write. In fact, most of the times when I start writing I also figure out that many of the researches I wanted to include in my article would actually bring me way too far from the topic. This is due to the fact that there is a huge Gap between thinking and writing. Indeed, when we think we do so in images, while when we write, we do so through words. This implies that we use different parts of our brain, which need to be coordinated if we want to come out with something that makes sense. How many times you thought something that seemed so clear and brilliant in your mind and suddenly it loses meaning when you end up writing or expressing it in word? Don’t worry this is normal to any of us.
The only way to pass that psychological barrier is to order that set of images that you have in your brain and that seems so clear, and make sure they also make sense on a piece of paper.
Rule n.2 “What seems to make sense in your brain may not make sense on your computer’s screen. Therefore, do not look for excuses; write, write, write”
Praise Yourself
This is the one I like the most, since I do not often follow this advice. In fact, another main reasons for writer’s blocks are due to our tendency to be hard on ourselves, up to the point of burn out. To avoid any of that, it is good at the end of any achievement to stop, celebrate, and take some time off. From a psychological standpoint this allows you to be less hard on yourself. From a biological standpoint this allows your body to keep in check all the chemicals in your body and mind that will favor your productivity and creativity in the long run.
Rule n. 3 “Don’t be too hard on yourself when making a mistake. Praise yourself when achieving an objective (small or big it doesn’t matter).
Monetization Problem
A last point that I want to touch is the fact that most of the time what makes us stressed is the fact that we think of our writing in terms of money. In short, we ask often the wrong question: “how much money will this article make?” in fact, this kind of question puts you in the wrong mindset. At that point there is not difference anymore between being a freelance writer (notice the word free into the word freelance) and an employee in suit and tie.
But what is the right question? I guess there are many others better than asking how much you can make with an article, but the one that I find most helpful is: “will my article contribute to other’s people lives?” and also “will writing this article improve the depth of my understanding for the topic of my interest?”
In fact, with this kind of reasoning, I get out of it as a winner in any case. Indeed, if the article really helps others, then this would be the best-case scenario. But also if eventually people don’t find my article interesting, I still made the most out of it, because I wrote about a topic of my interest and I improved my understanding of that topic by writing about it.
Summary
In conclusion in this article I wrote about my experience with writers blocks. And I found that the strategy of writing whatever comes to mind without a preset agenda really helped me in writing this article. In fact, if you told me I would have been able to write an article of well over 1,000 words before starting I would have deemed it impossible. But apparently I was able to overcome my block and also deliver hopefully something that could be helpful to others. The best cure to inaction (due to our tendency to be perfect, lazy or fearful) is to act independently from the consequences it will lead to.
March 17, 2016
Financial Analysis in Three-Steps
Disclaimer: the information provided in this article does not represent an investment advice, neither creates any professional relationship with its author. The information provided is for educational purposes only.
In this article I want to introduce a fast and easy way to analyze the performance of any company, the trend analysis. This is the best way to understand the fundamental of any company. In fact, the purpose of this analysis is to determine how the target company performance evolved overtime.
Eventually we will be able through this analysis to grasp what were the factors that most affected the growth (or decay) of our target company’s performance. Where do we start?
Analysis set up
We are going to perform this analysis up by taking three simple steps. But before we do that we have to have all the information needed available. Where do we find this information? Easy, we look at the target company’s website.
Check out our previous article on how to set-up an analysis here and read the paragraph “what to look for?”
Analysis Overview – Don’t make assumptions
In many financial analyses (especially those based on forecasts and financial models), the starting point is to make assumptions. In our analysis, instead, we want to make as few assumptions as possible.
In fact, we are going to let the financials speak for themselves. How? Through three simple steps: in step number one, we are going to select a set of financial ratios that we will use as analytical tools to understand our target company.
In step number two, we are going to perform a DuPont analysis to understand how the profitability evolved overtime. Indeed, since we want to make very few assumptions, we are going to drill-down into the ROE and see what influenced it.
And in step number three we are going to compare the financial ratios of our target company against its main comparable. Therefore, before we do that we will have to select a group of comparable companies.
Let’s proceed with order:
Step-One: financial ratios set-up & two-year comparison
In this step we are going to select a set of ratios that will guide us toward our analysis. Financial ratios are metrics that help us in comprehending the main financial statements. To have a more detailed account of how they work check out our previous article on ratio analysis here.
In this phase we have to select some ratios to assess few main aspects of the business that we will divide in four main categories: profitability, liquidity, leverage and efficiency. In this phase we are going to leave valuation out, which we are going to include in the third step of our analysis.
Once selected these ratios we have to run them for the current and previous year. This is because we want to understand how the company’s trend evolved overtime. In this specific case I decided to do an analysis for 2014 and 2015 for simplicity sake.
You can expand the trend analysis to three or five years if you like. For instance, in my course “Financial analysis from scratch to professional level” (you can grab a coupon for the course here if you like), I picked some ratios to analyze Apple Inc. and run them through. See the results in the following table:

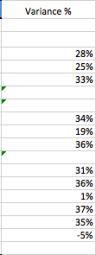
As you can see from the above table I picked ten different ratios and run them to understand how Apple Inc. performance changed from 2014 to 2015. The table shows an increased profitability, liquidity, leverage and efficiency.
In fact, the only negative number that you see in this table it is actually a good sign. This is because the receivable in days ratio tells us how long it takes for the company to collect the money from the customers that buy on credit.
In short, the shortest the time it takes for a company to collect money from tis customers the more it becomes liquid overtime. In Apple Inc. specific case, the receivable in days decreased by 12%, from 30.5 days to 26.8 days. This is definitely a good sign. In fact, usually a number, which goes below 60 days, is positive, and in this case below 30 days is an extremely positive result.
After completing step-one we can move forward to our second step.
Step number two: DuPont analysis
In this phase we are going to analyze why the profitability increased and what were the factors the influenced it so much. In short, we are going to drill-down into the ROE to see what is going on there.
In fact, as you can see from the previous table our ROE increased from 33% to 46%. To know more in detail how to perform this analysis check out our previous article on DuPont Analysis here or you can take at look at the table I produced in my course “Financial analysis from scratch to professional level” below (you can grab a coupon for the course here if you like):

As you can see from this table, although the ROE increased substantially it did so due to leverage and profitability. In short, the company was able to improve its revenues but also to contract more debt.
These two factors combined made the company ROE skyrocket. We are ready to move to our third and last step.
Step-three: select comparable set-up and comparative analysis completion
In this phase here we have to select some comparable. In short, we want to select companies, which present the same features of our target firm. Afterward, we can relate the main financial rations of our target company against those of the comparable.
The objective here is to understand the competitive context. In short, although we can make a first assessment of the company’s financials through the first and second step, we are still missing some pieces to complete our puzzle.
Consequently we are going to use two criteria to select our comparable companies: business and financial profile. These two profiles will be our guidelines.
Business profile
The business profile attains to qualitative aspects of the business, which we can synthetize in four properties:
Sector – in what sector does the target company operate?
Product and services – what are the core products and services the target company offers?
Distribution channel – how does the target company get to its end customers?
Geography – what is the main market where our target company operates?
For instance Apple Inc. operates in the consumer goods category and electronic equipment category. Its main products are iPhone, iPod, MAC (which make up most of its revenues).
Apple Inc. distributes its products mainly through its own retails stores and the main market is the U.S. (although the company operates worldwide and currently Greater China makes up for 25% of the company’s sales).
Financial profile
The financial profile attains to quantitative aspects of the business. In fact, we are going to consider five main aspects:
Size – Market cap, revenues, net income
Profitability – Average net margin, or gross margin last three or five years
Growth profile – Where does the revenue growth come from? Geography and product analysis
Return on investment
Credit profile – What rating was the company assigned lately? Or what level of liquidity the company has?
For instance, Apple Inc. 2015 market cap surpassed $500 billion dollars, with over $230 billion dollar in revenues and over $50 billion in net profit.
In addition, as for the profitability, the company showed an average net margin (net income/sales) of 23% in the last 5 years. Its revenue growth came mainly from one product, the iPhone and one market, Greater China.
Select Comparable
It is time to select Apple’s main comparable. In my course “Financial analyst from scratch to professional level” (you can grab a coupon of the course here if you like), I explain more in detail why I picked Google and Microsoft as main comparable for Apple Inc.
For simplicity sake, here I want to highlight the fact that when selected Apple comparable I gave more importance to criteria such as geography, products and services, size, and profitability.
In fact, Apple has been able to achieve a powerful position in so many different industries in the tech world and therefore it has also several direct competitors. For instance, in the smartphone industry Apple’s direct competitors are Samsung, Sony, Lenovo and so on.
In the personal computer industry Apple’s main competitors are Microsoft, Dell, HP and Lenovo. We could go on forever. Although, my assumption here is that de facto Apple’s success was mainly due to its ability to integrate several products through a very intuitive interface that differentiated it from its competitors.
In short, I am assuming (sometimes we have to use assumptions) that the future battle in the tech industry will be played on the software side, rather than the hardware. Therefore, the two biggest players, which are competing against Apple in this respect, are Microsoft and Google.
Perform comparative analysis
We can now run the main financial rations for Apple Inc. and assess them against Google and Microsoft. As reference you can look at the table below taken form my course “Financial analysis from scratch to professional level” below:

In this table is summarized the financial performance of Apple Inc. in comparison with Microsoft and Google for 2015. As you can see from the date Apple has better profitability and efficiency ratios but also worse liquidity, leverage and market valuation ratios.
Wrap-up and Conclusions
In this article we saw how to set up a financial analysis in three steps. In the first step we selected a set of financial data useful to comprehend the performance of our target company. In step-two, we went further and analyzed how the ROE evolved overtime. Eventually in step-three, we sleeted comparable companies, and performed a comparative analysis to determine how our target company performed in comparison to the group of company, which operate in the same context.
From the above analysis you can already be able to draw some conclusions but also investigate further what is going on with our target company. But I hope this article wasn’t too long. Therefore, we will remand our further investigations to another future occasion.
Subscribe to our blog to claim your free e-book, by clicking on the image below:


March 15, 2016
Three Excel Functions any Business Professional Should Know
It is no wonder that Excel is still among the most used software in business and finance. Its inexpensiveness, simplicity and adaptability make it a perfect tool for the job. Not only that but also the fact that you can easily integrate Excel into the Microsoft package, makes it very powerful.
What is unsafe about Excel is the fact that when used improperly it can have more drawbacks than advantages. Indeed, Excel allows you to do everything you want. The problem is that in order for you to use all the potentiality of this software you must understand them. For instance, one the greatest advantage and problem of Excel is the fact that it allows you to do things manually.
Therefore, many people pick what seems the easiest path because they don’t know how to automate their spreadsheets. The consequence is that with more manual staff inputted into the spreadsheet more errors will ensue, and the spreadsheet will become a plethora of inaccuracies rather than an effective tool. How to avoid that?
Excel can make or break a career
Since in business and finance the ability to use Excel can make or break a career, in this article I want to show three Excel hacks that any professional should know. Not only because these hacks can be used in multiple ways (your creativity is the limit), but also because these hacks are among the most required into the business industry.
We are going to see how to use three functions: IFERROR, IF statement, and Vlookup. The objective of this article is to show you that also the non-professional can learn how to use more advanced functions quickly and integrate them in the spreadsheets to create automated reports.
In short, we want to avoid manual labor in excel for two main reasons: First, an automated report will be way faster. Second, an automated report will minimize mistakes that usually happen due to manual inputting.
If you want to put into practice these functions, download the Excel sheet here and follow along…
IFERROR AND IF STATEMENT
In this paragraph we are going to see two main functions: the traditional IF statement and the IFERROR function.
With the IF statements you can build automated reports. But how does it work? What can we use it for? And what are the limits of this function?
This function allows you to have a result when a condition is met. For instance, if I want to know whether A = B I will have Excel tell me if this is true or false. This is just one of the many possible ways to use this function. But let’s proceed in order; we are going to see how to use the IFERROR function.
IFERROR
This function has an aesthetical and practical purpose, which is to avoid showing into our spreadsheet error messages. Imagine you have to present a report to a client, and the client will use this report in the future.
The spreadsheet is automated and some formulas will show an Error message. How to avoid that?
We use the IFERROR function. For instance, in the case below we have Apple Inc. Income Statement and we want to build a variance report. In short, we want to know what is the difference between 2015 and 2014 financials.
To do that we use a formula, which is: (current year/previous year -1). This formula will give us the percentage of increase or decrease over the previous year like below:

As you can see from the picture above, although the formula works, there are certain cells where it shows #DIV/O! We could simply delete these cells, but what if we just make them look empty automatically? In short, we are going to tell excel to show no values in the cells where otherwise would show an error message.
To do so we use the IFERROR formula. This formula will look like the following: IFERROR(value,value_if_error). In the first part of the formula, where it says “value” we are going to input the formula to compute the variance.
In the second part, where it says “value if error” we want to tell excel what to show in the cell in case there is an error. For instance, we want the cell to be empty; therefore we are going to input into the second part of the formula the quotation marks “” which will tell Excel to show the cells as empty ones. See below:

You can now drag the formula down by clicking on the bottom right corner of the formula, hold the mouse down and drag the formula up to the desired cell untie you have this formula in the entire column, like below:
As you can see the errors that we saw before are not showing anymore in our report. This is just one of the many ways the IFERROR statement can be used.
IF Statement
Let’s use the IF statement now. Imagine that in the same report we want a formula, which says automatically if 2015 financials increased or decreased compared to 2014. How do we do that?
The IF formula will look like the following: 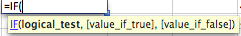
Therefore it has three parts: logical test, value if true, and value if false. In the logical test we will decide the condition that will trigger either the value if true or the value if false.
In our case, we want the formula to tell us if the financials for 2015 increased or decreased. Therefore, we are going to input in the logical test that if 2015>2014 (> meaning more than) tell us “increased”, otherwise say, “decreased”. Follow the example below:

If you want a word to appear when your condition is met, be sure to open and close the quotation marks “” in fact this will tell Excel to give you back a word. Once you press enter your report will look like the following:

As you can see cell E5 automatically shows “increased”. As for the symbol to use into Excel formulas, here the meaning of any of them: > more, < less, = equal.
I showed you just one-way of using the IF statement for simplicity sake, but you can use this function to do many other things as well.
Vlookup Function
This function is among the most used for its simplicity and effectiveness. In fact, this formula is very useful when we have a huge amount of data in our spreadsheet and we want excel to return a certain value within the range of data that we have.
The Vlookup formula will look like the following:
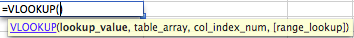
Therefore there are four parts in this formula: lookup value, table array, column index and range lookup.
Think of the Vlookup function like a way to produce a search box. Therefore, once you write something in a cell Excel will return something in another cell that you can specify.
In the lookup value we are going input the cell that we want to use as reference. First, we will tell Excel to look for a value next to our reference that will appear in the lookup value. Second, we will select the range of data where we want Excel to look for (table array). Third, we will tell Excel how many columns on the right we want it to move from the reference value found in the range of data. Fourth, And we will tell Excel if we want an exact or approximate match.
For instance, let’s say that we have Apple’s Inc. Income Statement and we want to build a search box that will automatically give us the value we are looking for, see below:

In the box where the blue arrow is pointing we are going to write what we are looking for. In the boxes where the red arrow is pointing we want Excel to automatically give us back the values for 2015 and 2014.
How do we write this formula? Follow the example below for 2015:

The lookup value will be the cell where we are going to input the item we are looking for. In the table array we will select all the data we have on the income statement. And in the column index we will input “2”.
Why do we input that number? Easy, we want Excel to return the value located two columns on the right from the beginning of the selected range of data. As for the range lookup we can leave that blank, but remember to add a coma (follow the example in the picture above).
If we want to create the same formula for 2014 we have to change the column index number to “3”, since we want excel to return us the value for 2014 rather than 2015. Therefore, you have to follow the instructions below:

As you can see now we have a nice box. This box is automated; therefore it will return the items that we are looking for in 2015 and 2014. For instance, let’s say that we want to know the revenues generated. We go on and write in cell A23 (our lookup value) “revenues” and your report will automatically show you the revenues for 2015 and 2014:

Imagine how powerful this function could be if you had a huge set of data. In this article we worked on just some of the hundred of formulas built into Excel.
If you want to learn how to use them in your financial analysis join our course here


March 10, 2016
How to Perform a Financial Analysis from Scratch and with Zero Experience
Disclaimer: the information provided in this article does not represent an investment advice, neither creates any professional relationship with its author. The information provided is for educational purposes only.
At the end of this article you will find a nice gift! Keep reading and don’t give up :)
The financial world can be pretty confusing at times. Financial news are spread anywhere; Gurus at each corner of the road are ready to tell you how to invest your money; Although they trust their advice so much that they don’t even invest on what they say you should invest.
Financial magazines offer you subscriptions for few bucks a year, and you end up buying them all. The consequence is an excess of information, that although it was supposed to make you feel like an expert it actually killed any ability to decide how to invest.
Less is more
The problem of many amateur investors is that they rely too much on external information and overwhelm themselves with useless business knowledge. They start reading newspapers, watch business channels, and to learn the technical jargon that makes them feel part of the game.
This is the “expert fallacy” in action. Although in some fields knowing more about a subject may make you better at predicting what will happen, this is not the case for the financial world. In fact, the first principle is “less is more.”
Therefore, rather than concerning yourself with knowing everything is going on in the financial world, or wasting your day collecting other people’s opinions, it is time to form your own!
The best analysis is the one you do on your own
Here the second principle: “the best analysis is the one you do on your own.” In fact, if it made sense 10-15 years ago to buy financial information, it doesn’t make sense today (save few rare exceptions).You can find reports and useful data anywhere on the web. This allows you to go straight to the source. Therefore, the objective here is to form your own unbiased opinion.
Simplicity is the maximum sophistication
Third principle: “simplicity is the maximum sophistication.” Financial charts, formulas and technical jargon serve to impress people from outside the business world. Finance is not rocket science and people from the industry know that.
For such reason, at times these tools are used more as a way to delude rather than for their real usefulness. Keep in mind that most of financial analysis (except very few formulas) is simple arithmetic and common sense, which I am sure everyone possesses. Having said that, where do we start to perform our own analysis?
Zero experience required
The term “financial analysis” may confuse you as well. If you are new to it and if you are not. You may have approached the discipline in the past and heard many new technical terms, such as LBO, IRR, DCF, CAPM, WACC and you rightly gave all up.
But are those tools necessary to understand the fundamentals of a company? The answer is a plain “NOT AT ALL!” Although finance professionals use these tools, most of the time they are used more for justifying their pay, rather than for their practicality.
I am not saying those tools are not useful at all, but to the person approaching the financial discipline, may be too overwhelming. Therefore, in this article I want to burst the myth that you have to be finance professional to be able to perform an effective analysis.
But where do we start? In this article I will show you how to analyze a company by using the DuPont equation, which is a very simple but effective tool. Keep in mind that the DuPont Analysis doesn’t tell us anything about the future, but a lot on the current state of affairs.
On the other hand, other complex financial tools, seem to tell us what will happen in the future, but they are based on assumptions, which if turn out to be wrong, can be very misleading.
Therefore, we are better off using the DuPont analysis, which is a relative simpler tool, but more useful, rather than a complex tool that gives the impression of understanding, but can lead us to greater mistakes.
The DuPont analysis uses financial ratios, which are relationships between metrics that we can find on the financial statements. Let’s start by collecting the financial data we need for the DuPont Analysis.
What to look for?
First things first, we have to find the financial data for our analysis. Where do we get it? Bloomberg? Forbes? Financial times? None of them! We just get it from the company’s website.
Before we move forward, what are the reports we want to look at? Assuming our company is listed and located in U.S., according to the SEC (Security and Exchange Commission) the reports to submit are of three kinds:
• 10K
• 10Q
• 8K
The 10K and 10Q are very similar forms, in which all the financial information (and also the business, strategic and corporate governance information) is reported. The main difference is that the 10K is an annual report, while the 10Q is a quarterly report. The 8K is a report the company submits each time there are relevant changes to communicate to the investors.
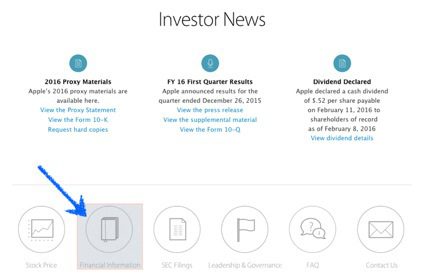
Our purpose here, to analyze the target company is to find the 10K of the firm. Assuming we want to analyze Apple Inc. financials for 2015, where do we get them? Go to www.apple.com and at the bottom of the page, on the right side, under “About Apple” click on investors:

Once you do so it will open up a page, where all the financials are shown. Our objective here is to download the 10K for 2015. Therefore click on the “financial information” icon like shown below:
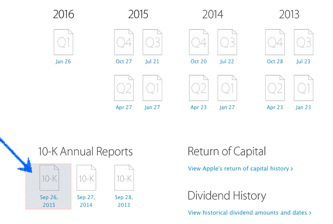
It will open up another screen, where all the financial reports are saved. Here we want to download the 10K for 2015. Follow, the instructions below and download your report:
Click on the icon and download the file. It will open up a report. Go to the table of content of the report and look for “financial statements and complementary data:”
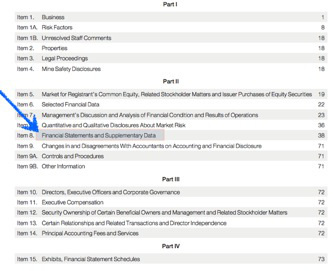
Our objective here is to find the consolidated income statement (Apple calls it statements of operations) and balance sheet. You will find these documents respectively at page 39 and 41 of the 10k and they will look like the following:
What is the purpose of the DuPont analysis?
One of the most used ratios in finance is the ROE (return on equity). This ratio is the relationship between the net income, which is the bottom line of the income statement and the shareholders’ equity (capital endowed by shareholders).
This ratio explains what is the level of return generated for each dollar invested. For example, a 20% ROE means that for each dollar invested into the business 20 cents are earnings.
Keep in mind that returns are not dividends. In other words, the profits generated by the firm will be not automatically distributed to shareholders. Indeed, the part of profits distributed to shareholders is called dividends.
Often a company that produces high returns also distributes higher dividends compared to non-profitable companies (true in most cases). In short, a company that is able to produce a high ROE usually is also well perceived by investors.
There is a drawback to this ratio tough. The ROE usually increases for three reasons: the net income increased, the shareholders’ equity decreased or both conditions are met. While, the first case is most of the time a good sign, the other condition (the shareholders equity decreased) it isn’t always a good sign:


In fact, an increase in net income is usually due to improved profitability or better efficiency in the business operations. Instead, a decrease in shareholders’ equity it is usually associated to a higher leverage, which can be bad for the company in the long run.
Therefore the objective here is to see how the ROE evolved overtime. Did it increase from 2014? If so, why?
What data do we need?
To perform the DuPont analysis we need to perform three ratios:
Net Margin, given by Net Profits over Sales. This ratio explains how profitable a company is. In short, when firms are able to have excess money left, after paying for their expenses, interests and taxes, this is called net profits.
A high net margin is a good sign and usually this happens for two main reasons. On one hand, when the firm is able to charge a higher price for its products and services, or sell a high quantity of them, the profitability improves.
On the other hand, when a firm is able to reduce its overall expenses, its profitability improves. For instance, the company may be able to get a better price for the raw materials, due to its good relationship with suppliers. Therefore, through the net margin we will check the level of profitability of the firm.
Asset Turnover, given by sales over total assets. This ratio explains the ability of the firm to use its assets to generate revenues. In other words, when a company buys an asset, it does that to improve its revenues in the future.
Therefore, from a firm, which is efficiently managed, we expect that with the increase in value of its assets, also the revenues will grow. For instance, Apple opens new retail stores (increased assets) because it wants to expand its revenue growth. Furthermore, we can expect that opening new retail stores, will positively impact the revenues of the firm. If this condition is met the company’s assets are well managed.
This ratio will be expressed as number and will tell us how much revenues are generated for each dollar invested in assets. For instance, an asset turnover of 0.50, means that for each dollar invested in asset are produced 50 cents in revenues.
Financial Leverage, which is given by total assets over equity. This ratio will be expressed in percentage and it will explain the amount of equity for the assets owned by the organization.
The higher the number, the more debt has been pumped into the company, and the riskier the company may become overtime. Usually leverage itself is not a bad thing. Actually, in many circumstances using debt is way cheaper than using your own capital.
For instance, if you try to buy a house, which costs $100K, you can put 100% capital or use 50% capital and borrow 50% from the bank. Assuming you will sell the house in one year at $120K your ROI (return on investment) will considerably increase by using leverage.
For instance, if you sell the house for $120K after putting $100K of capital, your ROI before interest and taxes will be 20%, given by the profit of the sale (120K – 100K) over the initial capital invested (100K).
In the second scenario, you still sell the house for $120K, but in this case your ROI before interest and taxes will be 40%. In short, you used leverage (debt) to double your ROI, and this didn’t bring any downside. If financial leverage is not necessarily a bad thing, it starts to be dangerous when interest payments rise steeply and swipe your profits away.
To sum up, given the three ratios above, we need the following data from the financial statements of Apple Inc.: Sales, Net Income, Total Assets, and Equity. We are ready to move forward.
Extrapolate the data from the financial statements
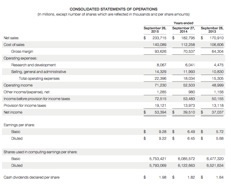
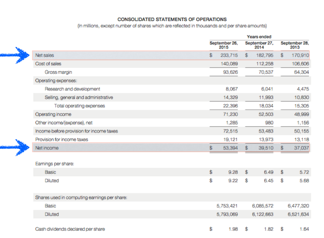
We are going to get the sales and net income from the income statement or statement of operations. Furthermore, we are going to get the total assets and equity from the balance sheet. We need the data for 2015 and 2014, to understand the trend.
Let’s get sales and net income from the income statement, like in the example below:
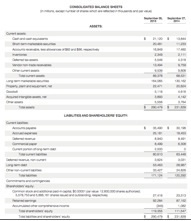
Then let’s get total assets and total equity from the balance sheet, like in the example below:
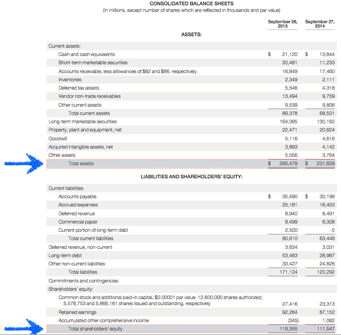
We have the financial data, we can move forward.
Perform the DuPont analysis
We are going to perform this DuPont analysis in three easy steps. In step number one we are going to compute the ROE for 2014 and 2015. In step number two we are going to run the three ratios for our DuPont Analysis. In the third step we are going to draw some conclusions.
Step one: ROE for 2014 – 2015
To compute our ROE we are going to take the net income and then divide it by the total equity. Usually it is even more appropriate to take the average equity for the current year and the previous year. This is because equity can change considerably between one year and the other. In this specific case tough, to keep it simple we are going to use the equity for the current year.
ROE 2015 = 53,394/119355 = 44.7%
ROE 2014 = 39,510/111547 = 35.4%
The thing that you notice immediately is that the ROE increased by almost 10% from 2014 to 2015, it means a 26% in one year! Pretty astonishing!
We want to know why this happened. We are going to find out in the second step.
Step two: Net Margin, Asset Turnover, Financial Leverage for 2014 and 2015
We are going to complete this step and divide it in three sub-steps:
Sub-step one: we are going to compute our net margin
Net margin for 2015 = 53,394/233,715 = 22.8%
Net margin for 2014 = 39,510/182,795 = 21.6%
The net margin for 2015 is 22.8%, it means that Apple Inc. has still 22.8% of money left after paying all its suppliers, business expenses, interests (although Apple didn’t pay any in 2015) and taxes. In addition, the profitability slightly improved from 2014 to 2015 (5.7% increase).
Sub-step two: also in this case, it is common to use the average total assets, but for simplicity we are going to take the total assets for the current year. We are going to compute the asset turnover
Asset turnover for 2015 = 233,715/290,479 = $0.80
Asset turnover for 2014 = 182,795/231839 = $0.79
Remember that this ratio is expressed as number, that we will interpret as a $ amount. In this case, Apple Inc. in 2015 produced 80 cents of revenues for each dollar of asset invested. The asset turnover grew by 2% in 2015, compared to 2014.
Sub-step three: we are going to compute the financial leverage:
Financial leverage for 2015 = 290,479/119,355 = 243.4%
Financial leverage for 2014 = 231,839/111,547 = 207.8%
The financial leverage in 2015 is 243.4%, which means that most of the company’s assets have been financed through debt.
Indeed, total liabilities (all the debt outstanding of the firm) represents 59% of the total assets. The financial leverage of the company increased by 17% in 2015.
We are ready to move forward and draw some conclusions here.
Step three: conclusions from DuPont analysis
By performing the DuPont Analysis it came out that although the ROE increased by 26% in 2015, this happened mainly due to financial leverage. In short, Apple Inc. increased its level of debt considerably in the last year while its shareholders’ equity didn’t keep the pace.
In fact, profitability and asset efficiency respectively increased by 6% and 2% in 2015. Instead, financial leverage increased by 17%!
This is not necessarily a bad thing. In fact, it seems that Apple will be able to manage its interest payments in the future, given its high profitability. On the other hand, due to this increased debt burden we may expect to see less profits in the future. We may go even further and check in the 10K why Apple Inc. is using debt to increase its ROE but we will stop here for simplicity sake.
Conclusions
In this article I wanted to show you that it is possible also for the non-finance professional to make his own analyses by using tools, which are simple and effective.
What we did so far was to take some metrics from the main financial statements to understand what was going on with Apple Inc. ROE and we ended up analyzing profitability, asset use and financial leverage of the company. This is of course part of the picture, but it is a good starting point.
If so far you thought that learning financial analysis was impossible for you, you may want to reconsider that.
To learn financial analysis from scratch to professional level click here.


How to perform a financial analysis from scratch and with zero experience
Disclaimer: the information provided in this article does not represent an investment advice, neither creates any professional relationship with its author. The information provided is for educational purposes only.
The financial world can be pretty confusing at times. Financial news are spread anywhere; Gurus at each corner of the road are ready to tell you how to invest your money; Although they trust their advice so much that they don’t even invest on what they say you should invest.
Financial magazines offer you subscriptions for few bucks a year, and you end up buying them all. The consequence is an excess of information, that although it was supposed to make you feel like an expert it actually killed any ability to decide how to invest.
Less is more
The problem of many amateur investors is that they rely too much on external information and overwhelm themselves with useless business knowledge. They start reading newspapers, watch business channels, and to learn the technical jargon that makes them feel part of the game.
This is the “expert fallacy” in action. Although in some fields knowing more about a subject may make you better at predicting what will happen, this is not the case for the financial world. In fact, the first principle is “less is more.”
Therefore, rather than concerning yourself with knowing everything is going on in the financial world, or wasting your day collecting other people’s opinions, it is time to form your own!
The best analysis is the one you do on your own
Here the second principle: “the best analysis is the one you do on your own.” In fact, if it made sense 10-15 years ago to buy financial information, it doesn’t make sense today (save few rare exceptions).You can find reports and useful data anywhere on the web. This allows you to go straight to the source. Therefore, the objective here is to form your own unbiased opinion.
Simplicity is the maximum sophistication
Third principle: “simplicity is the maximum sophistication.” Financial charts, formulas and technical jargon serve to impress people from outside the business world. Finance is not rocket science and people from the industry know that.
For such reason, at times these tools are used more as a way to delude rather than for their real usefulness. Keep in mind that most of financial analysis (except very few formulas) is simple arithmetic and common sense, which I am sure everyone possesses. Having said that, where do we start to perform our own analysis?
Zero experience required
The term “financial analysis” may confuse you as well. If you are new to it and if you are not. You may have approached the discipline in the past and heard many new technical terms, such as LBO, IRR, DCF, CAPM, WACC and you rightly gave all up.
But are those tools necessary to understand the fundamentals of a company? The answer is a plain “NOT AT ALL!” Although finance professionals use these tools, most of the time they are used more for justifying their pay, rather than for their practicality.
I am not saying those tools are not useful at all, but to the person approaching the financial discipline, may be too overwhelming. Therefore, in this article I want to burst the myth that you have to be finance professional to be able to perform an effective analysis.
But where do we start? In this article I will show you how to analyze a company by using the DuPont equation, which is a very simple but effective tool. Keep in mind that the DuPont Analysis doesn’t tell us anything about the future, but a lot on the current state of affairs.
On the other hand, other complex financial tools, seem to tell us what will happen in the future, but they are based on assumptions, which if turn out to be wrong, can be very misleading.
Therefore, we are better off using the DuPont analysis, which is a relative simpler tool, but more useful, rather than a complex tool that gives the impression of understanding, but can lead us to greater mistakes.
The DuPont analysis uses financial ratios, which are relationships between metrics that we can find on the financial statements. Let’s start by collecting the financial data we need for the DuPont Analysis.
What to look for?
First things first, we have to find the financial data for our analysis. Where do we get it? Bloomberg? Forbes? Financial times? None of them! We just get it from the company’s website.
Before we move forward, what are the reports we want to look at? Assuming our company is listed and located in U.S., according to the SEC (Security and Exchange Commission) the reports to submit are of three kinds:
• 10K
• 10Q
• 8K
The 10K and 10Q are very similar forms, in which all the financial information (and also the business, strategic and corporate governance information) is reported. The main difference is that the 10K is an annual report, while the 10Q is a quarterly report. The 8K is a report the company submits each time there are relevant changes to communicate to the investors.
Our purpose here, to analyze the target company is to find the 10K of the firm. Assuming we want to analyze Apple Inc. financials for 2015, where do we get them? Go to www.apple.com and at the bottom of the page, on the right side, under “About Apple” click on investors:
Once you do so it will open up a page, where all the financials are shown. Our objective here is to download the 10K for 2015. Therefore click on the “financial information” icon like shown below:
It will open up another screen, where all the financial reports are saved. Here we want to download the 10K for 2015. Follow, the instructions below and download your report:
Click on the icon and download the file. It will open up a report. Go to the table of content of the report and look for “financial statements and complementary data:”
Our objective here is to find the consolidated income statement (Apple calls it statements of operations) and balance sheet. You will find these documents respectively at page 39 and 41 of the 10k and they will look like the following:
What is the purpose of the DuPont analysis?
One of the most used ratios in finance is the ROE (return on equity). This ratio is the relationship between the net income, which is the bottom line of the income statement and the shareholders’ equity (capital endowed by shareholders).
This ratio explains what is the level of return generated for each dollar invested. For example, a 20% ROE means that for each dollar invested into the business 20 cents are earnings.
Keep in mind that returns are not dividends. In other words, the profits generated by the firm will be not automatically distributed to shareholders. Indeed, the part of profits distributed to shareholders is called dividends.
Often a company that produces high returns also distributes higher dividends compared to non-profitable companies (true in most cases). In short, a company that is able to produce a high ROE usually is also well perceived by investors.
There is a drawback to this ratio tough. The ROE usually increases for three reasons: the net income increased, the shareholders’ equity decreased or both conditions are met. While, the first case is most of the time a good sign, the other condition (the shareholders equity decreased) it isn’t always a good sign:
In fact, an increase in net income is usually due to improved profitability or better efficiency in the business operations. Instead, a decrease in shareholders’ equity it is usually associated to a higher leverage, which can be bad for the company in the long run.
Therefore the objective here is to see how the ROE evolved overtime. Did it increase from 2014? If so, why?
What data do we need?
To perform the DuPont analysis we need to perform three ratios:
Net Margin, given by Net Profits over Sales. This ratio explains how profitable a company is. In short, when firms are able to have excess money left, after paying for their expenses, interests and taxes, this is called net profits.
A high net margin is a good sign and usually this happens for two main reasons. On one hand, when the firm is able to charge a higher price for its products and services, or sell a high quantity of them, the profitability improves.
On the other hand, when a firm is able to reduce its overall expenses, its profitability improves. For instance, the company may be able to get a better price for the raw materials, due to its good relationship with suppliers. Therefore, through the net margin we will check the level of profitability of the firm.
Asset Turnover, given by sales over total assets. This ratio explains the ability of the firm to use its assets to generate revenues. In other words, when a company buys an asset, it does that to improve its revenues in the future.
Therefore, from a firm, which is efficiently managed, we expect that with the increase in value of its assets, also the revenues will grow. For instance, Apple opens new retail stores (increased assets) because it wants to expand its revenue growth. Furthermore, we can expect that opening new retail stores, will positively impact the revenues of the firm. If this condition is met the company’s assets are well managed.
This ratio will be expressed as number and will tell us how much revenues are generated for each dollar invested in assets. For instance, an asset turnover of 0.50, means that for each dollar invested in asset are produced 50 cents in revenues.
Financial Leverage, which is given by total assets over equity. This ratio will be expressed in percentage and it will explain the amount of equity for the assets owned by the organization.
The higher the number, the more debt has been pumped into the company, and the riskier the company may become overtime. Usually leverage itself is not a bad thing. Actually, in many circumstances using debt is way cheaper than using your own capital.
For instance, if you try to buy a house, which costs $100K, you can put 100% capital or use 50% capital and borrow 50% from the bank. Assuming you will sell the house in one year at $120K your ROI (return on investment) will considerably increase by using leverage.
For instance, if you sell the house for $120K after putting $100K of capital, your ROI before interest and taxes will be 20%, given by the profit of the sale (120K – 100K) over the initial capital invested (100K).
In the second scenario, you still sell the house for $120K, but in this case your ROI before interest and taxes will be 40%. In short, you used leverage (debt) to double your ROI, and this didn’t bring any downside. If financial leverage is not necessarily a bad thing, it starts to be dangerous when interest payments rise steeply and swipe your profits away.
To sum up, given the three ratios above, we need the following data from the financial statements of Apple Inc.: Sales, Net Income, Total Assets, and Equity. We are ready to move forward.
Extrapolate the data from the financial statements
We are going to get the sales and net income from the income statement or statement of operations. Furthermore, we are going to get the total assets and equity from the balance sheet. We need the data for 2015 and 2014, to understand the trend.
Let’s get sales and net income from the income statement, like in the example below:
Then let’s get total assets and total equity from the balance sheet, like in the example below:
We have the financial data, we can move forward.
Perform the DuPont analysis
We are going to perform this DuPont analysis in three easy steps. In step number one we are going to compute the ROE for 2014 and 2015. In step number two we are going to run the three ratios for our DuPont Analysis. In the third step we are going to draw some conclusions.
Step one: ROE for 2014 – 2015
To compute our ROE we are going to take the net income and then divide it by the total equity. Usually it is even more appropriate to take the average equity for the current year and the previous year. This is because equity can change considerably between one year and the other. In this specific case tough, to keep it simple we are going to use the equity for the current year.
ROE 2015 = 53,394/119355 = 44.7%
ROE 2014 = 39,510/111547 = 35.4%
The thing that you notice immediately is that the ROE increased by almost 10% from 2014 to 2015, it means a 26% in one year! Pretty astonishing!
We want to know why this happened. We are going to find out in the second step.
Step two: Net Margin, Asset Turnover, Financial Leverage for 2014 and 2015
We are going to complete this step and divide it in three sub-steps:
Sub-step one: we are going to compute our net margin
Net margin for 2015 = 53,394/233,715 = 22.8%
Net margin for 2014 = 39,510/182,795 = 21.6%
The net margin for 2015 is 22.8%, it means that Apple Inc. has still 22.8% of money left after paying all its suppliers, business expenses, interests (although Apple didn’t pay any in 2015) and taxes. In addition, the profitability slightly improved from 2014 to 2015 (5.7% increase).
Sub-step two: also in this case, it is common to use the average total assets, but for simplicity we are going to take the total assets for the current year. We are going to compute the asset turnover
Asset turnover for 2015 = 233,715/290,479 = $0.80
Asset turnover for 2014 = 182,795/231839 = $0.79
Remember that this ratio is expressed as number, that we will interpret as a $ amount. In this case, Apple Inc. in 2015 produced 80 cents of revenues for each dollar of asset invested. The asset turnover grew by 2% in 2015, compared to 2014.
Sub-step three: we are going to compute the financial leverage:
Financial leverage for 2015 = 290,479/119,355 = 243.4%
Financial leverage for 2014 = 231,839/111,547 = 207.8%
The financial leverage in 2015 is 243.4%, which means that most of the company’s assets have been financed through debt.
Indeed, total liabilities (all the debt outstanding of the firm) represents 59% of the total assets. The financial leverage of the company increased by 17% in 2015.
We are ready to move forward and draw some conclusions here.
Step three: conclusions from DuPont analysis
By performing the DuPont Analysis it came out that although the ROE increased by 26% in 2015, this happened mainly due to financial leverage. In short, Apple Inc. increased its level of debt considerably in the last year while its shareholders’ equity didn’t keep the pace.
In fact, profitability and asset efficiency respectively increased by 6% and 2% in 2015. Instead, financial leverage increased by 17%!
This is not necessarily a bad thing. In fact, it seems that Apple will be able to manage its interest payments in the future, given its high profitability. On the other hand, due to this increased debt burden we may expect to see less profits in the future. We may go even further and check in the 10K why Apple Inc. is using debt to increase its ROE but we will stop here for simplicity sake.
Conclusions
In this article I wanted to show you that it is possible also for the non-finance professional to make his own analyses by using tools, which are simple and effective.
What we did so far was to take some metrics from the main financial statements to understand what was going on with Apple Inc. ROE and we ended up analyzing profitability, asset use and financial leverage of the company. This is of course part of the picture, but it is a good starting point.
If so far you thought that learning financial analysis was impossible for you, you may want to reconsider that.
To learn financial analysis from scratch to professional level click on the image below…

February 16, 2016
How to Start a Business with no Money Down
The dream of many is to be their own bosses, work few hours per week, and have the chance to spend the rest of the day doing the things we are passionate about. But as the say goes “work hard and you will become rich.” Does this say really work?
It is true that working hard is a good thing, but do you really want to work hard all your life and then reap the benefits (maybe) later in life? When you are too old to enjoy anything at all? Therefore although working hard is the prerequisite, working smart is the nonlinear enhancer that can bring most of the benefits. Thus, where do we start?
Ideas are overrated
The past has been built over ideas. Ideas have changed the world; ideas are the foundation of business. Is this really true? In part it is, although we like to believe that great ideas change the world, and that those who are able to conceive them will thrive, this is half of the story.
Of course, that sounds very poetic, but how far from the truth is that? We humans are hard-wired to have ideas, as Thomas Edison used to say, “I pull ideas out of the air.” Therefore creativity is far from being something special but rather something common to all human beings. Thus, why some ideas succeed while others don’t?
From Theory-land to reality
Many of us have the feelings at all times that people stole ideas from us. It may not be rare for some of us to have the feeling at times to have thought about creating Tesla or SpaceX even before Elon Musk did.
With hindsight the idea of creating a company, which produces electric cars, makes a lot of sense and of course many of us knew that electric cars would have been successful sooner or later. But then why didn’t any of us start a venture called Tesla?
What really makes the difference between an idea, which succeeds, and one, which does not, is actually the willingness to test that idea in the real world, therefore to transition from theory-land to reality. Elon Musk had the willingness to test ideas that seemed to make sense in Theory-land but that are very hard to prove in the real world.
Are ideas really in the air?
Thomas Edison before discovering one of his greatest inventions, the light bulb, had to actually try and fail 10,000 before finding out what worked and what not. Real story or legend, the point here is that ideas are worth nothing if there aren’t people willing to test them out, while being ready to fail many times before that idea may work.
In addition, history has shown us that many times great inventions come out of serendipity rather than a preconceived plan. Take Christophorus Columbus, which was persuaded to navigate toward India before finding out to be on a new continent (although we are not sure if he ever realized he was in America).
In other words, sometimes to revolutionize the world there is no need for an idea, but rather the willingness of few men to bring an already existing idea to reality. But who are those adventurers, which are willing to take the leap?
Welcome to the entrepreneurial age
We all assume that history goes from ebb and flow and in part this is true. In ancient history, although Greeks were the fathers of our civilization, Hellenism (the diffusion of the Greek civilization) happened thanks to Macedonians, a small, barbarian (Greeks called everyone’s barbarian) population, located North of Greece.
Indeed, while Greeks lived in Theory-land for many centuries, Macedonians and in particular Alexander the Great in just few decades spread the Hellenism throughout the ancient world. Alexander the Great was just one of the main examples in history of people with the entrepreneurial mindset.
Another myth to bust is that to be an entrepreneur you got to change the world! Although Alexander the Great revolutionized the known world (at that time), to become an entrepreneur there is no need of such extravagant plans. Many opportunities lie in front of us and we don’t even realize.
The opportunity is right there
If I asked you, “what is the best way to go from A to B?” You would mock me by thinking how trivial this question is. After pausing for few instants you would answer without hesitation “of course through a straight-line.” Although many of us get the concept in Theory-land few of us actually apply this concept in reality.
This is due to our domain dependency. In short, we seem to be able to grasp a concept theoretically but then we seem not to be able to bring this concept in the real world. With no surprise many academics may have an incredible expertise of their subject, but no clue of how that subject applies in the real world.
Therefore, the point here is that you can start in this moment to be an entrepreneur if you have the willingness to do so. I know what is the first objection you are going to move is, “Hey man, all you are saying here is very cool, but how am I supposed to start a business if I have no money?”
Nothing down
Robert Allen in his book “Nothing Down” tells us how to start a real estate business with no money down. On the other hand Robert Kiyosaki also tells us what are the principles to follow to become a real estate investors.
Few principles are important when starting as a real estate beginner investor. Three of those principles are:
You have to buy your real estate at 30% discount (at least)
You are not buying it for yourself
A property is an investment just if it has positive cash flows
As for the first point, anyone would agree with that. But how can you find a property, which is selling at a 30% discount? One of the most basic principles, which amateur investors seem not to grasp is that you have to make a deal when you buy rather than when you sell.
In other words, most amateurs make the mistake of buying properties and hoping them to increase in value overtime. Indeed, you do not have to accept the price set by the seller as given, but rather to challenge that price.
Good real estate deals are available at anytime. Therefore, do not get emotional if you are losing what it seems at first to be a good deal. Sure enough you will find an even better deal moving forward.
How to find good deals? You have to find a motivated seller, someone who is trying to cash out, and that would accept 30% to 50% less on the property. Although occasional, those cases are less extra-ordinaries that you might think.
Here we go to our second point, which is “you are not buying the house for yourself.” Too often when buying a property prospective buyers get too attached to it and they end up living in the property rather than treating it as an investment. Thus, once you buy the property, rent it. The property is a tool to become financial free. Let the property work for you rather than you sacrificing your life for the property.
The third and crucial point that few really seem to understand is that “the property is not an investment unless it generates future cash flows for you.” In other words, assuming you buy an apartment for $150,000 and get a mortgage for the full amount; assuming a monthly rate of $1,000 you want to rent the place out for at least $1,200. In short, the rent has to cover for the mortgage monthly rate plus all the other expenses, so that eventually will have a positive cash flow.
Millionaire in three years
If we continue our thought experiment, and buy several apartments with the above method, eventually we may end up with few apartments, which also generate positive cash flows, in three years time. Then, why not using the equity of those apartments to actually buy an entire building? Although it all seems so easy, it probably is.
Not all that glitters is gold
Let’s clarify; both Kiyosaki and Allen were able to build their wealth on real estate (at least that what they claim) but also through their training companies. Therefore, for how much we can trust their judgment we have also to admit that strategies, which work in US, may not work in other countries.
Although, the three principles explained in this article can instead be applied to any real estate deal. Therefore, the point here is for you to change your mindset before approaching the real estate market or any other kind of investment. But the central point is that you got to act rather than wait for that revolutionary idea to come.
Resources
To know more about real estate investing check out:
Nothing Down for the 2000s: Dynamic New Wealth Strategies in Real Estate, Robert Allen
The Real Book of Real Estate: Real Experts. Real Stories. Real Life, Robert T. Kiyosaki
The Four-Week MBA is an online community which purpose is to share educational resources. Therefore, the information contained in this article is not meant as an investment advice.


