
Russell Roberts's Blog, page 1426
August 4, 2011
Reich video
A number of people have sent me this video by Robert Reich that purports to explain "The Truth About the Economy" in under two minutes.
I stopped after 31 seconds when he said the economy has doubled in size since 1980 but wages are flat.
1. The deflators for GDP and wages are different. The one for wages overstates inflation–it does a bad job correcting for quality improvements. (The GDP deflator may also overstate inflation, but my point is that wages aren't flat. My impression is that the GDP deflation ends up weighting computers differently but that's an issue for another post.)
2. Wages aren't what you want to use. You want to use compensation which includes benefits. Benefits have become a bigger part of compensation since 1980. By leaving out health benefits and using a deflator that includes health care inflation, you further bias the calculation.
3. There has been a great deal of immigration since 1980. The average immigrant is lower skilled than the average native worker. That pulls down the average and the median but doesn't mean that the average worker is falling behind.
More here.


A Keynesian Theory of Aging
Don recently linked to an article I wrote that included my picture. One commenter, rbd, responded to the picture rather than the article:
One thing is quite evident: Russ needs to update his profile picture! He looks like he's 37, or so.
I have to confess that I do look older than the photo. I'm 56 and there's no way I look 37. In fact, I teased the editor about using that picture–she discovered it on the web and I told her it was out of date…
But Don responded to rbd:
Serving on the GMU Econ faculty is rather like swimming in the Fountain of Youth….
Of course he is right. So the puzzle is why do I look older than when I first arrived at GMU? And the answer is that if it weren't working at GMU, I'd look even older than I do.


Hoover and DeLong
Brad DeLong points out that Hoover vetoed increased spending on veterans in 1931, then Congress overrode the veto. So Brad asks:
If Congress in 1931 passes a large benefit program for war veterans, and if Hoover vetoes it, and if Congress overrides the veto, and if the money is spent, does Hoover increase spending?
The title of DeLong's post is "Fiscal Policy During the Great Depression." Which is what I'm interested in. I'm interested in what happened to overall spending, not in cherry-picking one episode where Hoover vetoed one particular spending increase. Brad is right in that Hoover is not completely responsible for what happened to spending during his watch. It would be interesting to see how eager he was to increase spending. But there is the independent question of what happened to spending at the onset of the Great Depression. The myth is that spending went down. What actually happened is that spending went up between 1929 and 1933. As I wrote before:
Here are the levels of federal government spending (from here, Series Y 457-465) between 1924 and 1934 in billions of dollars
1924 $2.9
1925 $2.9
1926 $2.9
1927 $2.9
1928 $3.0
1929 $3.1
1930 $3.3
1931 $3.6
1932 $4.7
1933 $4.6Hoover took office in March of 1929. FDR took office in March of 1933. The data on spending are fiscal years, that ended in June 30 for this period. So Hoover's budgets are roughly 1930 through 1933. Of course you have to correct for inflation. Or deflation as the case may be. In those years it was deflation. Prices of government purchases of goods and services (from here, Table 41) fell between 1930 and 1933 by roughly 10%. So Hoover actually increased spending by over 50% in real terms.
I wrote loosely. I should have said government spending increased 50% in real terms during the Hoover Administration. He did not single-handedly raise spending. He needed Congress to do that, and as DeLong points out, sometimes he opposed spending increases.
Brad uses this chart to look at Hoover and fiscal policy:
[image error]
The implication of the chart is that there was fiscal stimulus in 1931 despite Hoover–the red line shows what happened and the blue line what would of happened if Hoover's initial veto had not been overridden. There are two problems with the chart. The first is that no source is given for the data so I cannot uncover why the numbers conflict with the numbers I give above. Second, the numbers are in nominal terms, they are uncorrected for changes in the price level. As I pointed out above, there was serious deflation.
I cannot help but note this wise observation about bloggers who don't correct nominal numbers for inflation (or deflation).
And as I have written in the past, I am happy to find out that the numbers I cite aren't the right ones for some reason and will post any corrections that show, corrected for changes in the price level, that fiscal policy was contractionary (according to the standard interpretations of government spending) during Hoover's Administration. But the numbers I see show the opposite.


August 3, 2011
Quotation of the Day…
… is from the late G. Warren Nutter, a University of Virginia economist who from the late 1960s through the early 1970s served Assistant Secretary of Defense:
In the academic world, you think now and decide never; and in the government, it's just exactly the other way around.
Explains a lot.
Nutter here is quoted in the fascinating paper by William R. Allen (of Alchian & Allen fame), "Economics, Economists, and Economic Policy: Modern American Experiences," History of Political Economy (Spring 1977), Vol. 9, pp. 48-88. This Nutter quotation is found on page 51.


Summerstime
Russ, James Pethokoukis, and I were each asked by Reuters to contribute short responses to Larry Summers's reflection on the debt-ceiling resolution.


Fabulous picture, but…
James Fallows called this picture which uses numbers from the CBO and the Center on Budget and Policy Priorities, the "chart that should accompany all discussions of the debt ceiling:
The debt ceiling debate is over for now, but I found this to be a very useful chart. Fallows has some interesting observations but one of his points is that the Bush tax cuts are the "largest single contributor" to the Federal deficit.
That's one way to look at it. A richer perspective is that during the Bush Administration, the government spent like a drunken sailor while cutting taxes. So while the tax cuts are measured to have decreased revenue by their full amount (I assume that the CBO and CBPP neglect any incentive effects of lower rates), you can't help but be struck by the magnitude of the spending increases. So another way to interpret the chart is that roughly 2/3 of the increases in deficit in the Bush years came from spending. A lot of spending.
But for me the more interesting (and misleading) aspect of the chart is the "modest" increases in the deficit coming from Obama, a "mere" $1.44 trilion. There's a pernicious assumption built into that conclusion, that all previous spending is "mandatory." I put that word in quotes because it is used all the time in a way that has nothing to do with its use in the English language.
(I am reminded of the scene from the Princess Bride when Inigo says "You keep using that word. I do not think it means what you think it means." Here's a clip.)
Mandatory in English means you have to. Mandatory in Washington-speak means optional but let's pretend otherwise.
So Obama stays in Iraq, stays in Afghanistan, stays in Guantanamo Bay and opens a war with Libya. What does the chart say? He gets some "Savings" (modest, but real evidently) on defense spending. Notice that the Bush part of the chart includes wars and defense. I assume that any changes in the wars under Obama (and I have no idea if spending has increased or decreased on net) aren't in the chart because other than Libya, they aren't new. They aren't "New Policies."
So the decision to keep the insanity of Bush's spending is irrelevant. The chart acts as if Obama is stuck with that. That's mandatory. It isn't his. And so the decision to add another $1.44 trillion seems something like small potatoes. But that's a terrible way to look at it. The same point can be made about the Bush tax cuts. Obama voted to extend them. Why aren't they part of his fiscal record?
Suppose you take a loan and buy a Lexus. You decide to buy a car for your wife. You keep the Lexus and take out a second loan to buy her a Ferrari. Your wife loses her job, so you're struggling to make the payments on both cars and your teenaged daughter asks for a car and you buy her an Acura. So what's the source of your impending bankruptcy? It can't be the Acura, right? That's only a small part of your debt!
The chart is misleading on two counts. First, it implies that you can look at Obama's contribution to the debt independently of what went before. And second, it implies that what went before has nothing to do with Obama. But when you're living beyond your means and they're about to take your Ferrari, you don't buy an Acura, even if it's a nice car and relatively affordable.


Kling on metaphors
I have long been a fan of the rainforest as a better metaphor of the economy than an engine. But what I really like about this post of Arnold Kling's is his summary of the spectrum of views of government action–Mafia Godfather vs. Day Care Center Supervisor.


Another Open Letter to an Aggressive E-Mail Correspondent
Dear Mr. or Ms. WorkingAmerican:
In your e-mail – inspired by my account of my grandfather – you speculate that my late grandparents and parents would be "ashamed" of me were they still alive to see me (as you put it) "apologize for multinational corporations, the mega rich and other economic vermin." Unable to "fathom" how I "join ranks with the sworn enemies of poor and working Americans," you speculate that I am "paid well" to be a "mouthpiece for the exploiters."
In fact, because (as I gather you're aware) my parents both died only very recently, I can report confidently that neither of them were ashamed of me. Quite the opposite. Save for my support of open immigration and my disgust at most of the ways the U.S. military has been used in recent decades, my public writings enjoyed the strong approval of both of my parents.
A true story: when my father was laid off from his shipyard job in the mid-1970s, a neighbor who came to my parents' house for coffee one evening encouraged my mother to apply for Food Stamps. I'll never forget the look on mom's face and her response.
Her face alternated between expressions of disbelief (that anyone would suggest such a thing to her) and anger (that anyone would suppose that she would stoop to living off of the dole). "Jenny!" mom said firmly, "I don't care how bad things get, I'm not about to apply for Food Stamps. I'd be ashamed to use those things."
And ashamed she (and my father, and my grandparents) would indeed have been. It was shame sparked not from reading Milton Friedman or listening to Rush Limbaugh (neither of which they ever did); it came from the values that were instilled in them since childhood.
The world needs more people, like my parents and grandparents, who are ashamed to live off of government welfare.
So in fact, Mr. or Ms. WorkingAmerican, the values that you find so disagreeable in my writings are not values different from those of my parents; they are the very same values that guided mom and dad and that they passed on to their four children. My parents would be ashamed of me if I were instead (to again use your word) a "mouthpiece" for all of those who encourage individuals' dependency upon the state.
Sincerely,
Donald J. Boudreaux


It Was 30 Years Ago Today….
Here's a letter to the New York Times:
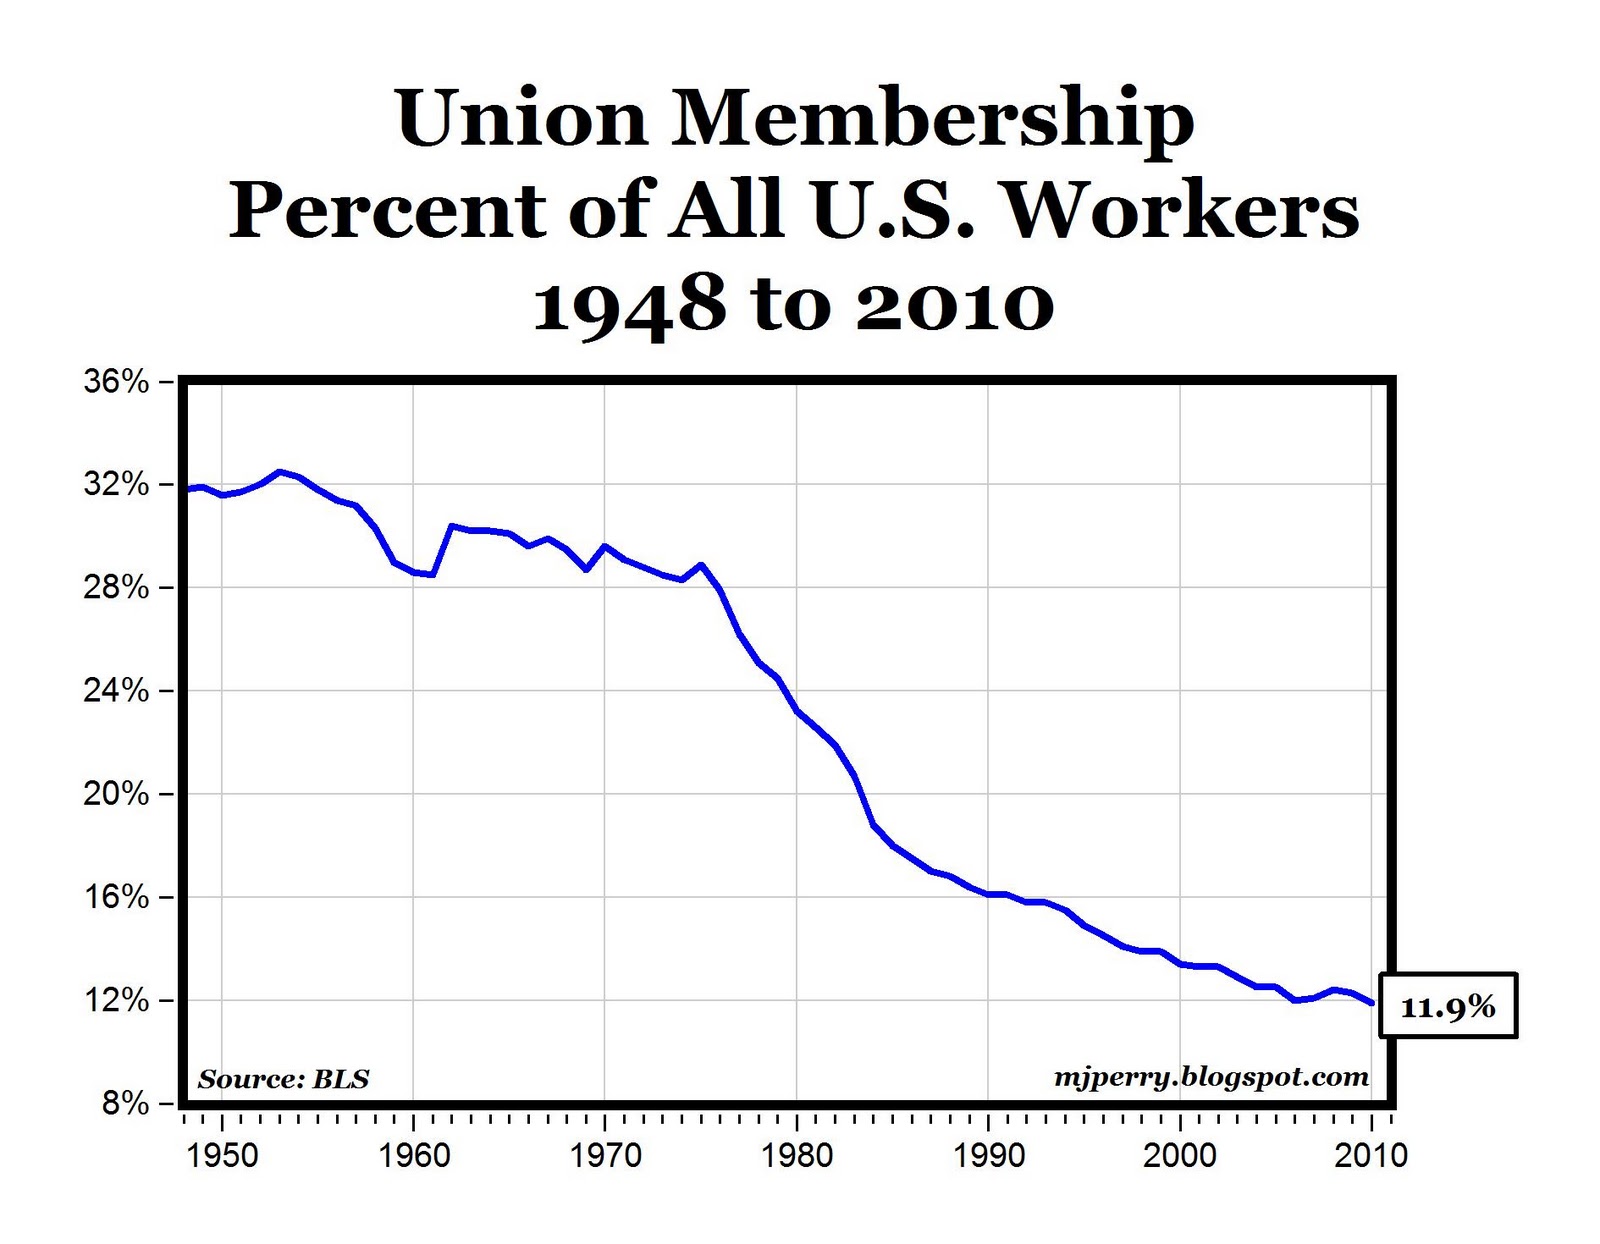
Joseph McCartin describes Ronald Reagan's firing of the striking PATCO workers in 1981 as "the strike that busted unions" ("The Strike That Busted Unions," Aug. 3).
Historian McCartin's history is flawed.
Union membership as a percentage of all U.S. workers peaked at just above 32 percent in 1954. Since then this figure has steadily fallen. Today the percentage of all U.S. workers who are unionized is just under 12 percent, with no change in the rate of decline occurring in the early 1980s. Indeed, the rate of decline, if anything, eased a bit starting in 1983. As for the percentage of government workers who are unionized, that figure has remained largely unchanged since the early 1980s rather than – as one would expect were Prof. McCartin's tale true – fallen.
Regardless of its merits, if Reagan's firing of PATCO workers was a landmark event in "busting unions," that fact doesn't show up in the data.
Sincerely,
Donald J. Boudreaux


Russell Roberts's Blog

- Russell Roberts's profile
- 39 followers


![[image error]](http://cafehayek.com/site/wp-content/uploads/2011/08/DeLongHoover.jpg)
![[image error]](http://cafehayek.com/site/wp-content/uploads/2011/08/24editorial_graph2-popup-thumb-560x622-58477.jpg)