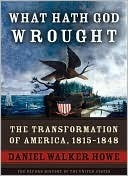
This graph shows how much the federal government spent each year on transportation infrastructure, such as canals, roads, dredging of rivers and harbors, and lighthouses. It indicates a flurry of activity right after the War of 1812, then a marked increase during John Quincy Adams’s administration, which soared even higher during the administrations of Jackson and Van Buren until the Panic of 1837 curtailed government revenues and consequently expenses.