
Brian Potter's Blog, page 2
October 25, 2025
Reading List 10/25/25
 Overhead view of Barcelona, via YIMBYLAND.
Welcome to the reading list, a weekly roundup of news and links related to buildings, infrastructure, and industrial technology. This week we look at jet engine-powered data centers, Brightline train deaths, cracks in a super thin skyscraper, a Chinese particle accelerator, and more. Roughly 2/3rds of the reading list is paywalled, so for full access become a paid subscriber.
Some housekeeping items this week:
No essay this week, but a longer piece on how Britain lost its shipbuilding industry will be out next week.
My book’s Amazon listing is still goofed up (though I’m hopeful it will get fixed soon) — it’s still only available from 3rd party sellers with very long shipping times. I’d recommend ordering from Barnes and Noble or Bookshop in the meantime.
The book had a nice review in the Wall Street Journal.
Jet engines for data centersGas turbine power plants and jet engines share a lot of similarities, to the point where some gas turbine power plants are “aeroderiviatives” which are based on the design of a jet engine. Because the backlog for new gas turbine power plants is so long, and because some data centers want their power now, some data center buildings are turning to repurposed jet engines to supply power. Via Data Center Dynamics:
Powerships
The PE6000 gas turbines are made through retrofitting old CF6-80C2 jet engine cores and matching them with newly manufactured aero-derivative parts made by ProEnergy or its partners.
To make jet engines suitable for use as power generators, they are modified with an expanded turbine section to convert engine thrust into shaft power, a series of struts and supports to mount them on a concrete deck or steel frame, and new controls. Following assembly, the engines can supply 48MW of capacity.
“We have sold 21 gas turbines for two data center projects amounting to more than 1GW,” said Landon Tessmer, VP of commercial operations at ProEnergy. “Both projects are expected to provide bridging power for five to seven years, which is when they expect to have grid interconnection and no longer need permanent behind-the-meter generation.
In other “unusual sources of power” news, this week I learned about powerships, which are basically floating power plants built into the hull of a ship. One such ship, provided by the firm Karpowership, was from 2018 until earlier this year providing 40% of the electricity for the west African country The Gambia:
In February 2018, Karpowership signed a 2-year contract with National Water and Electricity Supply Company Ltd. of the Gambia to deploy a Powership of 36 MW. In 2020 the contract was extended for 2 more years and in May 2022 extended for another 3 years. Karpowership has been operational in the Gambia since 2018 and supplying 40% of the Gambia’s total electricity need. In 2017, a year before Karpowership began its operations, only 56% of the population had access to electricity. Today, that figure has increased to 65%.
 The ship formerly powering The Gambia, via Karpowership.Brightline train deaths
Related to our recent discussions of pedestrians getting killed by cars, apparently the Brightline train in Florida has become notorious for killing pedestrians. As with pedestrian deaths, the reasons for the large number of people killed by the train is unclear. From the Atlantic:
Battery storage and rolling blackouts
What the Brightline is best known for is not that it reflects the gleam of the future but the fact that it keeps hitting people. According to Federal Railroad Administration data, the Brightline has been involved in at least 185 fatalities, 148 of which were believed not to be suicides, since it began operating, in December 2017. Last year, the train hit and killed 41 people—none of whom, as best as authorities could determine, was attempting to harm themselves. By comparison, the Long Island Rail Road, the busiest commuter line in the country, hit and killed six people last year while running 947 trains a day. Brightline was running 32.
In January 2023, the National Transportation Safety Board found that the Brightline’s accident rate per million miles operated from 2018 to 2021 was more than double that of the next-highest—43.8 for the Brightline and 18.4 for the Metra commuter train in Chicago. This summer, the Miami Herald and a Florida NPR station published an investigation showing that someone is killed by the train, on average, once every 13 days.
We’ve talked a few times about the benefits that battery storage can bring to electrical grids. By storing excess electricity, batteries act as a buffer, making it easier to match supply and demand and reducing the need for expensive “peaker” power plants. We previously noted that the rise of battery storage has been credited with reducing the risk of power outages in Texas:
In 2023, Texas’ ERCOT issued 11 conservation calls (requests for consumers to reduce their use of electricity), including 7 during late August, to avoid reliability problems amidst high summer temperatures. But in 2024 it issued no conservation calls during the summer. In part this was due to the rapid increase in battery storage, which rose by 4 gigawatts (roughly 50%) between January and June 2024.
It seems like something similar has happened in California. The Los Angeles Times has a good piece about the rise of battery storage in California and the simultaneous decline in rolling blackouts:
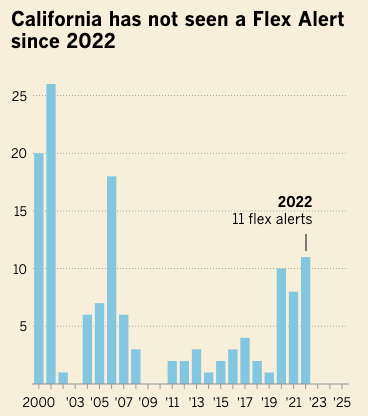
For decades, rolling blackouts and urgent calls for energy conservation were part of life in California — a reluctant summer ritual almost as reliable as the heat waves that drove them. But the state has undergone a quiet shift in recent years, and the California Independent System Operator hasn’t issued a single one of those emergency pleas, known as Flex Alerts, since 2022.
Experts and officials say the Golden State has reached a turning point, reflecting years of investment in making its electrical grid stronger, cleaner and more dependable. Much of that is new battery energy storage, which captures and stores electricity for later use.
In fact, batteries have been transformative for California, state officials say. In late afternoon, when the sun stops hitting solar panels and people are home using electricity, batteries now push stored solar energy onto the grid.
California has invested heavily in the technology, helping it mature and get cheaper in recent years. Battery storage in the state has grown more than 3,000% in six years — from 500 megawatts in 2020 to more than 15,700 megawatts today.


October 18, 2025
Reading List 10/18/25
 Draugen oil platforms under construction.
Welcome to the reading list, a weekly roundup of news and links related to buildings, infrastructure, and industrial technology. This week we look at a North Korean construction company, data center popularity, why robot dexterity is hard, a map of US solar panels, and more. Roughly two thirds of the reading list is paywalled, so for full access become a paid subscriber.
Some housekeeping items this week:
My book was finally released this week! A few book-related items:
The book was temporarily out of stock on Amazon for a few days, possibly because Amazon’s algorithm underestimated demand. It’s back in stock now, but only available from third-party sellers with long delivery times. Stripe Press is working on fixing this. It's available with normal deliverty times from other sellers.
The book was an Amazon Editor’s pick for “Best Nonfiction”.
I was on TBPN talking about the book (I come on at around 2:35:00).
Leah Libresco has a review of the book on Commonplace.
Another excerpt from the book was published on CapX.
No Amazon reviews yet, so if you’ve received a copy and read it drop a review.
I was on Statecraft with Alex Armlovich and Will Poff-Webster talking about the ROAD to Housing Act.
North Korean statue buildingI typically think of North Korea as a country that’s almost completely cut off from the global economy, in part due to the large number of sanctions against them, but apparently they have a construction firm, Mansudae Overseas Projects, that builds huge North Korean-style statues all over the world. Via Wikipedia:
As of August 2011, it had earned an estimated US$160 million overseas building monuments and memorials. As of 2015, Mansudae projects have been built in 17 countries: Angola, Algeria, Benin, Botswana, Cambodia, Chad, Democratic Republic of Congo, Egypt, Equatorial Guinea, Ethiopia, Germany, Malaysia, Mali, Mozambique, Namibia, Senegal, Togo and Zimbabwe. The company uses North Korean artists, engineers, and construction workers.
 African Renaissance Monument in Dakar, Senegal.Data centers are unpopular
We’ve noted before that data centers, which historically were treated as a neutral to positive for local communities (since they contributed tax revenue without adding much demand for local services), are now increasingly opposed by local residents. Now it seems like politicians on both sides of the aisle are starting to notice. Via Semafor:
GAINESVILLE, Va. — On Friday night, dueling candidates for a board of supervisors seat in this suburban county found a cause that united them: banning new data centers.
“I think we should, personally, block all future data centers,” said Patrick Harders, the Republican running for an open seat on the Prince William County board. George Stewart, his Democratic opponent, agreed that “the crushing and overwhelming weight of data centers” was a crisis, with massive companies “having us, as residents, pay for their energy.”
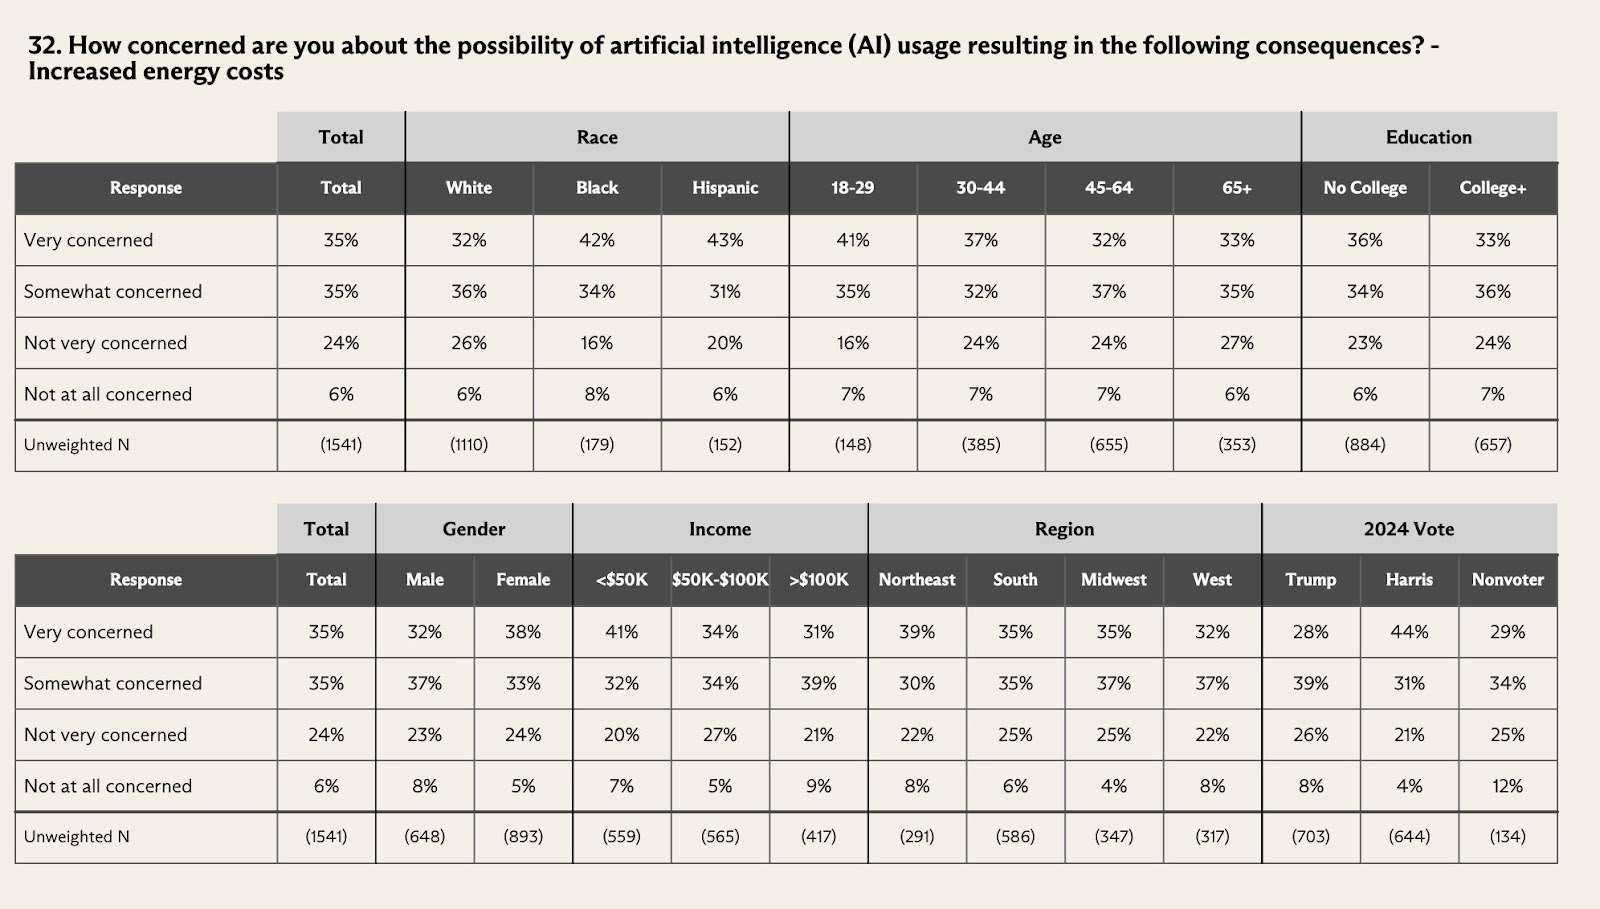
As electricity bills rise, a growing number of US candidates in both parties are pointing to the high energy costs of data centers — booming thanks to tech companies’ AI investments — as the culprit. While the issue isn’t yet a flashpoint in statewide races, it’s already an overwhelming source of debate in local ones, especially in Virginia.
Similarly, a survey run by The Argument found that “70% of respondents were concerned, and 35% were “very concerned” about the impact of AI on energy costs.”
 AI water use
Also on the subject of data centers, we’ve previously discussed the amount of water used by data centers in my essay on US water consumption, and in a follow up essay correcting an error in the original piece. Even with the correction (which substantially increased the estimate for how much water data centers use), my conclusion is that while data center and AI water use numbers seem large in absolute terms (because “millions of gallons” always sounds like a lot), they’re very small when compared to other large-scale industrial uses. And because industrial water use goes towards producing products that we end up buying, there’s a lot of water use “baked in” to the various goods we consume that doesn’t get so much attention. On his substack, Andy Masley breaks this down:
Why robot dexterity is hard
Have you ever worried about how much water things you did online used before AI? Probably not, because data centers use barely any water compared to most other things we do. Even manufacturing most regular objects requires lots of water. Here’s a list of common objects you might own, and how many chatbot prompt’s worth of water they used to make (all from this list, and using the onsite + offsite water value):
Leather Shoes - 4,000,000 prompts’ worth of water
Smartphone - 6,400,000 prompts
Jeans - 5,400,000 prompts
T-shirt - 1,300,000 prompts
A single piece of paper - 2550 prompts
A 400 page book - 1,000,000 prompts
If you want to send 2500 ChatGPT prompts and feel bad about it, you can simply not buy a single additional piece of paper. If you want to save a lifetime supply’s worth of chatbot prompts, just don’t buy a single additional pair of jeans.
We’ve previously talked about difficulties with robot dexterity, and how there’s a sort of Moravec’s Paradox at work with robot demonstrations: we see lots of demos of robots doing things that look difficult, like dancing or kung fu, but fewer impressive demonstrations of robots doing simpler, object manipulation tasks. On his substack, Bryson Jones, the “co-founder and CEO of Adjoint, a company focused on building autonomous robots for skilled labor abundance”, explains why robotic manipulation is a harder problem than locomotion: while locomotion has properties that make it amenable to large-scale training in simulation, manipulation generally doesn’t.
Manipulation poses a more sobering challenge:
No compact reward functions The “cost function” for inserting a screw or cooking an omelet is hard to specify. Rewards often need careful shaping or human priors, leading to brittleness and unexpected outcomes from reward-hacking.
Rich sensing requirements Unlike locomotion, manipulation usually requires vision and tactile feedback to estimate object shape, pose, affordances, and contacts. Tactile sensing hardware is still immature. The example I like to give people is: “imagine dipping your hand in anesthetic and trying to pick your phone up… it’s basically impossible”
Discrete modes and long-horizons introduce unique complexity Manipulation often involves discrete modes for task completion: grasping, lifting, pushing, where each object can behave differently. Contact dynamics are messy, occlusions are common, and the precision bar is much higher than for locomotion.
Few emergent behaviors Unlike locomotion, manipulation doesn’t “discover” elegant solutions on its own (so far). Without demonstrations or heavy engineering, policies struggle to converge on useful strategies.
This is why we haven’t been able to just “zero-shot” transfer all of the methods that accelerated locomotion progress in the past 5 years into manipulation.
October 16, 2025
More on US Pedestrian Deaths
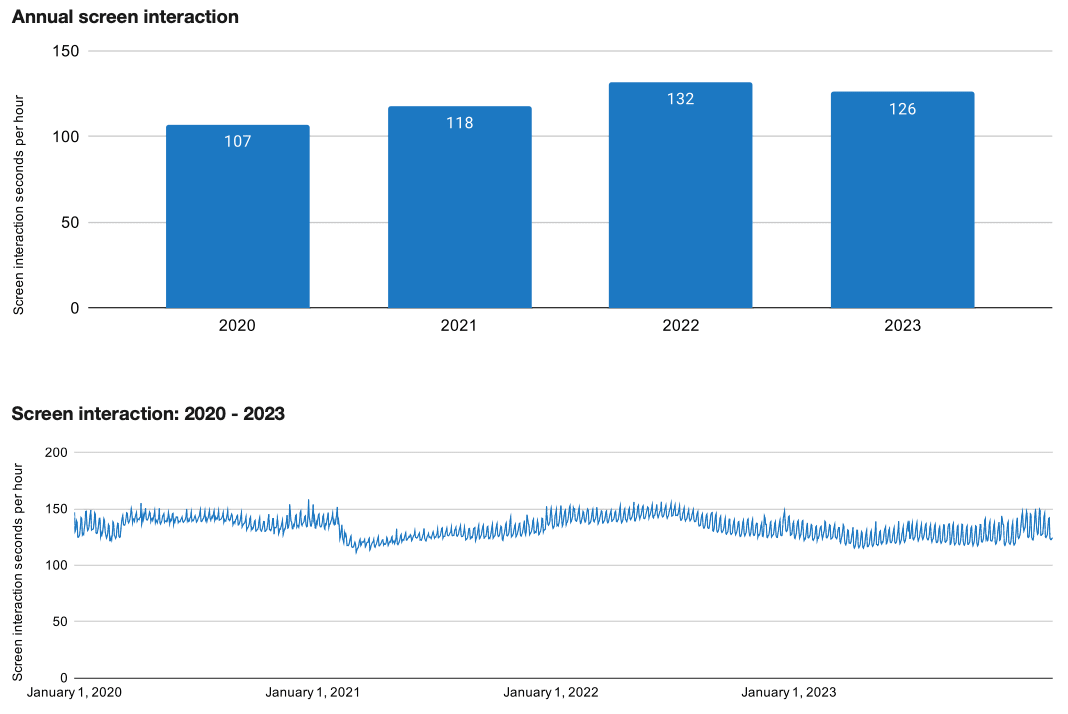
Last week I wrote about the unexplained rise in pedestrians killed by motor vehicles in the US. Since 2009, pedestrian deaths have increased by almost 80%, following multiple decades of falling rates.
!function(){"use strict";window.addEventListener("message",(function(e){if(void 0!==e.data["datawrapper-height"]){var t=document.querySelectorAll("iframe");for(var a in e.data["datawrapper-height"])for(var r=0;r<t.length;r++){if(t[r].contentWindow===e.source)t[r].style.height=e.data["datawrapper-height"][a]+"px"}}}))}();I looked through data on pedestrian fatalities from the National Highway Transportation Safety Administration (NHTSA), but I couldn’t find a singular explanation that satisfied me. The piece of evidence that most compelled me was this: the rate of pedestrian fatalities has increased substantially across many different states, even as overall pedestrian collisions have stayed close to constant. This suggests that pedestrian accidents are getting more deadly, which in turn suggests that the increase in popularity of big SUVs might be causing the increase in deaths. However, the number of pedestrians killed by sedans seems to be rising as well. That can’t be caused by SUVs getting bigger and more popular.
This article got lots of attention, and readers had many theories about the drivers of the increase. In this follow-up post, I wanted to further investigate some of the most compelling theories and angles on the question.
Unfortunately, this exercise left me more confused than before. What previously seemed like the most promising explanation (the rise of large SUVs) now looks less compelling. But no other explanation has emerged to take its place.
Deaths and darknessSome folks pointed me to a New York Times article on the problem of US pedestrian deaths from 2023. Contra my original claims (that the increase in deaths doesn’t seem specific to one time of day), the NYT states that nearly all the increase in deaths is at night.
The NYT is correct; This was an error on my part that stemmed from not looking closely enough at the data behind a bad summary statistic. I was correct that there hasn’t been much change in the proportion of deaths during the hours of 6pm to 6am. But 6am is night at some times of year and location, and day in other times and places.. Lighting conditions are not just a function of the clock. If you look at deaths by lighting condition, you find that the increase in deaths is mostly in times of darkness.
!function(){"use strict";window.addEventListener("message",(function(e){if(void 0!==e.data["datawrapper-height"]){var t=document.querySelectorAll("iframe");for(var a in e.data["datawrapper-height"])for(var r=0;r<t.length;r++){if(t[r].contentWindow===e.source)t[r].style.height=e.data["datawrapper-height"][a]+"px"}}}))}();Deaths in daylight are only up 28% since 2009; deaths in darkness or lit darkness (streetlights, etc.) are up 103% and 87%, respectively. On its own, this data doesn’t tell us what’s causing the increase in deaths (indeed, the NYT quotes a researcher at the Insurance Institute for Highway Safety saying, “I don’t have any definitive answers for this”), but it’s a useful correction.
Increases in speedOne theory I heard was that small increases in vehicle speed have a disproportionate impact on the deadliness of collisions, so the cause may be small increases in vehicle speed that aren’t large enough to show up in increased rates of speeding.
!function(){"use strict";window.addEventListener("message",(function(e){if(void 0!==e.data["datawrapper-height"]){var t=document.querySelectorAll("iframe");for(var a in e.data["datawrapper-height"])for(var r=0;r<t.length;r++){if(t[r].contentWindow===e.source)t[r].style.height=e.data["datawrapper-height"][a]+"px"}}}))}();It’s true that the risk of death rises substantially with vehicle speed: going from 23 mph to 32 mph increases the risk of death from 10% to 25%. However, if we look at the frequency of deaths by the speed limit of the road they occur on, deaths have increased at every speed limit, including at very high speed limits (60 mph and above) where death was already virtually certain.
 Via NHTSA FARS data.
Percentage-wise, the biggest increase is actually at the top end of the scale, particularly with 70-79 mph speed limits (where deaths have nearly tripled). This doesn’t seem consistent with “minor increases in speeding” as a cause of increased deaths.
Another possibility is that speed limits have risen across the board on US roads, making them more deadly even though “speeding” (going over the speed limit) hasn’t increased. Speed limits in the US have increased, but from what I can tell this mostly started in 1995 when the National Maximum Speed Law was repealed. I found a few cases where some cities have reduced their speed limits, and some of these cities (New York, Minneapolis) haven’t had the same increases in pedestrian deaths as the rest of the country. But other cities which have reduced their speed limits (Washington, Seattle) have had increases in pedestrian deaths.
Location of deathsThe previous article looked at the location of pedestrian deaths by state, and by type of road, but didn’t go more granular than that. I was pointed to a 2023 study that looked at changes in where pedestrian deaths are occuring. It notes that pedestrian deaths seem to have actually declined in downtowns, even as they’ve increased in suburban areas:
Pedestrian fatalities appear to be concentrating in lower-density suburbs with lower-income, lower-education, and minority populations. Where in our cities are these areas? For our three largest cities of Los Angeles, Chicago, and Houston, we see a distinct trend. In the “before” period, pedestrian fatalities were concentrated in downtown areas. In the “after” period, they have moved outwards into the suburbs. In Los Angeles and Chicago, the hot spots present in the downtown areas in the “before” periods have largely dissipated in the “after” period. Also, note that the COVID-19 lockdowns took place during our “after” period and may have affected the results.


Unfortunately, this doesn’t tell us much about what’s causing the uptick in deaths.
Covid-19In the previous article I looked at rates of pedestrian crashes overall vs fatal crashes in several different states, noting that the fatality rate had almost always increased over time. But for each state I only looked at two times, 2009 (or as early as data was available) and 2023/2024. I decided to look at actual time series for states to see if there was anything notable. The graph below shows pedestrian crashes and pedestrian fatalities for Arizona, Illinois, Pennsylvania, and South Carolina, normalized so that 2009 values are equal to 100. (There was nothing special about these states, they were simply the first states I looked at where data went back to 2009.)
!function(){"use strict";window.addEventListener("message",(function(e){if(void 0!==e.data["datawrapper-height"]){var t=document.querySelectorAll("iframe");for(var a in e.data["datawrapper-height"])for(var r=0;r<t.length;r++){if(t[r].contentWindow===e.source)t[r].style.height=e.data["datawrapper-height"][a]+"px"}}}))}();Each state has pedestrian deaths rising faster than overall collisions, and in some states collisions are falling even as pedestrian deaths are rising. But the time series also shows a jump during 2020 due (presumably) to Covid-19: pedestrian crashes suddenly have large declines, but pedestrian fatalities only show modest declines (Pennsylvania), are flat (Illinois), or increase (Arizona, South Carolina). My guess is that while daylight driving declined significantly, (due to things like people working from home), night-time driving declined much less. In Arizona, for instance, the number of daylight pedestrian crashes declined by 27% from 2019 to 2020; nighttime crashes only declined by 3%.
Distracted pedestriansIn the previous article I noted that there’s not much evidence for increased “driver distractedness” as a factor (which would include drivers distracted by phones), though it’s hard to rule out. People also wondered if pedestrian inattentiveness (because of phones or headphones) could be a factor.
Since 2010 FARS has tracked “non-motorist contributing factors,” which includes whether pedestrians were “inattentive.” However, as with driver distractedness, there’s not much evidence that this is a factor. The number of killed pedestrians classified as “inattentive” is a tiny fraction of overall pedestrian deaths.
!function(){"use strict";window.addEventListener("message",(function(e){if(void 0!==e.data["datawrapper-height"]){var t=document.querySelectorAll("iframe");for(var a in e.data["datawrapper-height"])for(var r=0;r<t.length;r++){if(t[r].contentWindow===e.source)t[r].style.height=e.data["datawrapper-height"][a]+"px"}}}))}();This doesn’t necessarily mean that a pedestrian wasn’t distracted by their phone or something else: as with driver distractedness, it may simply not have been recorded (though all else equal, I would expect drivers in these collisions to happily place blame on pedestrians looking at their phones, so the fact that they’re not seems telling). Similarly, if distracted pedestrians were a major factor, I would expect pedestrian collisions overall to have increased, but they don’t seem to have (at least not consistently).
BicyclistsSome readers wondered if a similar uptick in fatalities has been seen for bicyclists. It has: bicyclist deaths are up 86% since 2009. So whatever is causing the increase also seems to be affecting cyclists.
!function(){"use strict";window.addEventListener("message",(function(e){if(void 0!==e.data["datawrapper-height"]){var t=document.querySelectorAll("iframe");for(var a in e.data["datawrapper-height"])for(var r=0;r<t.length;r++){if(t[r].contentWindow===e.source)t[r].style.height=e.data["datawrapper-height"][a]+"px"}}}))}();Demographic changesOther than the age of drivers and pedestrians, my previous article didn’t really look at any demographic factors, and folks wondered whether there might be any notable changes in composition there.
For gender, there’s not much change for either drivers or victims: men have stayed around 70% of both:
!function(){"use strict";window.addEventListener("message",(function(e){if(void 0!==e.data["datawrapper-height"]){var t=document.querySelectorAll("iframe");for(var a in e.data["datawrapper-height"])for(var r=0;r<t.length;r++){if(t[r].contentWindow===e.source)t[r].style.height=e.data["datawrapper-height"][a]+"px"}}}))}();For race, the fraction of white victims has stayed roughly constant (save for a big decline in 2023 for some reason). There was an uptick in the fraction of black victims around 2015, and a corresponding decrease in the fraction of other races.
!function(){"use strict";window.addEventListener("message",(function(e){if(void 0!==e.data["datawrapper-height"]){var t=document.querySelectorAll("iframe");for(var a in e.data["datawrapper-height"])for(var r=0;r<t.length;r++){if(t[r].contentWindow===e.source)t[r].style.height=e.data["datawrapper-height"][a]+"px"}}}))}();Because “Hispanic” isn’t a racial category, we need to look at that separately. Interestingly, the number of Hispanic victims was declining until around 2017, after which it rose substantially (from 24% of pedestrian deaths in 2017 to 40% of deaths in 2023), though still within the range of what we’ve seen historically. This doesn’t quite line up with the spike in pedestrian deaths overall (which began in 2009), but it’s interesting to note.
!function(){"use strict";window.addEventListener("message",(function(e){if(void 0!==e.data["datawrapper-height"]){var t=document.querySelectorAll("iframe");for(var a in e.data["datawrapper-height"])for(var r=0;r<t.length;r++){if(t[r].contentWindow===e.source)t[r].style.height=e.data["datawrapper-height"][a]+"px"}}}))}();Other readers also wondered if an increasing homeless population could be behind the increase. Evidence here seems mixed. The number of homeless in the US has been increasing in recent years, but the increase started around 2015-2017, not in 2009. This seems largely true on a state-by-state level as well.
!function(){"use strict";window.addEventListener("message",(function(e){if(void 0!==e.data["datawrapper-height"]){var t=document.querySelectorAll("iframe");for(var a in e.data["datawrapper-height"])for(var r=0;r<t.length;r++){if(t[r].contentWindow===e.source)t[r].style.height=e.data["datawrapper-height"][a]+"px"}}}))}();!function(){"use strict";window.addEventListener("message",(function(e){if(void 0!==e.data["datawrapper-height"]){var t=document.querySelectorAll("iframe");for(var a in e.data["datawrapper-height"])for(var r=0;r<t.length;r++){if(t[r].contentWindow===e.source)t[r].style.height=e.data["datawrapper-height"][a]+"px"}}}))}();!function(){"use strict";window.addEventListener("message",(function(e){if(void 0!==e.data["datawrapper-height"]){var t=document.querySelectorAll("iframe");for(var a in e.data["datawrapper-height"])for(var r=0;r<t.length;r++){if(t[r].contentWindow===e.source)t[r].style.height=e.data["datawrapper-height"][a]+"px"}}}))}();However, although the data isn’t amazingly robust, it does seem like a large fraction of pedestrians killed by motor vehicles are homeless. In Hawaii 13 of 37 pedestrians killed in motor vehicle accidents in 2024 were homeless, and 8 in 28 in 2025. 10% of the pedestrian deaths in Clark County, Nevada from 2008 to 2011 were homeless. 22% of pedestrian deaths in San Francisco in 2018, and 15% in 2021, were homeless. 28% of Sacramento pedestrian deaths were homeless in 2024. From 2017 to 2019, 21% of pedestrian deaths in Portland were homeless. Pedestrian deaths on interstates in Atlanta are reportedly mostly homeless.
It’s also the case that the rate of death from traffic accidents among the homeless has dramatically risen in recent years. A study on the causes of death in the homeless across several different locations found that traffic fatalities had increased substantially from 2011 to 2020 (eyeballing the graph, it seems to have roughly quadrupled, from around 40 per 100,000 in 2011 to 150 per 100,000 in 2020).
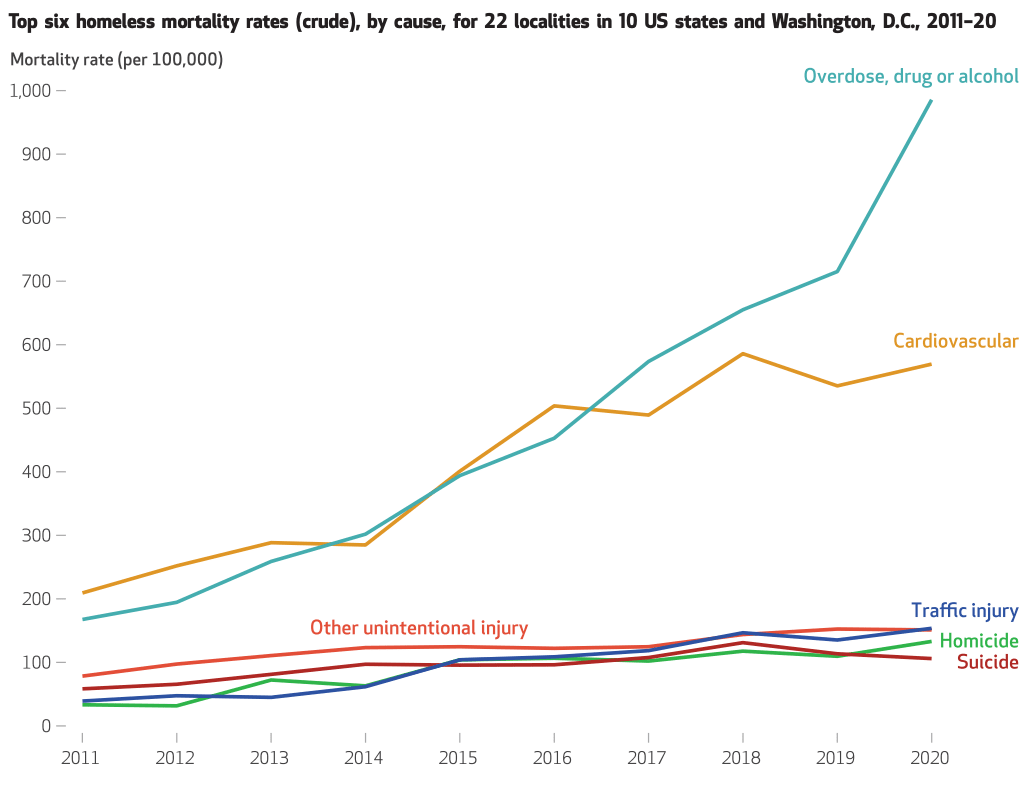
This doesn’t tell us about causation: it’s not clear if homeless are increasingly at risk because of something they’re doing ( wandering into traffic more, say), or if they’re just victims of other factors. I did find it notable that homeless mortality rates from many different causes are up substantially, and that the increase in traffic deaths is greater than the increase in pedestrian deaths more generally. It suggests that something might be causing increased homeless deaths across the board, which might also include increased traffic deaths.
It also seems that while homeless deaths are a large fraction of pedestrian deaths in cities, they’re still a relatively small fraction of pedestrian deaths overall. In 2020 there were 6,565 pedestrians killed by motor vehicles. If we assume that the death rate of 150 per 100,000 found in the study applies to the homeless population overall (around 580,000 in 2020, per HUD), that would get us around 870 total homeless killed in traffic accidents, or 13% of the total.
Big SUV skepticism, phone use theoryJohn Burn-Murdoch of the Financial Times wrote a piece on US pedestrian deaths in 2024, which threw some additional cold water on the big SUV hypothesis. A variety of countries have seen huge increases in the number of SUVs sold, but only the US has seen an uptick in pedestrian deaths.

Some folks suggested that perhaps American SUVs are uniquely large and dangerous — SUVs in other countries seem like they’re often much smaller than the huge ones we have in the US. But Canada seems to contradict this. SUVs and trucks in Canada look just as large as US ones: four of the top 10 most popular vehicles sold in Canada in 2024 were the same sort of giant pickup trucks (F150, Sierra, Silverado, RAM) that we have in the US. (In fact, 8 of the top 10 US vehicles were also in the Canadian top 10.)
Burn-Murdoch also points to an economics paper which, by using data on the number of pedestrian deaths and the fraction of vehicles that are cars vs. SUVs in different states, shows that replacing SUVs with cars would theoretically have a small impact on the total number of pedestrian deaths. This doesn’t tell us much we didn’t already know (since we had already clocked that deaths from popular sedans were up substantially as well), but it’s another blow against the “big SUV” hypothesis.
Burn-Murdoch points to some evidence that it might be phone use, showing that US drivers seem to spend much more time on their phones than Canadian drivers. But this data (which only covers a year) isn’t enough to show whether there’s been a change in US phone use over time.
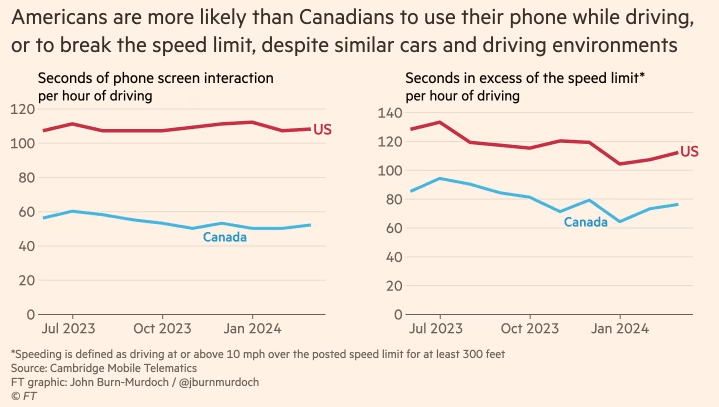
I looked up some reports from the firm that gathers this data (Cambridge Mobile Telematics), and it does seem to show an increase in driver phone use in the US over time. Its 2020 report “The Harsh Realities of Distracted Driving” shows that the number of “distraction events” (most of which are phone use) rose across the US from 2017 to 2020.

And its “The State of US Road Risk in 2024” report shows, by some measures, that phone use rose from 2020 to 2023.1

So it’s possible that US drivers simply use their phones more in the car than drivers in other countries, and that this problem has grown worse over time. This is suggestive, but I don’t think it’s definitive: if increased smartphone use were the problem, I’d expect collisions of all types to be up (which they aren’t), and wouldn’t expect the problem to be limited to night.
Driver blind spotsStill other readers suggested that an increase in the size of vehicle blind spots might be behind the increase. This initially seemed like a very plausible explanation. A paper from the Department of Transportation earlier this year noted that the size of vehicle blind spots has increased across a variety of US models:
!function(){"use strict";window.addEventListener("message",(function(e){if(void 0!==e.data["datawrapper-height"]){var t=document.querySelectorAll("iframe");for(var a in e.data["datawrapper-height"])for(var r=0;r<t.length;r++){if(t[r].contentWindow===e.source)t[r].style.height=e.data["datawrapper-height"][a]+"px"}}}))}();This decrease seems to be partly driven by more stringent NHTSA safety standards for roof crush resistance, which incentivize making cars with very strong, robust A-pillars (the vertical pillars in front of the driver which support the roof). Making A-pillars larger and heavier makes the roof less likely to collapse, but it also impedes driver vision. New, stricter roof-crush requirements were issued in 2009 and started to be phased in from 2012-2016, which roughly aligns with when pedestrian deaths started to increase in the US (presumably some manufacturers began to change their models as soon as the new requirements were issued).
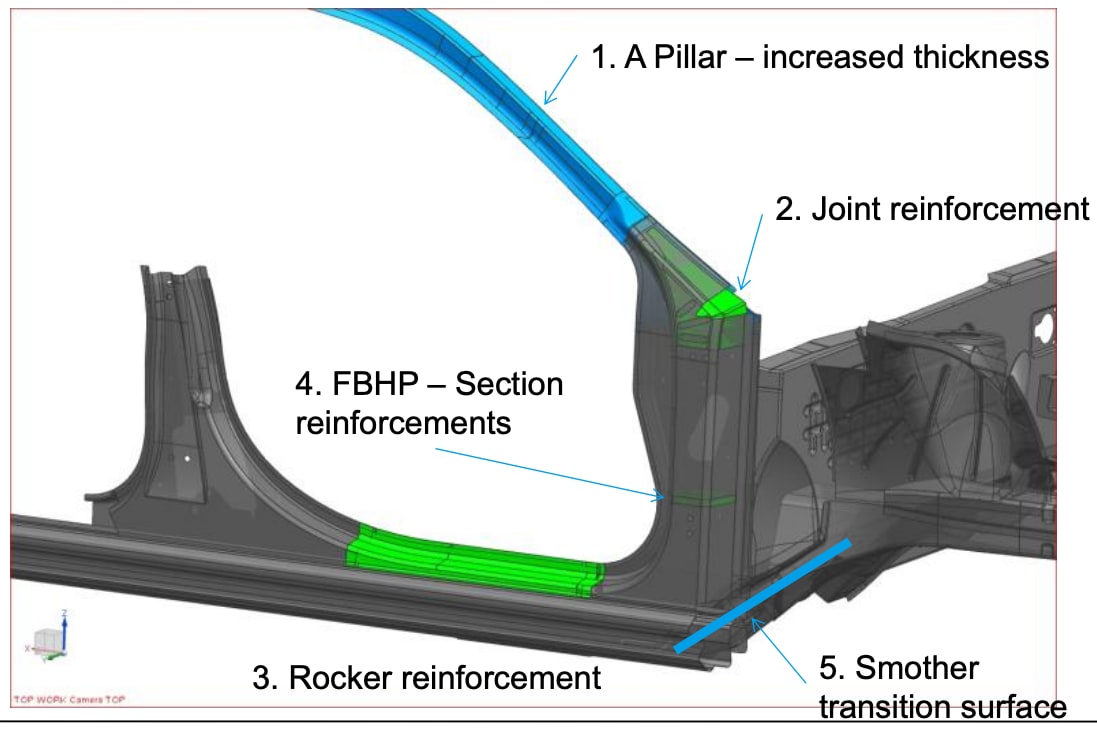 Via SAE 2015.
This is also potentially an area where the US is different from Europe. Europe not only has no roof-crush requirements, but it also has requirements that limit how much the driver’s field of vision can be blocked. US cars have no such requirements.
If this theory was correct, pedestrian accidents would be getting more deadly not because cars are getting larger and heavier, but because drivers increasingly can’t see pedestrians, and aren’t slowing down before hitting them. This would also explain why cyclist deaths have risen in roughly the same proportion.
Another notable item here: modern vehicles mostly have automatic emergency braking systems that will brake if they detect an oncoming collision. These systems have been recommended by the NHTSA since 2015, and have been sold on most US cars since around 2020. However, these systems apparently don’t work well for pedestrians at night. So “reduced driver visibility” could also partly explain why the increase in deaths is mostly occurring at night, and why we don’t see a large increase in collisions more generally — AEB systems are preventing most additional collisions, but nighttime pedestrian collisions are slipping through. This could at best be a partial explanation though, since the introduction of AEB doesn’t really align with the uptick in night-time pedestrian deaths.
However, once again Canada throws a wrench into this explanation. Canada has very similar vehicle safety requirements as the US, including no limits on driver visibility obstructions and similar roof crush standards as the US. The NHTSA actually publishes a list of harmonized Canadian and US vehicle standards, which includes the roof crush requirements (FMVSS 2016 in the US, CMVSS 216 in Canada), and apparently it’s not uncommon for new vehicles to be certified for sale both in the US and Canada. If increasingly large blind spots in US vehicles was the driver of the increase in pedestrian deaths, I’d expect that to also show up in Canada as well. But they don’t.
ConclusionLooking more deeply into possible explanations for the rise in US pedestrian deaths has left me more confused than before. Our most promising original explanation — increasingly large SUVs — was already somewhat shaky, and now looks even less promising. Other countries have had similar increases in SUVs without a corresponding increase in pedestrian deaths. The most promising new explanation — an increase in the size of US vehicle blind spots — is hard to square with the fact that Canada has very similar vehicle safety regulations as the US (and thus presumably a similar increase in driver blind spots, though I haven’t verified this), but hasn’t seen an uptick in pedestrian deaths. The “distracted by phones” theory seems somewhat more plausible to me now, but I still wish there were stronger evidence here.
We did uncover some interesting new factors. The increased deaths are mostly taking place at night. Cyclists’ deaths have increased by roughly the same amount in percentage terms. Deaths seem to be occuring less in downtowns, and more in suburban areas. A large fraction of pedestrian deaths are homeless (though probably not large enough to entirely explain the increase), and the rate of homeless killed in traffic accidents has increased dramatically in recent years, as has the absolute number of homeless in the US. The fraction of victims who are Hispanic (many of whom are likely also homeless) has risen dramatically since ~2017. But once again, these factors don’t point to a single clear explanation. Are homeless people increasingly likely to wander into traffic, or are they simply the most common victim of some other increase in road deadliness? If it’s the former, why? Is the increase in Hispanic fatalities connected to an uptick in illegal border crossings (this seems hard to square with the fact that illegal border crossings were down/flat from 2009 to around 2020)? Despite diving deeper into the question, I somehow feel like I know less than before.
My (unsatisfying) current theory is that the increase in pedestrian deaths is due to a multitude of small factors (an uptick in homelessness, an increase in drug use, a reduction in traffic law enforcement, etc.) and/or some sort of complicated multi-factor interaction (such as reduced driver forward visibility exacerbating American’s tendency to use their phones while driving). But I’m not particularly confident of this.
There’s research that could be done to better try to pin down this question. More extensive studies of vehicle blind spots, across the US, Canada, and Europe could tell us how much these have been changing in different places. It also seems like a large-scale study using telematics data and phone-use data, tracking things like whether drivers are using their phones prior to collisions, how fast they’re travelling, how much they slow down before impact, and so on could reveal a lot about collisions and phone use that we don’t currently know (though there are obviously potential privacy issues here).
1These graphs do not seem especially consistent to me. For both of them, I don’t see how 2023 could have higher annual phone motion than 2020, when the time series shows it consistently below it.
October 14, 2025
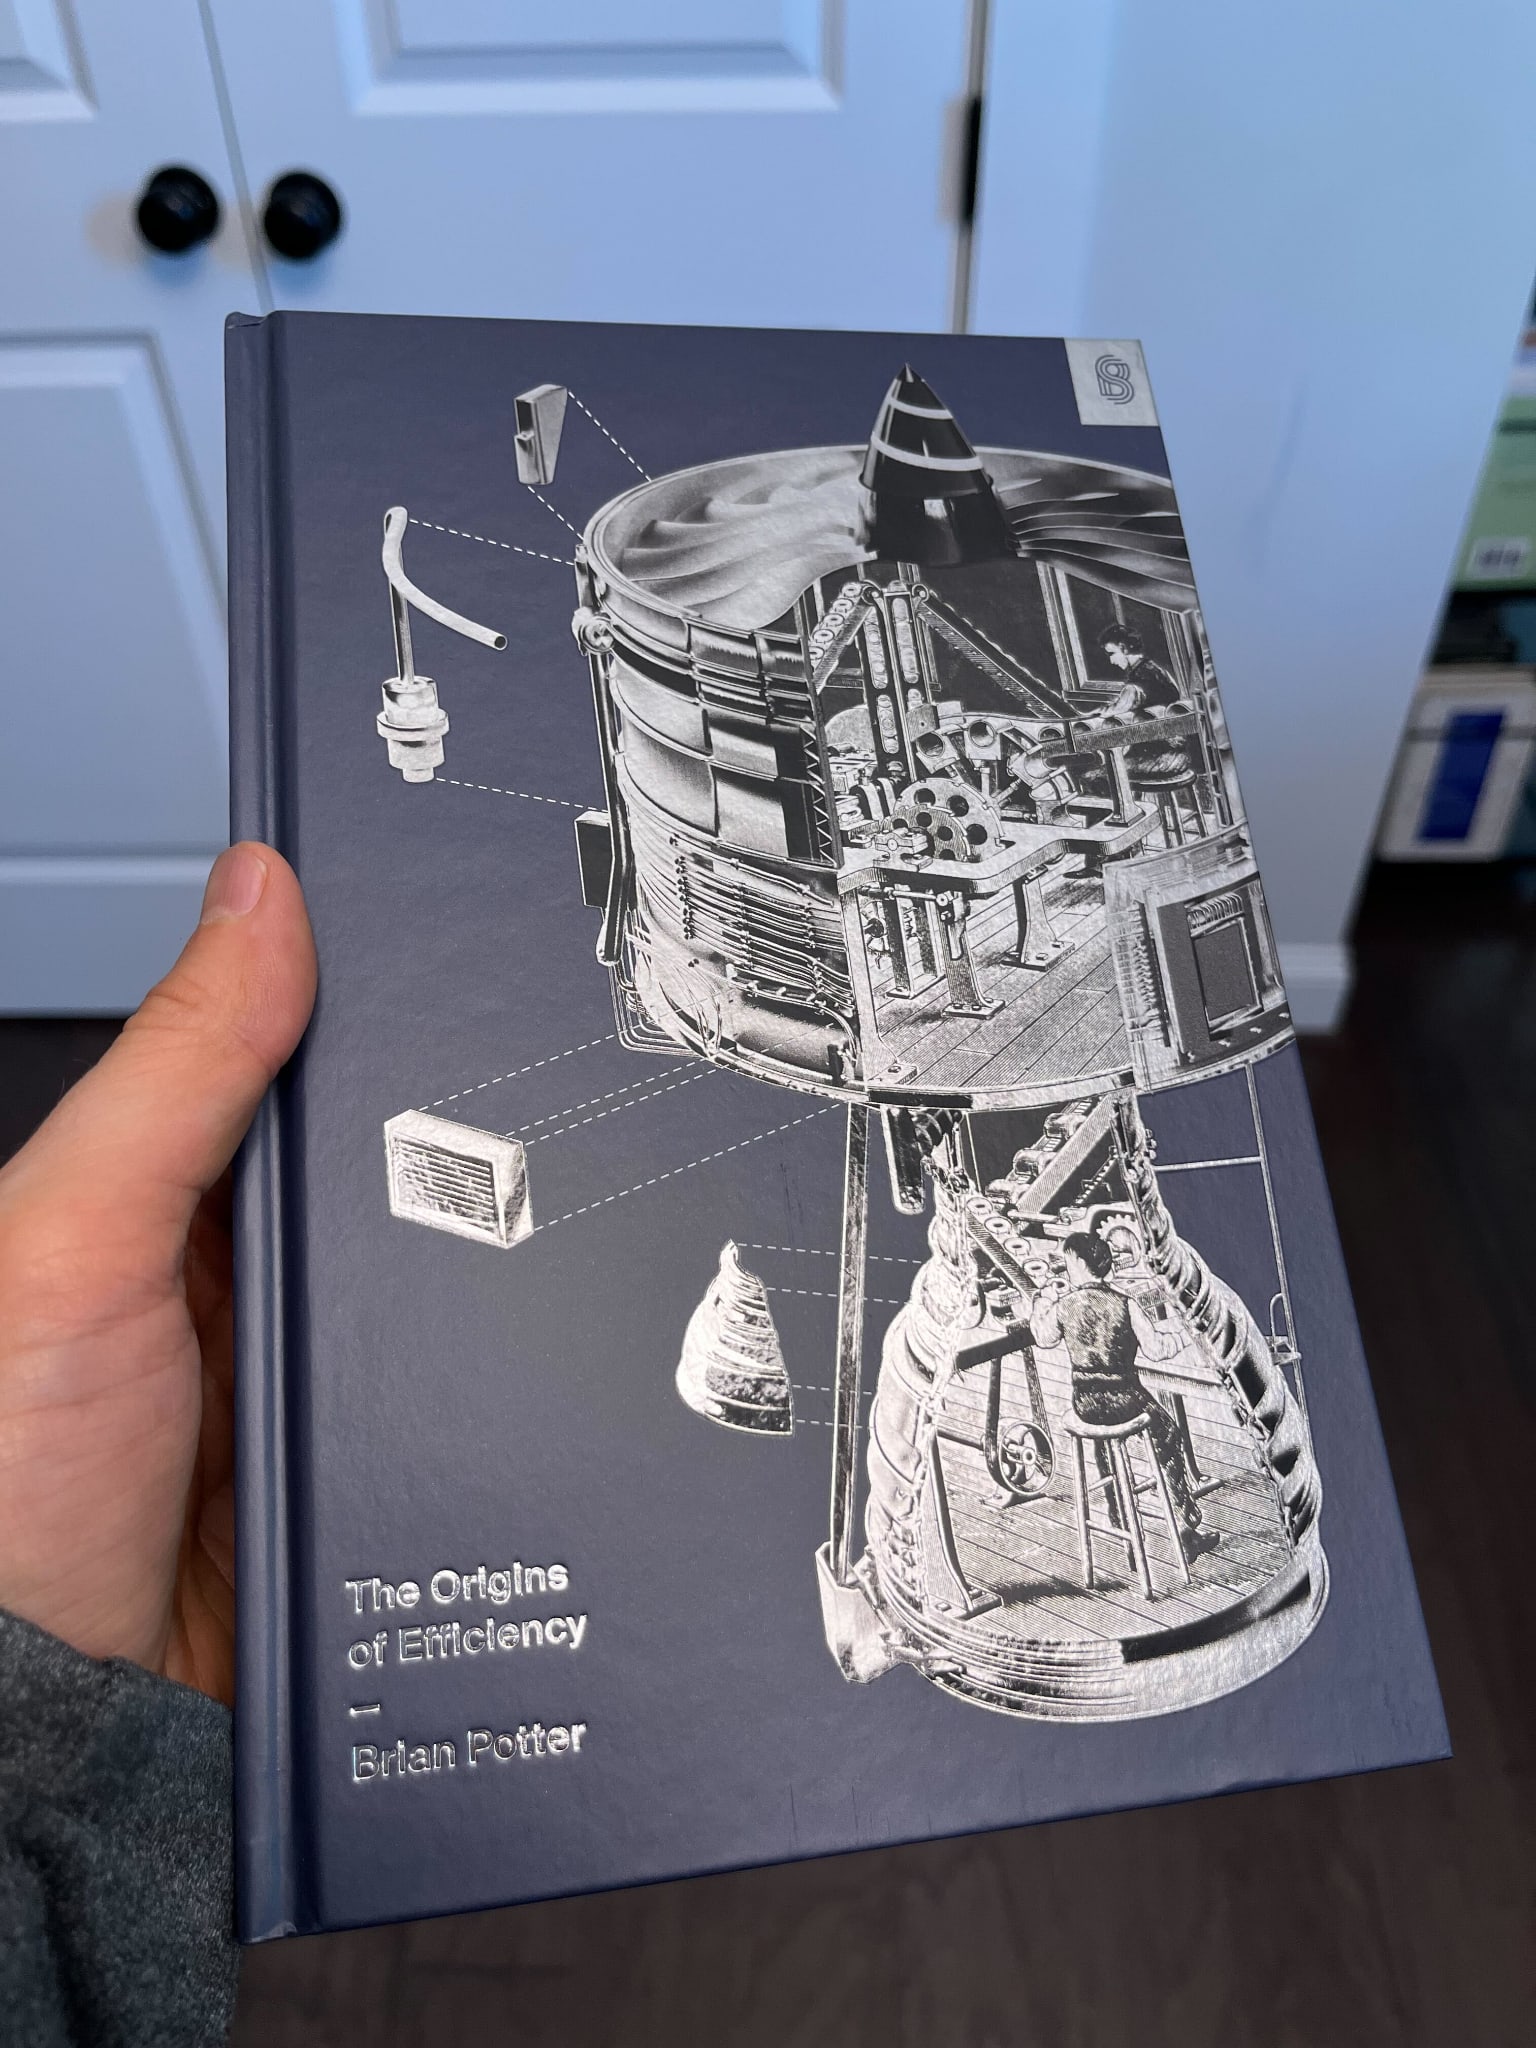
My Book, The Origins of Efficiency, is Out Today
My book, the Origins of Efficiency, is out today! You can purchase it at Amazon, Barnes and Noble, Bookshop.org, and at Stripe Press.
If you want to know more about the book:
Here’s the post I wrote talking about what the book is about and why I wrote it.
Here’s an excerpt about Ford and the evolution of the Model T (and here’s the same excerpt on FreeThink).
Here’s me talking about the book on the podcast “Unleashed”.
The introductory chapter is available to read on Readwise.
And here’s some nice things people have said about it:
“Brilliant and comprehensive. Brian Potter is the single best writer in America on how important things get built, and his new book is the single best example of his work.”
—Derek Thompson, author of Hit Makers and coauthor of Abundance
“This is unlike any other book I’ve read. It is a very high-level whole-systems overview of all known manufacturing processes (past and present), crammed with dense details, stories, anecdotes, and lessons from the front lines. Its grand/minute perspective is unusual—especially for production processes we usually never see. If you have any interest in, or responsibility for, how to make stuff at scale, you need to read this book.”
—Kevin Kelly, founding executive editor of Wired
“Brian Potter does impeccable, detailed research that he turns into clairvoyant insight about civilization’s most arcane processes. Here, he examines the mechanisms that enable spectacular efficiency in the production of goods and services. They comprise, he notes, ‘the engine that powers human civilization.’”
—Stewart Brand, cofounder and president of The Long Now Foundation and creator and editor of the Whole Earth Catalog
“America has forgotten how to make things. Brian Potter is here to help us remember. By the time you finish this book, you’ll feel like you’re well on your way to becoming an expert in manufacturing.”
—Noah Smith, author of Noahpinion
I hope you all enjoy reading it!
October 11, 2025
Reading List 10/11/2025
 Apollo 11 being loaded into a Super Guppy, via Wikipedia.
Welcome to the reading list, a weekly roundup of news and links related to buildings, infrastructure, and industrial technology. This week we look at Russia’s role in nuclear fuel production, aircraft contrails, homes collapsing in North Carolina, Konrad Zuse’s Helix Tower, and more. Roughly 2/3rds of the reading list is paywalled, so for full access become a paid subscriber.
Housekeeping items:
Folks had lots of suggestions on potential causes of the uptick in US pedestrian deaths. I’m working on a follow-up piece that looks at what I think are the most promising ones that should be out next week.
Friend of the newsletter Tyler Pullen is hiring a full-time AEC researcher at UC Berkeley’s Terner Center for Housing Innovation. The job posting is .
Pedestrian deaths mapWhen I was looking into NHTSA pedestrian deaths data, I vibe-coded a simple HTML map showing the exact location of each death, from 2001 (the earliest that location data was generally available) through 2023. I’ve made that map available on github here.
 Russia and the nuclear supply chain
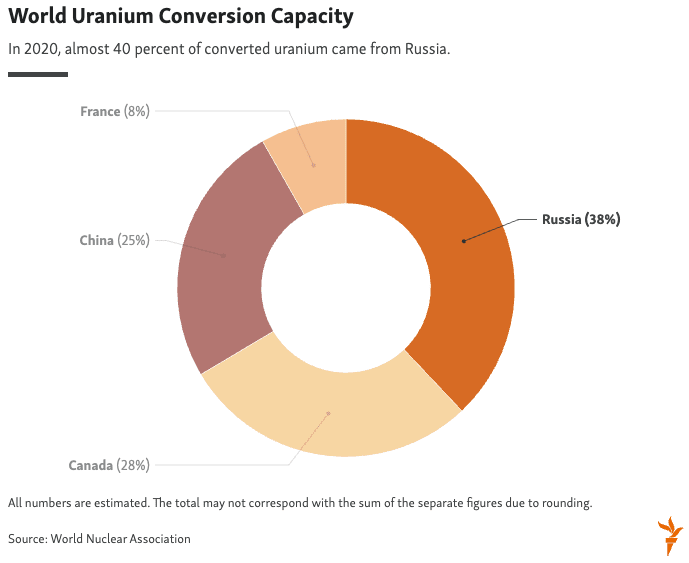
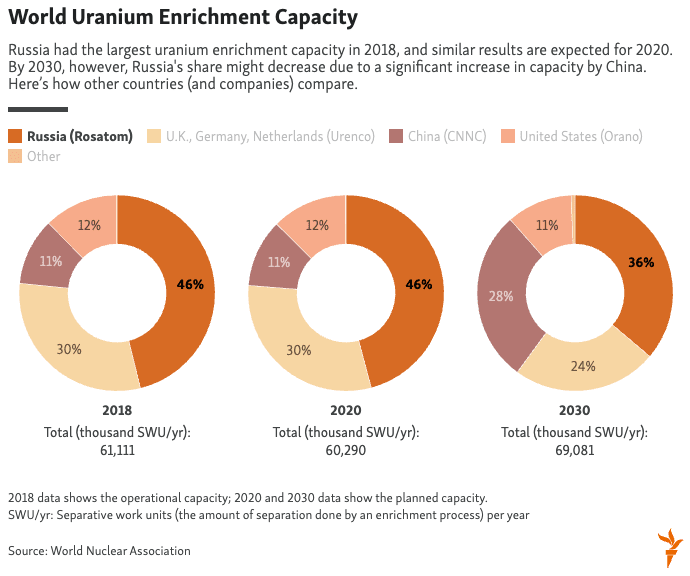
Concern about global demand for Russian energy resources usually focuses on Russian natural gas. But apparently Russia is also a major supplier of nuclear fuel: while most raw uranium ore is mined elsewhere, Russia is the largest producer of uranium hexafluoride gas (which uranium ore is converted into prior to enrichment), and the largest producer of enriched uranium (uranium with a higher fraction of fissile U235, making it suitable as a nuclear fuel). Via Radio Free Europe Radio Liberty:
…uranium mining is just one piece of the nuclear process. Raw uranium is not suitable as fuel for nuclear plants. It needs to be refined into uranium concentrate, converted into gas, and then enriched. And this is where Russia excels.
In 2020, there were just four conversion plants operating commercially -- in Canada, China, France, and Russia. Russia was the largest player, with almost 40 percent of the total uranium conversion infrastructure in the world, and therefore produced the largest share of uranium in gaseous form (called uranium hexafluoride).
Also on the subject of supplying nuclear fuel, CNBC has an article about the only operating US uranium enrichment facility:
UK EVs
Headquartered outside London, Urenco is joinly owned by the British and Dutch goverments and two German utilities. Its New Mexico facility is the only commercial enrichment facility left in the U.S. The last U.S.-owned commercial facility in Paducah, Kentucky, closed in 2013 and its owner the United States Enrichment Corporation went bankrupt during the downturn after Fukushima.
Fourteen years later, the situation has reversed once again. Urenco USA is racing to expand its enrichment capacity. The nuclear industry is gaining momentum as electricity demand in the U.S. is projected to surge from artificial intelligence and the push to expand domestic manufacturing. Doubts persist about whether U.S. power supplies will ramp up quick enough to meet the needs. Increasing uranium enrichment will be a key part of the process, despite the history of past disappointments.
Also, U.S. enriched uranium supplies are at risk. The U.S. still imported 20% of its enriched uranium from Russia in 2024
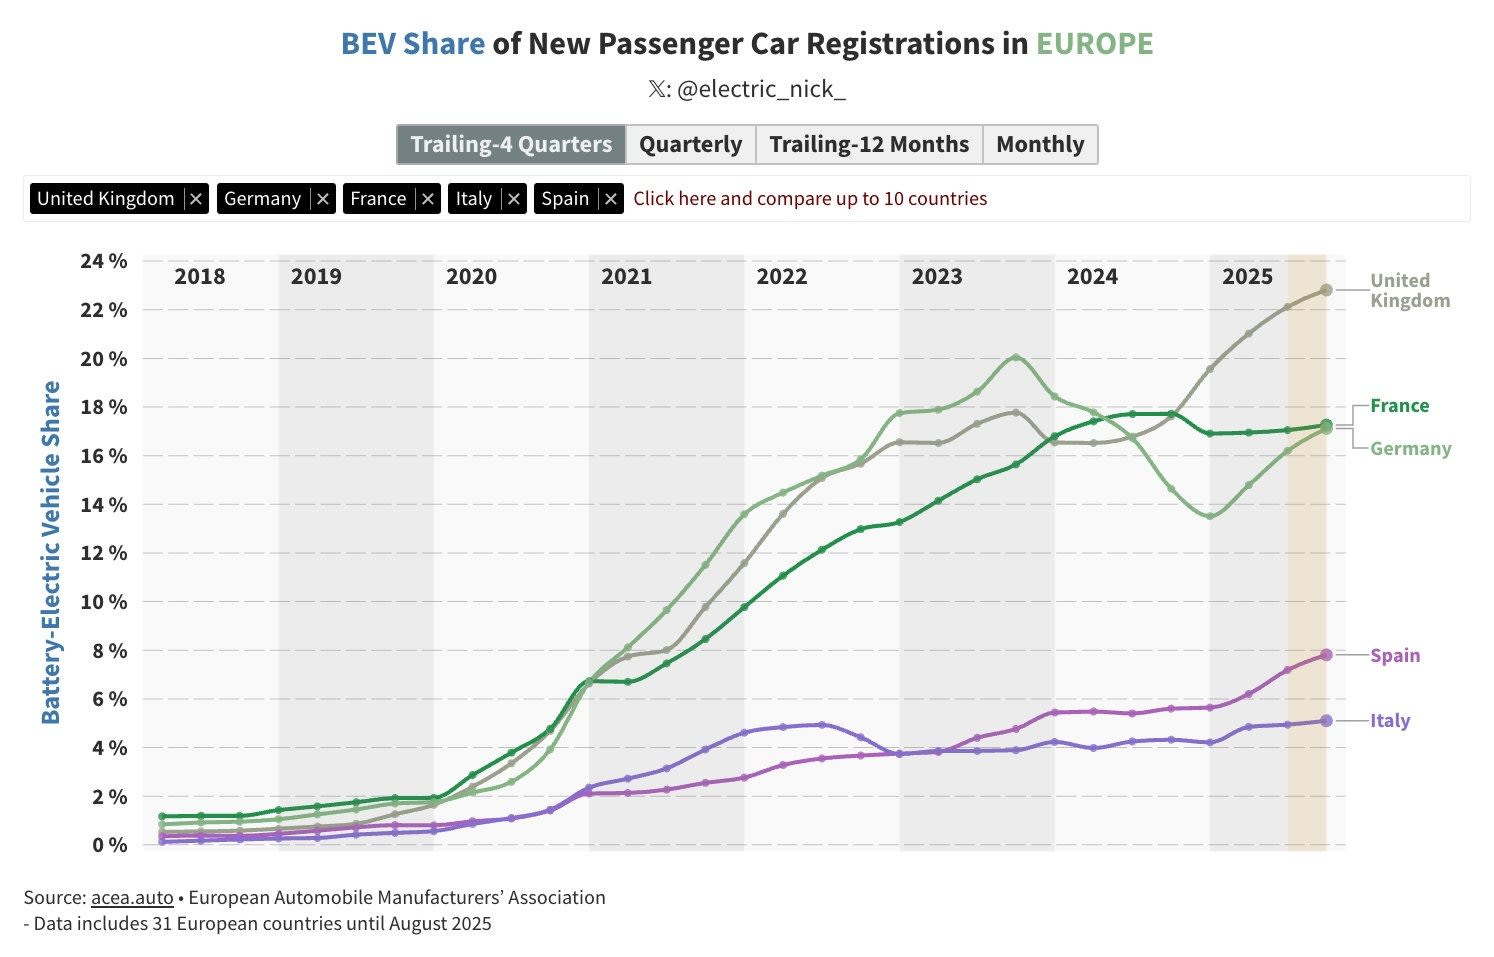
Chinese EV juggernaut BYD is gaining ground all over the world, including (perhaps surprisingly) in the UK. Via the BBC:
Chinese car making giant BYD says the UK has become its biggest market outside China, after its sales there surged by 880% in September compared to a year earlier.
The company says it sold 11,271 cars in the UK last month, with the plug-in hybrid version of its Seal U sports utility vehicle (SUV) accounting for the majority of those sales.
It comes after figures from the car industry body the Society of Motor Manufacturers and Traders (SMMT) showed that sales of electric vehicles (EVs) jumped to a record high in September.
The UK is particularly attractive to firms like BYD as the country has not imposed tariffs on Chinese EVs, unlike other major markets such as the European Union and the US.
BYD, which offers cheaper models than many of its Western rivals, said its share of the UK market jumped to 3.6% in September.
The UK is apparently BYD’s largest market outside of China. Related, the UK also seems to be adopting EVs faster than other European countries. Via Electric Nick:
 Aircraft contrails
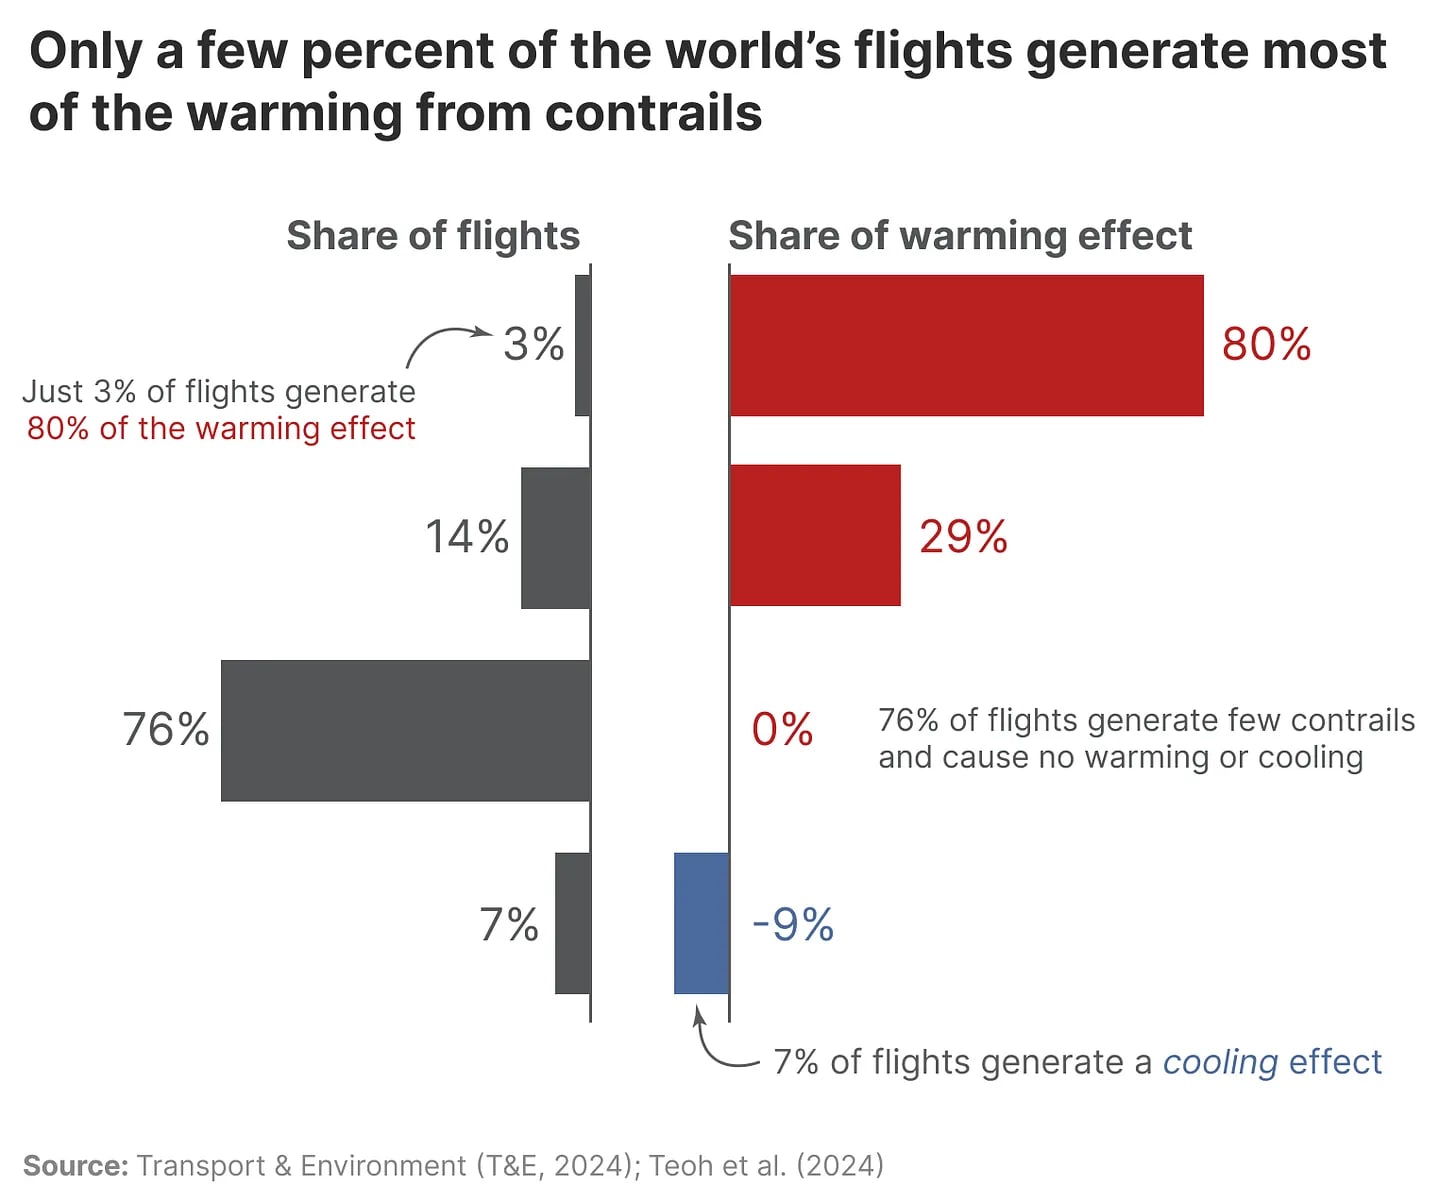
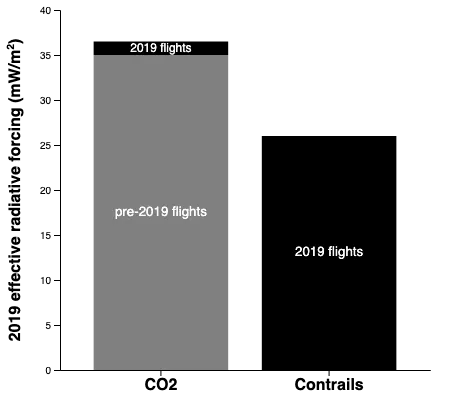
This week I learned that aircraft contrails (short for “condensation trails”) are basically clouds that form from the soot and water vapor exhaust of a jet engine when the aircraft flies through cold, humid air. Because contrails serve to trap reflected solar radiation, they contribute to global warming. But their impact could be greatly reduced by rerouting the very small percent of flights that are likely to form contrails. Via Sustainability by the Numbers:
One crucial reason why eliminating contrails could be so cost-effective is that a very small percentage of flights create the majority of the impact. This means we don’t need to divert or shift the trajectory of all the world’s flights; only a few percent of them.
In the chart below, you can see the breakdown of the warming effect across the world’s flights.4 On the left-hand side, we have the share of flights, and on the right, their collective contribution to the total warming impact of contrails.
Just 3% of flights generate 80% of the warming. A further 14% generate 29%.
You might notice that this sums to 109%. But this is because some flights generate a cooling effect of 9%. Put them together and we get 100%.
Most flights — three-quarters of them — barely generate contrails at all and cause no warming or cooling.
October 9, 2025
Why Are So Many Pedestrians Killed by Cars in the US?
It’s unfortunately not uncommon for pedestrians to be killed by cars in the US. More than 7,300 pedestrians were killed in motor vehicle accidents in the US in 2023, around 18% of all motor vehicle deaths that year. Until around 2009, pedestrian deaths in the US had been falling, declining from 7,516 deaths in 1975 to just 4,109 in 2009 (in per capita terms, this decline would be even larger.) But since 2009, pedestrian deaths have surged.
!function(){"use strict";window.addEventListener("message",(function(e){if(void 0!==e.data["datawrapper-height"]){var t=document.querySelectorAll("iframe");for(var a in e.data["datawrapper-height"])for(var r=0;r<t.length;r++){if(t[r].contentWindow===e.source)t[r].style.height=e.data["datawrapper-height"][a]+"px"}}}))}();Motor vehicle deaths overall are up, but not nearly to the same degree. From 2009 to 2023, non-pedestrian motor vehicle deaths in the US increased by around 13%, compared to a 78% increase in pedestrian deaths. (The low point in non-pedestrian motor vehicle deaths is actually 2014; deaths are up 20% since then.)
!function(){"use strict";window.addEventListener("message",(function(e){if(void 0!==e.data["datawrapper-height"]){var t=document.querySelectorAll("iframe");for(var a in e.data["datawrapper-height"])for(var r=0;r<t.length;r++){if(t[r].contentWindow===e.source)t[r].style.height=e.data["datawrapper-height"][a]+"px"}}}))}();Other countries haven’t seen this increase in pedestrian deaths: in every other high-income country, rates are flat or declining. Whatever’s causing the problem seems to be limited to the US.
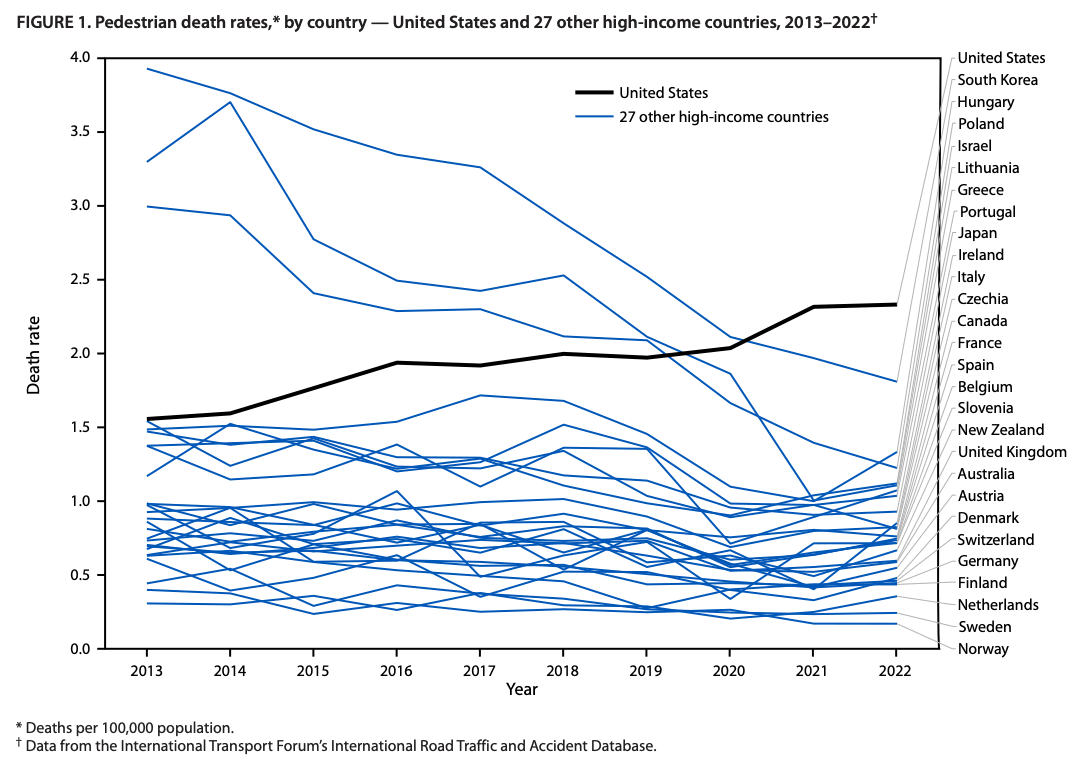 Via the CDC.
There are a variety of theories for what’s causing this increase in pedestrian deaths. Perhaps the most common theory is that as trucks and SUVs have become both more popular and larger (in height and overall size), pedestrian collisions have become more frequent and more deadly. Another theory (one that’s harder to square with the “US only” nature of the phenomenon) is that drivers are increasingly distracted by smartphones, leading to more accidents. And of course, it could be something else entirely, such as drivers becoming more reckless for some reason.
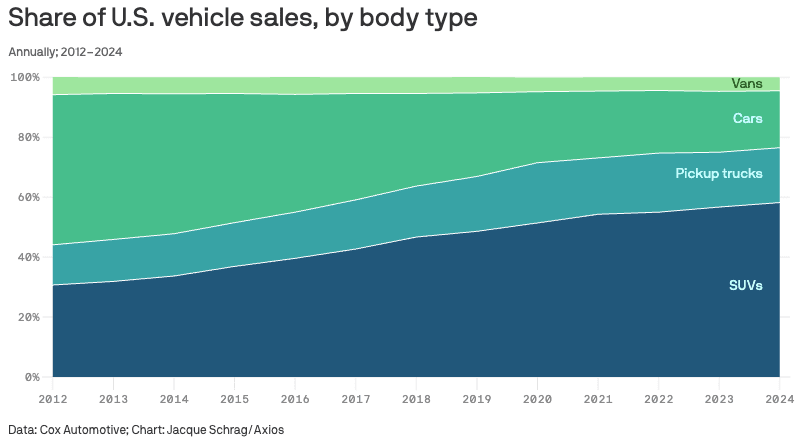 Via Axios.
Looking at the data, the strongest evidence seems to be for the “big SUV” hypothesis: the fatality rate for pedestrian accidents has increased dramatically across a variety of states, pointing to “pedestrian accidents becoming more deadly” as a major cause of the increase. But the case for it isn’t open and shut, as pedestrian deaths involving sedans and compacts have also increased. And while there isn’t much evidence for the “distracted by phones” hypothesis, it’s also hard to rule it out completely.
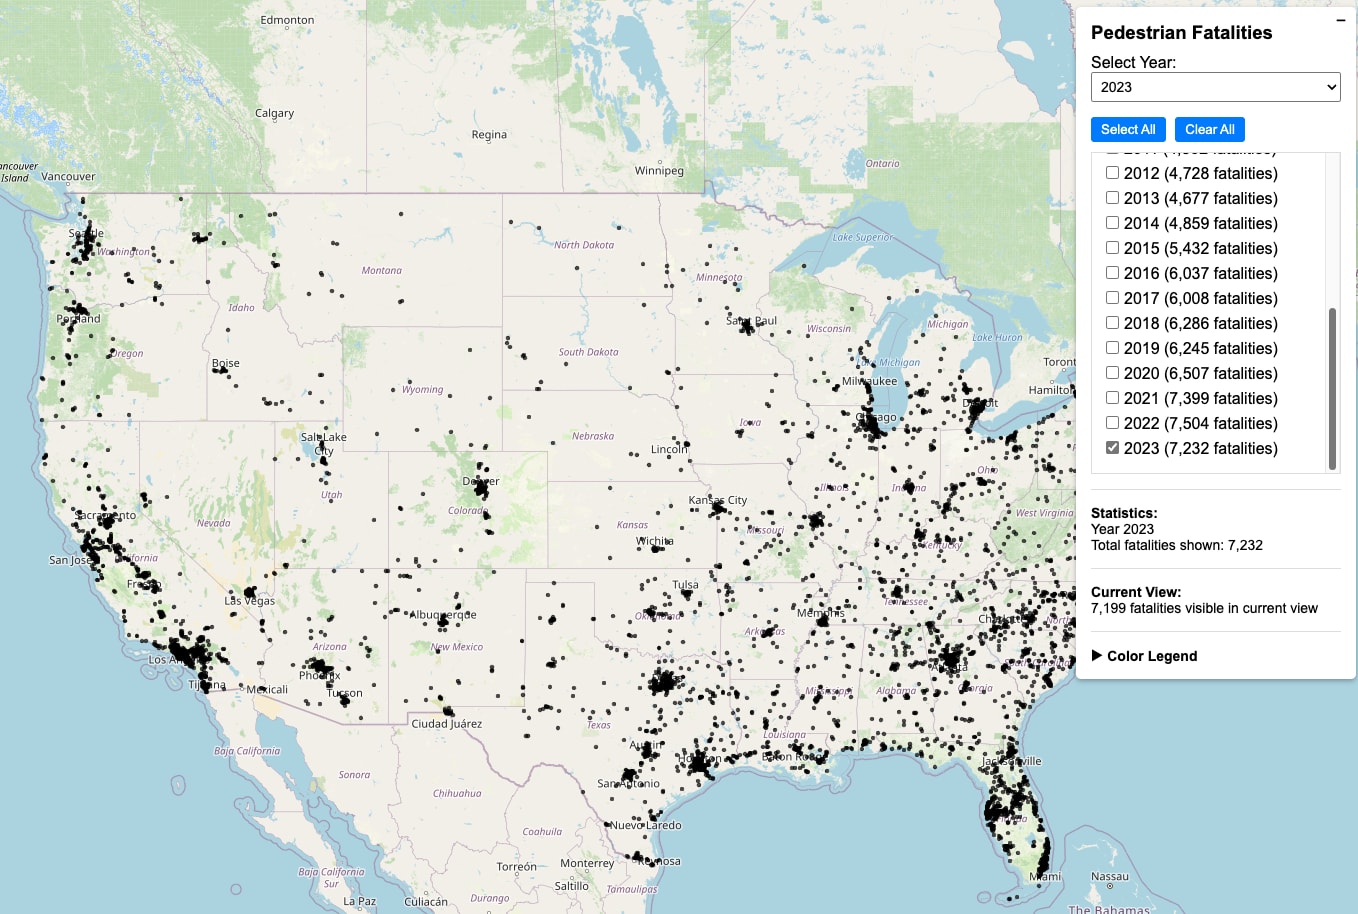
Pedestrian deaths in the USTo investigate US pedestrian fatalities, we can use NHTSA Fatality Analysis Reporting System (FARS) data, which collects information on motor vehicle fatalities going back to 1975. FARS data is very thorough (it includes vehicle identification numbers, or VINs, the time of accident down to the minute, and the exact coordinates of the crash), making it possible to investigate a variety of possible explanations for the fatality increase. To start, let’s get a sense of where these pedestrian deaths are happening. The map below shows every pedestrian death in the continental US in 2023: each dot is a pedestrian death.

This is one of those maps that’s also a population map — pedestrian deaths tend to be concentrated in major metro areas, where there’s the most people and the most driving. If we look at pedestrian deaths by state, we see the same pattern, though it’s also clear some states are punching above and below their weight. The three states with the most pedestrian deaths — California, Florida, and Texas — are the three most populous states. But New York, the 4th most populous state, has fewer pedestrian deaths than Georgia, the 8th most populous state.
!function(){"use strict";window.addEventListener("message",(function(e){if(void 0!==e.data["datawrapper-height"]){var t=document.querySelectorAll("iframe");for(var a in e.data["datawrapper-height"])for(var r=0;r<t.length;r++){if(t[r].contentWindow===e.source)t[r].style.height=e.data["datawrapper-height"][a]+"px"}}}))}();If we look at pedestrian deaths per capita, we see that deaths are much more frequent in the West and the South, and less frequent in the Northeast and the Midwest. This does not appear to be due to larger amounts of driving in the South and the West. There’s little correlation between the number of vehicle miles traveled and the pedestrian death rate.
!function(){"use strict";window.addEventListener("message",(function(e){if(void 0!==e.data["datawrapper-height"]){var t=document.querySelectorAll("iframe");for(var a in e.data["datawrapper-height"])for(var r=0;r<t.length;r++){if(t[r].contentWindow===e.source)t[r].style.height=e.data["datawrapper-height"][a]+"px"}}}))}();!function(){"use strict";window.addEventListener("message",(function(e){if(void 0!==e.data["datawrapper-height"]){var t=document.querySelectorAll("iframe");for(var a in e.data["datawrapper-height"])for(var r=0;r<t.length;r++){if(t[r].contentWindow===e.source)t[r].style.height=e.data["datawrapper-height"][a]+"px"}}}))}();These numbers are all from 2023. If we look at the change in pedestrian deaths over time, we can see that the rise in pedestrian deaths is worse in the South, but besides a handful of states (Minnesota, Rhode Island, New York, West Virginia, New Jersey, and Vermont), every state has seen substantial increases in pedestrian deaths. Whatever’s causing the increase in US pedestrian deaths is happening across the country.
We’ve seen that pedestrian deaths are more likely to occur in population centers, but FARS data also lets us look at the type of road where deaths occur:
!function(){"use strict";window.addEventListener("message",(function(e){if(void 0!==e.data["datawrapper-height"]){var t=document.querySelectorAll("iframe");for(var a in e.data["datawrapper-height"])for(var r=0;r<t.length;r++){if(t[r].contentWindow===e.source)t[r].style.height=e.data["datawrapper-height"][a]+"px"}}}))}();The increase in fatalities is essentially entirely on urban roads — deaths on rural roads are flat. On most categories of urban road, pedestrian fatalities have doubled. Whatever is causing the increase in pedestrian deaths, it’s only happening in urban areas.
We can also look at other trends in pedestrian deaths for clues as to why they might be increasing. Here are pedestrian deaths by the hour the accident occurred, from 2007 to 2023:
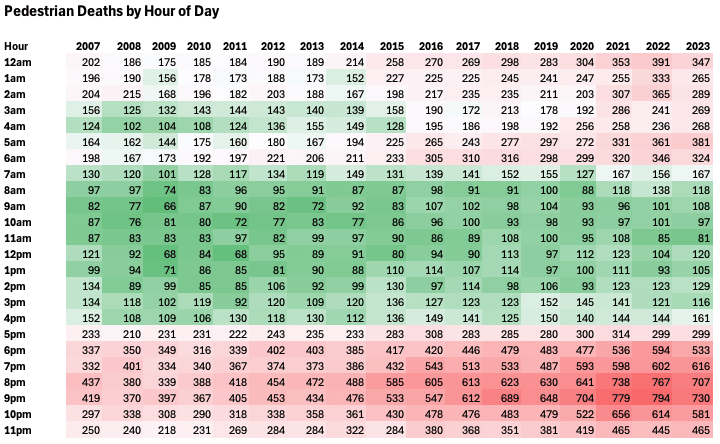
And here’s the same chart in percentages:
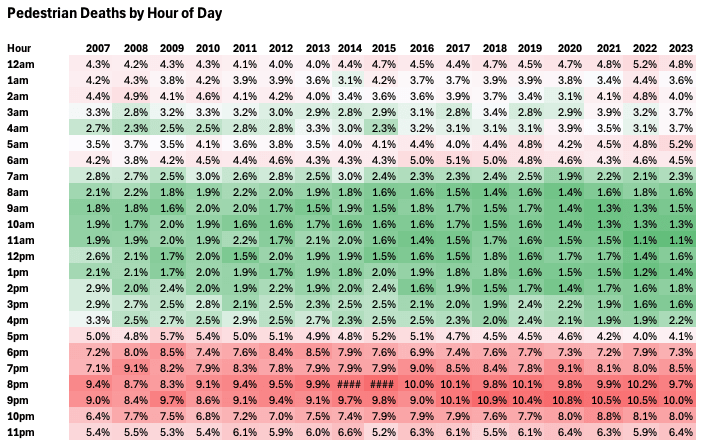
Most pedestrian deaths occur at night, but the rate hasn’t changed much (the fraction of deaths between 6pm and 6am is up slightly from 69% in 2009 to 75% in 2023). Whatever’s causing the increase in pedestrian deaths doesn’t seem specific to one time of day.
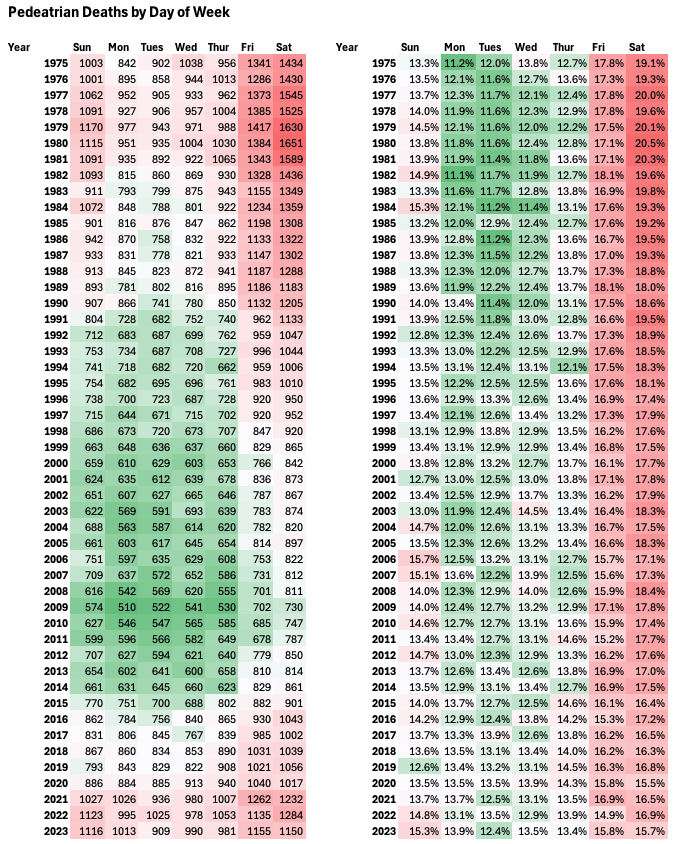
Nor is it specific to one time of week. Deaths have become somewhat less likely to occur on Friday and Saturday, and somewhat more likely to occur during the week, but the shift isn’t dramatic.
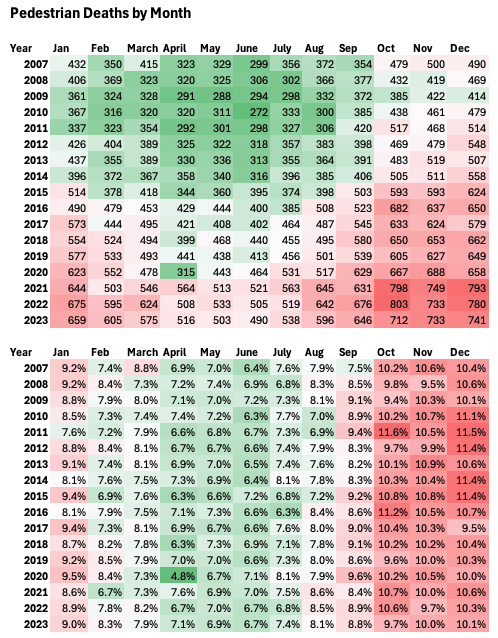
It’s also not specific to one time of year. The graph below shows pedestrian fatality frequency by month. Pedestrian deaths are more likely to occur in the fall and winter (presumably because there are fewer daylight hours and more driving in darkness), but monthly rates haven’t changed at all.
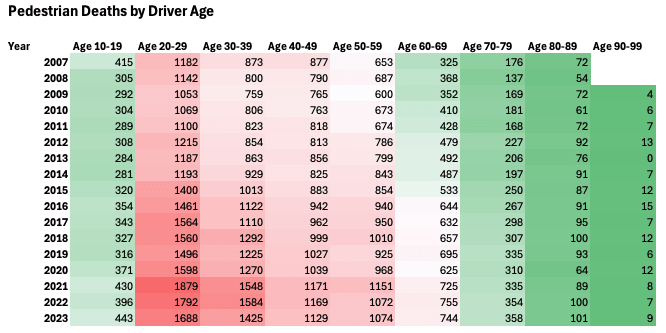
What about trends in the age of pedestrians killed? You sometimes see claims that children are increasingly at risk of getting killed by large trucks and SUVs, because they can’t be seen by the drivers. The graph below shows pedestrian deaths broken down into 10-year age buckets.
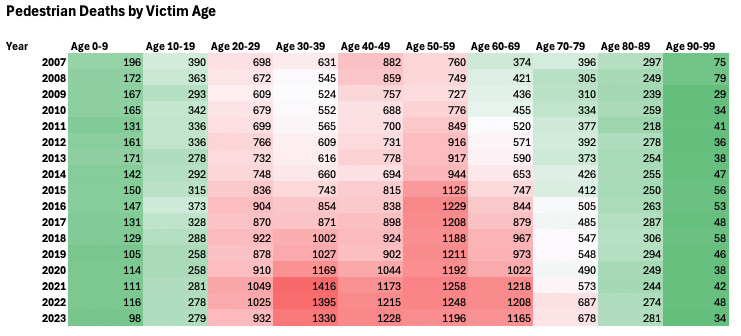
Deaths of children under 10 are actually down significantly (167 deaths in 2009 to 98 deaths in 2023), and deaths for ages 10-19 are down as well. The biggest increase in deaths actually comes from older age brackets: 30-39 year old deaths are up 153%, 60-69 year olds up 167%, and 70-79 year olds up 119%. So the problem isn’t young kids increasingly getting hit by cars that can’t see them.
What about the age of drivers?
Deaths are up in every driver age bracket, with older brackets (30-39, 60-69 and 70-79) up the most in percentage terms. So the problem isn’t reckless young drivers.
What about trends in drug and alcohol use? According to FARS data, deaths that involved drivers drinking are up modestly, but are a very small fraction of overall pedestrian deaths. The increase in driver drug use is up by a much greater fraction (more than doubling since 2009), but it’s still a small percentage of pedestrian deaths.
!function(){"use strict";window.addEventListener("message",(function(e){if(void 0!==e.data["datawrapper-height"]){var t=document.querySelectorAll("iframe");for(var a in e.data["datawrapper-height"])for(var r=0;r<t.length;r++){if(t[r].contentWindow===e.source)t[r].style.height=e.data["datawrapper-height"][a]+"px"}}}))}();Interestingly, driver drug and alcohol use in pedestrian fatalities is greatly exceeded by pedestrian alcohol and drug use. (Pedestrian drug use in particular has more than tripled since 2009, while alcohol use is only up modestly.) It’s not enough to explain all of the huge increase in pedestrian deaths, but it’s notable.
An obvious possible factor in increased deaths is people increasingly distracted by their phones. Unfortunately, FARS data doesn’t give us much to go on here. Since 2010 FARS has tracked whether drivers are distracted (by phones or anything else), but in the vast majority (94%) of cases, drivers are marked “not distracted,” “not reported,” or “unknown.”
!function(){"use strict";window.addEventListener("message",(function(e){if(void 0!==e.data["datawrapper-height"]){var t=document.querySelectorAll("iframe");for(var a in e.data["datawrapper-height"])for(var r=0;r<t.length;r++){if(t[r].contentWindow===e.source)t[r].style.height=e.data["datawrapper-height"][a]+"px"}}}))}();Relatedly, in the majority of pedestrian deaths, the pedestrian is blamed for the accident. In 66% of cases, pedestrians are described as “failing to yield right of way,” “jaywalking,” or “in roadway improperly.” In 87% of cases, the driver is not charged with anything following the accident. (This doesn’t necessarily mean the pedestrian was at fault — it could simply indicate that in a pedestrian death we only get one side of the story, which makes it hard to charge the driver with a crime.) About 75% of the time, fatal pedestrian accidents occur outside an intersection (a rate which has been steady since 2010), suggesting pedestrians are most often struck outside of a crosswalk.
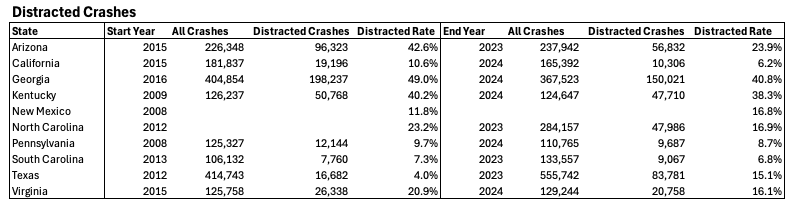
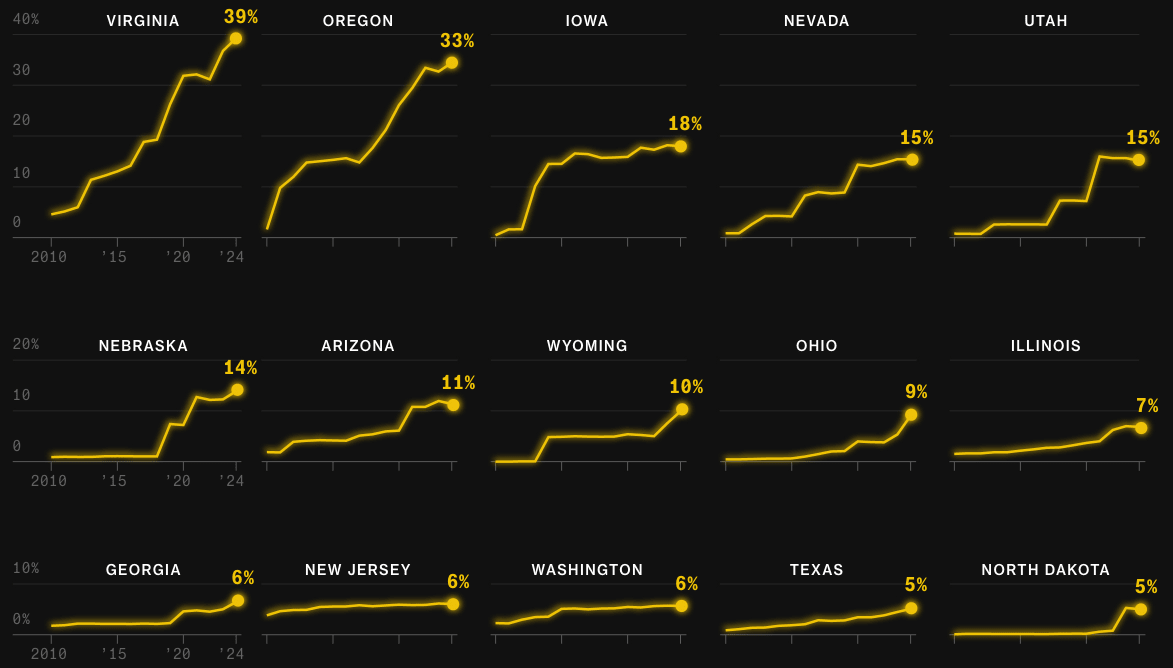
!function(){"use strict";window.addEventListener("message",(function(e){if(void 0!==e.data["datawrapper-height"]){var t=document.querySelectorAll("iframe");for(var a in e.data["datawrapper-height"])for(var r=0;r<t.length;r++){if(t[r].contentWindow===e.source)t[r].style.height=e.data["datawrapper-height"][a]+"px"}}}))}();!function(){"use strict";window.addEventListener("message",(function(e){if(void 0!==e.data["datawrapper-height"]){var t=document.querySelectorAll("iframe");for(var a in e.data["datawrapper-height"])for(var r=0;r<t.length;r++){if(t[r].contentWindow===e.source)t[r].style.height=e.data["datawrapper-height"][a]+"px"}}}))}();!function(){"use strict";window.addEventListener("message",(function(e){if(void 0!==e.data["datawrapper-height"]){var t=document.querySelectorAll("iframe");for(var a in e.data["datawrapper-height"])for(var r=0;r<t.length;r++){if(t[r].contentWindow===e.source)t[r].style.height=e.data["datawrapper-height"][a]+"px"}}}))}();One limitation of the FARS data is that it only tracks pedestrian fatalities: it doesn’t give us any information or trends in non-fatal pedestrian accidents. Many states, however, do track this information. The chart below shows the total number of accidents involving a pedestrian, and the number of pedestrian fatalities, for different years for 20 different states.
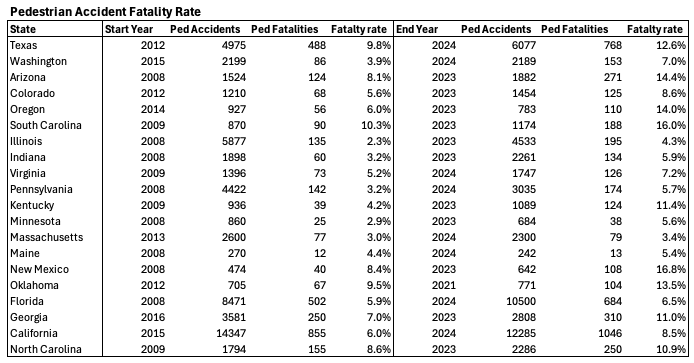
In nearly every state examined, the fatality rate for pedestrian accidents has risen dramatically in recent years. Oregon went from deaths in 6% of accidents in 2014 to 14% of accidents in 2023. Illinois went from 2.3% of pedestrian accidents being deadly in 2008 to 4.3% in 203. New Mexico went from 8.4% in 2008 to 16.8% in 2023. In many cases, overall pedestrian accidents were flat or even down (Illinois went from 5,877 accidents in 2008 to 4,533 accidents in 2023), even as the number of pedestrian fatalities went up.
Pedestrian accidents getting more deadly seems like fairly strong evidence for the theory that the rise in large SUVs is behind the uptick in pedestrian deaths: it’s not that more pedestrians are getting hit by vehicles, it’s that the ones that are getting hit are more likely to die. There’s other evidence that points to this theory. A study by the Insurance Institute for Highway Safety analyzed 17,897 pedestrian accidents across seven states, and found pedestrians were substantially more likely to be killed when struck by tall vehicles and vehicles with blunt front ends.
However, there’s also some muddying evidence here. If the increase of size and frequency of trucks and SUVs was behind the increase in pedestrian deaths, we wouldn’t expect to see an increase in the frequency of pedestrians killed by sedans or compact cars. However, if we look at pedestrian deaths by model of car, we see that pedestrian deaths involving popular sedans have increased as well. Pedestrian deaths involving Honda Civics and Accords, Toyota Corollas and Camrys, and Nissan Altimas have all increased substantially.
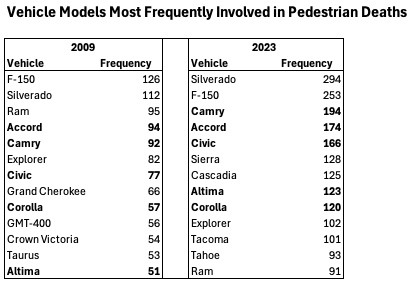
This does not seem to be because these cars suddenly got more popular. Sales volume since the early 2000s is relatively flat or declining:
!function(){"use strict";window.addEventListener("message",(function(e){if(void 0!==e.data["datawrapper-height"]){var t=document.querySelectorAll("iframe");for(var a in e.data["datawrapper-height"])for(var r=0;r<t.length;r++){if(t[r].contentWindow===e.source)t[r].style.height=e.data["datawrapper-height"][a]+"px"}}}))}();One possible explanation is that pedestrian accidents are more deadly because cars are speeding more frequently, but it’s hard to find evidence of this. The proportion of vehicles speeding in both pedestrian fatalities and fatalities in car accidents overall is flat.
!function(){"use strict";window.addEventListener("message",(function(e){if(void 0!==e.data["datawrapper-height"]){var t=document.querySelectorAll("iframe");for(var a in e.data["datawrapper-height"])for(var r=0;r<t.length;r++){if(t[r].contentWindow===e.source)t[r].style.height=e.data["datawrapper-height"][a]+"px"}}}))}();On the state level, different states have dramatically different speeding rates (presumably due to classification differences), but overall rates of speeding collisions seem to be mostly flat or declining.
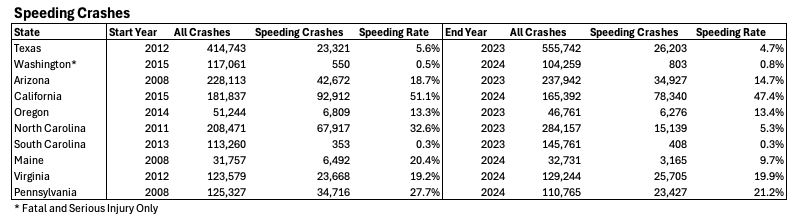
We can also use state-level data to look at the “distracted by phones” theory: some states break out whether “distraction” or “driver inattention” is a factor in an accident. The chart below shows the percentage of all accidents where driver inattention (due to phones or anything else) was a listed factor. If being distracted by phones was a major driver of increased pedestrian fatalities, I’d expect it to also be increasingly a factor in car accidents more broadly.
There’s no real clear trend. In some states (such as Texas) the frequency of driver inattention as a factor has increased dramatically over time. But in other states it’s either flat (South Carolina, Kentucky), or has decreased substantially (Arizona, California). This doesn’t necessarily disconfirm the phone theory, as drivers may not be reporting that they were distracted (North Carolina’s annual car crash reports, for instance, note that “Driver Distraction is a self-reporting contributing circumstance. Therefore, the data collected may not reflect the severity of this issue.” But it’s some evidence against it.
Similarly, if being distracted by phones was a driver of pedestrian deaths, I’d expect there to be more frequent collisions overall. But the state-level data similarly doesn’t show any consistent trend. In some states (Texas, South Carolina) collisions are up substantially, though the rate of increase is less than for pedestrian deaths. But in California and Georgia, among others, they’re down.
ConclusionTo recap, here’s what we know about pedestrian deaths.
Pedestrian deaths have risen substantially in the US since 2009, by nearly 80%. This increase is seen across the US, though not in every single state. The increase is highest in states in the West and South. There has not been a similar increase in other types of motor vehicle deaths, or in pedestrian deaths in other countries.
The increase has happened almost entirely on urban roads: pedestrian deaths on rural roads have remained roughly constant.
There has not been much change in what time of day, day of week, or time of year pedestrian deaths are occurring.
The 30-39 and 60-79 age brackets have seen the largest increase in victims. Pedestrian deaths of children and teenagers are down over this period. In terms of drivers, the increase has also been largest in the 30-39 and 60-79 age brackets.
It’s hard to pin the increase to any specific driver behavior on the road (including mobile phone use). Drivers are rarely charged with a motor vehicle violation following a pedestrian death, and are rarely categorized as “distracted” (by a phone or anything else). State-level data on frequency of driver inattention shows no consistent trends. Rates of driver drinking are only up modestly; rates of driver drug use have risen greatly in percentage terms, but remain a very small fraction of overall pedestrian death accidents. There doesn’t seem to be a clear trend in rates of collisions overall. Drivers don’t seem to be speeding more.
In terms of pedestrian behavior, the number of killed pedestrians believed to be using drugs has risen substantially over the period in question, but is still a small fraction of overall pedestrian deaths. Rates of alcohol use by pedestrians have increased modestly. In roughly 2/3rds of pedestrian deaths, the pedestrian is described as “failing to properly yield,” “jaywalking,” or as otherwise improperly in the roadway.
In terms of changes in the nature of vehicles, the fatality rate of pedestrian accidents (the proportion of accidents where a pedestrian is killed) has increased dramatically across many different states, suggesting pedestrian accidents are getting more deadly. The frequency of pedestrian deaths in both trucks/SUVs and sedans/compacts has risen substantially.
Unfortunately, this doesn’t all add up to a clear cause. The strongest evidence seems to be for the “Big SUV hypothesis” — it’s hard to see what else could be causing the increase in deadliness of pedestrian accidents, and not cause a similar increase in other things. The Big SUV hypothesis also seems like something that could be limited to the US. But this on its own isn’t completely satisfying: if its big SUVs, why are pedestrian deaths for sedans increasing too? Why aren’t deaths increasing on rural roads? There are still unanswered questions here.
The evidence does not strongly support the “distracted drivers on cell phones” hypothesis, but neither does it totally disconfirm it. The fact that drivers are rarely charged with anything, and are rarely classified as having been driving distracted, could simply be due to the fact that we rarely get more than the driver’s side of the story in pedestrian fatalities. The fact that there’s not a general trend in more auto collisions, or more pedestrian non-fatal collisions, does push against this theory though.
Beyond these hypotheses, there’s also some evidence that increased drug use (both in drivers and pedestrians) is a factor in increased deaths, though almost certainly not the main one. We also can’t rule out that increased recklessness or distractedness on the part of pedestrians is playing a role.
One avenue to try and better understand this problem is to look at the level of individual cities, and to try to figure out why places like Boston and Seattle have so few pedestrian deaths compared to other cities.
October 4, 2025
Reading List 10/04/2025
 Dai Heiwa Kinen Tō, Japan.
Welcome to the reading list, a weekly roundup of news and links related to buildings, infrastructure, and industrial technology. This week we look at Boeing’s 737 replacement, parking lot investments, a deflected hurricane, opinions on nuclear power, and more. Roughly 2/3rds of the reading list is paywalled, so for full access become a paid subscriber.
No essay this week, but I’m finishing up an essay about the rise in pedestrians killed in motor vehicle accidents that will be out next week.
Thanks to those of you who were able to come out to the book launch party last Friday!
Boeing’s 737 replacementBoeing is finally working on a new clean-sheet aircraft to replace the aging and beleaguered 737 MAX. This is a big deal, not just because single aisle, twin-engine aircraft (of which the 737 is a type) sell in larger volumes by far than any other aircraft, but because if completed it will be the first clean-sheet aircraft Boeing has developed since the 787, which first flew in 2009. Via the Wall Street Journal ($):
Earlier this year, Chief Executive Kelly Ortberg met with officials from Rolls-Royce Holdings in the U.K., two of the people said, where they discussed a new engine for the aircraft. Ortberg appointed a new senior product chief in Boeing’s commercial plane business, whose prior role was developing a new type of aircraft.
Boeing has also been designing the flight deck of a new narrow-body aircraft, according to a person familiar with the plans.
This new aircraft is in early-stage development and plans are still taking shape, some of the people said.
Boeing’s plans represent a shift for the company, which had put some new aircraft development work on the back burner while it navigated multiple challenges. They are also a sign that the company is betting that a cutting-edge plane design could power its business for the next few decades.
Ortberg hasn’t publicly detailed any plans for a 737 successor. He has consistently said that fixing Boeing’s long-running quality and manufacturing problems, and shoring up its balance sheet, are his priorities.
Developing a new aircraft can typically only be justified when it comes with a substantial fuel savings, so it’ll be interesting to see what strategies Boeing pursues to try to achieve that.
Ticketing a WaymoWe’ve gotten used to hearing about the confabulations and errors that LLMs make, and Tesla is often in the news for some sort of unfortunate Full Self Drive error. Waymo’s self-driving cars appear to be incredibly safe in general (most of their accidents seem to be the fault of other cars), but I guess it shouldn’t be surprising that they also make the occasional error. Of those errors, some percentage of them will violate traffic laws, and some percentage of those violations will be observed by the police, who will then pull the car over. From the Guardian:
During a DUI enforcement operation, officers in San Bruno pulled over a car without anyone behind the wheel after the autonomous vehicle made an illegal U-turn at a light. A post by the San Bruno police department on Saturday shows an officer looking into a Waymo – the leading autonomous ride-hailing vehicle in the San Francisco Bay Area – after stopping the signature white car.
“Since there was no human driver, a ticket couldn’t be issued (our citation books don’t have a box for “robot”),” reads the post.
The department said that it had alerted Waymo of the glitch, and that “hopefully the reprogramming will keep it from making any more illegal moves”.
In a statement, Waymo said that the company’s autonomous driving system, the Waymo Driver, “is designed to respect the rules of the road.
“We are looking into this situation and are committed to improving road safety through our ongoing learnings and experience,” reads a statement sent to the Guardian.
Apparently this isn’t the first time a Waymo has been pulled over by the police.
This actually made me wonder what Waymo’s policy is for handling police interactions: apparently, it’s to flag a remote operator, who can then interact with the police via the speakers.
Parking lot investmentsThe enormous volume of data center construction in the US is also driving demand for all other sorts of goods and services. Electricity is one obvious one, as are the semiconductor chips that go inside the facilities. Here’s one I hadn’t clocked: empty lots to store construction materials while the facilities are being built. These lots are known as “industrial outdoor storage” (IOS), and demand for them is apparently booming: Via the New York Times:
Data center electricity demand by state
Since 2021, institutional investors have poured more than $4.7 billion in the sector, said Matt Hunsucker, principal at the development firm Mackenan and founder of IOS List, an industry newsletter. Those same investors, which include pension funds, mutual funds, large banks and asset managers, accounted for less than $600 million of total investments in IOS properties from 2015 to 2020, he said.
The new wave of investments has come as Wall Street races to profit from A.I. in whatever way it can. Financial giants like Blackstone have invested hundreds of billions not only in data centers but also the construction firms that build the centers and power plants that supply the electricity needed to run them.
Data centers have created “tremendous demand for IOS use, every bit as much as traditional infrastructure work like bridges, tunnels and roads,” said Leo Addimando, managing partner of Alterra.
We recently looked at trends in wholesale electricity prices - the prices utilities and other large consumers of electricities pay for power on power markets. Bloomberg also has a piece on trends in wholesale electricity prices, associating them with increase in data center electricity demand. Per the article, “Of the nodes that recorded price increases, more than 70% are located within 50 miles of significant data center activity.”
I don’t find this particularly convincing, but the article also has a very interesting chart showing which states have the greatest demand in electricity from data centers. Demand is (unsurprisingly) highest in Virginia, where data centers make up 39%(!) of electricity demand, but it’s also surprisingly high in Oregon (Oregon ranks 27th by population, but 9th in number of data centers, according to Data Center Map). Assuming this is accurate, perhaps this is why Oregon has so much power capacity in the interconnection queue.
September 27, 2025
Reading List 09/27/25
 The S1500, China’s new 1 megawatt flying wind turbine.
Welcome to the reading list, a weekly roundup of news and links related to buildings, infrastructure, and industrial technology. This week we look at energy permitting, Chicago’s “affordable” housing, China’s new arctic shipping route, Volvo armored cars, and more. Roughly 2/3rds of the reading list is paywalled, so for full access become a paid subscriber!
Some housekeeping items this week:
Paid newsletter subscribers can get 25% off on preorders for “The Origins of Efficiency” if they order from Stripe Press before October 8th. Details and coupon code below the paywall.
I wrote a whitepaper for the Aspen Institute about construction productivity.
Energy permittingMy colleague Aidan Mackenzie has a good Twitter thread on some fundamental issues with federal energy permitting. Permitting requirements are generally written with the assumption that the government will try to get stuff built, and so are designed to prevent the government from going too fast and skimping (perceived) critical steps like environmental review or stakeholder engagement. But there’s nothing that prevents the government from deliberately slowing down the permitting process for projects it doesn’t like. Right now this is getting weaponized against wind and solar projects, but the same tactics can easily be used against oil and gas projects:
 Chicago affordable housing isn’t
“Affordable housing” is housing built specifically for low income residents, generally under the auspices of a specific program or tax credit system such as the Low Income Housing Tax Credit (LIHTC). Despite its name, it’s often not particularly affordable to build: California affordable housing costs 1.5x as much to build as market-rate housing. Partly this is because of the various hoops the government requires affordable housing developers to jump through. In Chicago, apparently developers are required to provide records showing if they’ve ever “invested in or profited from slavery”. Via Alec Stapp on Twitter:
 BYD sets fastest production car record
The origins of Tesla can be traced to a company called AC Propulsion, which made an electric sports car called the tzero in the 1990s (which eventually evolved into the Tesla Roadster). The tzero could do 0 to 60 in 4.07 seconds (slightly slower than a base model Porsche 911), and (depending on the configuration) had a top speed of 170 miles per hour. So it’s not totally surprising to me when EVs have extremely impressive performance.
In that vein, BYD just set a new speed record for fastest production car with its Yangwang U9 Extreme EV. Via Car and Driver:
The YangWang U9 Xtreme (formerly the YangWang U9 Track Edition) just blew the whole competition out of the water. Forget about acceleration for a moment, the U9 Xtreme just hit a top speed of 308.4 mph, making it not only the fastest electric car on the planet, but the fastest car. Period.
A matter of weeks after demolishing the top-speed record for production EVs, the YangWang headed back to the ATP Papenburg oval track in Germany for another go. It was once again driven by German racer Marc Basseng, who piloted the hypercar beyond the previous record-holding Bugatti Chiron Super Sport 300+, which managed 304.8 back in 2019.
In other BYD news, Warren Buffett’s Berkshire Hathaway is fully selling its stake in the company, which at its peak was worth $7.7 billion before it began to divest in 2022.
AI in radiologyRadiology, the field of medicine which uses imaging (X-rays, MRIs, PET scans) to diagnose and treat disease, has long been thought to be ripe for disruption by AI: learning which patterns on images correspond to different diseases seems like the exact sort of thing that machine learning systems should be good at, and godfather of AI Gregory Hinton predicted in 2016 that AI would be superior to radiologists in five years. But almost 10 years later, radiology as a field is still going strong. Works in Progress has a good piece on why radiology hasn’t been disrupted:
“The Origins of Efficiency” 25% discount
…companies like Annalise.ai, Lunit, Aidoc, and Qure.ai have released models that can detect hundreds of diseases across multiple types of scans with greater accuracy and speed than human radiologists in benchmark tests. Some products can reorder radiologist worklists to prioritize critical cases, suggest next steps for care teams, or generate structured draft reports that fit into hospital record systems. A few, like IDx-DR, are even cleared to operate without a physician reading the image at all. In total, there are over 700 FDA-cleared radiology models, which account for more than three-quarters of all medical AI devices…
But demand for human labor is higher than ever. In 2025, American diagnostic radiology residency programs offered a record 1,208 positions across all radiology specialties, a four percent increase from 2024, and the field’s vacancy rates are at all-time highs. In 2025, radiology was the second-highest-paid medical specialty in the country, with an average income of $520,000, over 48 percent higher than the average salary in 2015.
Three things explain this. First, while models beat humans on benchmarks, the standardized tests designed to measure AI performance, they struggle to replicate this performance in hospital conditions. Most tools can only diagnose abnormalities that are common in training data, and models often don’t work as well outside of their test conditions. Second, attempts to give models more tasks have run into legal hurdles: regulators and medical insurers so far are reluctant to approve or cover fully autonomous radiology models. Third, even when they do diagnose accurately, models replace only a small share of a radiologist’s job. Human radiologists spend a minority of their time on diagnostics and the majority on other activities, like talking to patients and fellow clinicians.
Artificial intelligence is rapidly spreading across the economy and society. But radiology shows us that it will not necessarily dominate every field in its first years of diffusion — at least until these common hurdles are overcome. Exploiting all of its benefits will involve adapting it to society, and society’s rules to it.
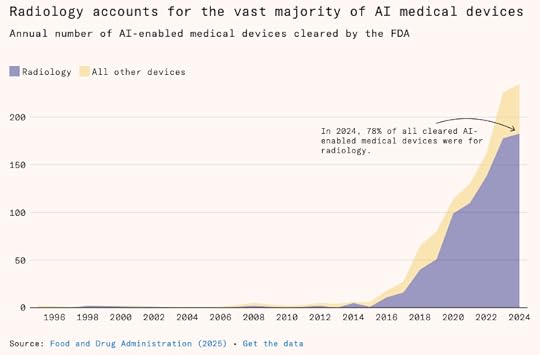
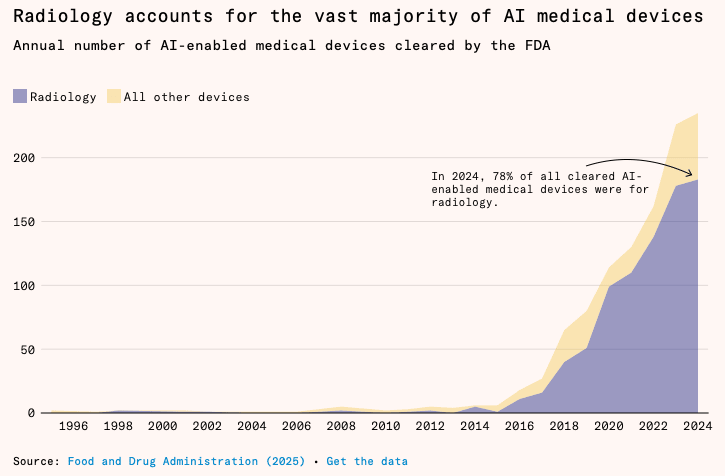
September 25, 2025
How Common Is Accidental Invention?
 William Perkin, inventor of mauve dye.
One of the most important inventions of the 19th century was mauve dye, the first synthetic aniline dye. First synthesized by William Perkin in 1856 out of coal tar, mauve led to the creation of an entire synthetic dye industry. Within a few years, many other aniline dyes, such as magenta, aniline blue, aniline yellow, and aniline black had been discovered, and large industrial operations had sprung up to manufacture them. The synthetic dye industry ultimately evolved into the industrial chemical industry in the late 19th century (using coal and coal-tar as its primary feedstock). Synthetic die manufacturing was also the industry where the first industrial R&D labs appeared, formed to uncover new chemical knowledge in service of creating better and more efficient dyes and dyeing processes.
Beyond the industry that it spawned, mauve is notable for having been invented accidentally. Perkin stumbled upon mauve when trying to synthesize quinine, a treatment for malaria that was only obtainable from the bark of the cinchona tree. In one of his attempts, Perkin found that instead of the colorless quinine, he had created a reddish powder: further investigations of this unexpected creation resulted in a black residue that, when dissolved in alcohol, created a bright purple solution.
There are numerous other examples of accidental inventions. Famously, the process for vulcanizing rubber was discovered in 1839 by Charles Goodyear, after years of fruitless searching for a way to make rubber more durable, when he accidentally spilled a mixture of rubber, sulfur, and white lead on a hot stove. Gore-Tex was invented when a frustrated Robert Gore yanked heated rods of PTFE (teflon), inadvertently creating a material with millions of tiny pores. Titanium medical implants were the result of Robert Branemark’s accidental discovery that titanium would bond with bone when implanting titanium-bodied cameras into rabbits. Duco quick-drying automotive paint, champagne, penicillin — the list goes on.
Because I’m interested in the nature of technological progress, I wanted to get a sense of how common accidental invention is. So I turned once again to Wikipedia’s Timeline of Historic Inventions, which I previously used to estimate the rate of multiple invention. For each invention from 1800 to 1970 (190 inventions total), I looked to see if it could be characterized as “accidental.”
By “accidental,” I mean roughly, “the primary or major mechanism by which an invention works is created or discovered unintentionally.” The invention does not need to emerge fully formed, only the basic thing that makes it work. So Alexander Fleming’s chance discovery of penicillin would count as an accidental invention, even though turning Fleming’s observations into a working drug would take years of deliberate effort.
A deliberate search for something to solve a specific problem would not count as accidental, even if there was an element of chance in its ultimate discovery. So Edison testing hundreds of different filament materials for his incandescent light bulb until a suitable one was found would not count as accidental. By contrast, a deliberate search that resulted in something other than what was being searched for would count as accidental. For instance, I count Harry Brearley’s discovery of stainless steel, which he stumbled upon when he was searching for erosion-resistant steels to use in gun barrels, as accidental.
I also didn’t count someone accidentally or serendipitously getting the idea for an invention (the concept of “accidental” breaks down a bit when you’re talking about the origins of ideas, since we often don’t know why a particular idea pops into our heads). So Robert Gair seeing an accidentally cut paper bag, giving him the idea for a pre-cut cardboard box, would not count as accidental.
A challenge with determining whether an invention is accidental is that it requires having some idea of the inventor’s mental state, which may not have been recorded, or which may have been exaggerated by historical retellings. For instance, the invention of the safety pin by Walter Hunt is sometimes described as accidental, but pinning down (ha!) what was going through Hunt’s mind when inventing is very difficult. All we really seem to know is that it was invented in the span of three hours to pay off a debt to his draftsman, JR Chapin: Hunt agreed to sell the rights to any ideas he came up with based on twisting an old piece of wire. This could have been accidental, the product of randomly twisting the wire and ending up with a pin, but it need not have been. (I did not include the safety pin as an accidental invention.)
Accidental inventionsAltogether, of the 190 “major” inventions Wikipedia lists between 1800 and 1970, I counted 15 (just under 8%) that could be described as accidental.
This is a short enough list that we can enumerate each one. In addition to the four we’ve already mentioned (vulcanized rubber, mauve, stainless steel, and penicillin), the inventions are listed below:
The stethoscope was invented in 1816 when French physician Rene Laennec wanted to listen to the heartbeat of an overweight female patient, but was reluctant to put his ear on her chest. Remembering that sound could be heard through a solid object, Laennec rolled up a sheet of paper, placing one end against her chest and the other in his ear. Laennec was “surprised and elated to be able to hear the beating of her heart with far greater clearness than I ever had with direct application of my ear,” and realized that “this might become an indispensable method for studying, not only the beating of the heart, but all movements able of producing sound in the chest cavity.”
Hot blast iron smelting was invented in 1828 by Scottish inventor James Neilson. Neilson was trying to improve an inefficient blast furnace, and thought that increasing the volume of air fed to the furnace might help. He attempted to do this by heating the air, and discovered that the increased heat of the air itself dramatically increased the fuel efficiency of the blast furnace.
Polyvinyl chloride (PVC) was first synthesized unintentionally by French chemist Henri Regnault in 1838 when a container containing vinyl chloride gas was exposed to sunlight, turning some of it into PVC. Regnault didn’t do anything with the material, and a patent for producing PVC wasn’t filed until 1913.
The critical breakthrough for Alexander Graham Bell’s telephone came accidentally in 1875 when Bell was working on the harmonic telegraph (which would send multiple messages over a single wire by using different audio frequencies). From “Telephone”:
As usual, the thing would not work right; when Watson pressed the keys that set his transmitting reeds to vibrating at their carefully tuned pitches, one of the corresponding receiving reeds stubbornly did not respond. At Bell’s instruction, Watson began plucking the recalcitrant transmitting reed with his fingers. Suddenly he heard a shout from the other room, and then Bell burst in on him, demanding excitedly, “What did you do then? Don’t change anything!” Faintly, but distinctly, Bell had heard the sound of the reed, plugged at a moment when a too-tightly-adjusted contact screw had accidentally made the supposedly intermittent transmitter current into a steady current — and one modulated into a sound carrier by the air waves caused by Watson’s plucking.
X-rays were famously discovered accidentally by German physicist William Roentgen in 1895 when he was experimenting with cathode ray tubes1:
…Suddenly, about a yard from the tube, he saw a weak light that shimmered on a little bench he knew was located nearby. It was as though a ray of light or a faint spark from the induction coil had been reflected by a mirror. Not believing this possible, he passed another series of discharges through the tube, and again the same fluores- cence appeared, this time looking like faint green clouds… Highly excited, Roentgen lit a match and to his great surprise discovered that the source of the mysterious light was the little barium platinocyanide screen lying on the bench. He repeated the experiment again and again, each time moving the little screen farther away from the tube and each time getting the same result. There seemed to be only one explanation for the phenomenon. Evidently something emanated from the Hittorf-Crookes tube that produced an effect upon the fluorescent screen at a much greater distance than he had ever observed in his cathode ray experiments…
Polyethylene was first created in 1898 by German chemist Hans von Pechmann, when he found a “white waxy substance when investigating the decomposition reaction of diazomethane.” Nothing was done with the substance, and actual use of polyethylene would have to wait for another accidental invention of it, by ICI chemists in 1933.
Safety glass was invented by French artist Eduard Benedictus, after he noticed that a glass bottle stayed together after it fell from a shelf and broke in 1903. The bottle had originally contained a substance known as colloidon, an alcohol/ether solution of cellulose nitrate. The liquid inside the bottle had evaporated, leaving behind a “celluloidic enamel” which held the shards of broken glass together. Six years later, Benedictus created “triplex” safety glass, which consisted of two sheets of glass attached to a plastic celluloid core.
Czochralski crystal pulling, which creates large single crystals of material by slowly pulling them out of a molten pool, was invented in 1916 after Polish chemist Jan Czochralski absent mindedly dipped his fountain pen into a crucible of molten tin instead of an inkwell. When he pulled it out, a long thread of tin followed, which when cooled was found to be a single crystal.
The mechanism behind the microwave oven was famously stumbled upon accidentally in 1945 by Perry Spencer at Raytheon when he noticed a candy bar in his pocket was melted by a microwave radar he was working on.
The mechanism behind the silicon solar PV cell, light striking a p-n junction in a piece of silicon and creating an electrical current, was first created accidentally at Bell Labs in 1940.
Bell Labs engineer Russell Ohl noticed a silicon rod with a crack in it produced strange electrical behavior, including a surprisingly strong flow of electricity when exposed to light. Taking samples of the silicon, Ohl and his staff found that there were slight chemical differences on each side of the crack. The silicon rods had been cut from silicon ingots that were made in a furnace, and the ingot Ohl’s rod had been cut from had been cooled very slowly when taken out of the furnace to try and prevent cracking. As the ingot cooled, chemical impurities in the silicon had migrated — lighter impurities migrated to the top, while heavier impurities remained at the bottom. These different impurities were causing the photovoltaic phenomenon at the crack which separated the two regions. By chance, Ohl had stumbled across a p-n junction, a fundamental building block of semiconductor technology and the heart of modern solar cells.
Kevlar was invented in 1965 at Du Pont when Stephanie Kwolek, tasked with synthesizing new types of flame resistant polyamide fibers, stumbled upon some fibers with novel properties:
Patterns of accidental inventionUnexpectedly, she discovered that under certain conditions, large numbers of polyamide molecules line up in parallel to form cloudy liquid crystalline solutions. Most researchers would have rejected the solution because it was fluid and cloudy rather than viscous and clear. But Kwolek took a chance and spun the solution into fibers more strong and stiff than had ever been created. This breakthrough opened up the possibilities for a host of new products resistant to tears, bullets, extreme temperatures, and other conditions.
The most notable pattern at work here is that the majority of these inventions — 9 out of 15 — are chemical inventions. Accidental inventions make up almost 20% of the 47 inventions between 1800 and 1970 I previously classified as chemical.2 This isn’t that surprising to me. Chemical phenomena are both highly opaque (meaning we’ll often be surprised by them), and require comparatively little deliberate effort to create. You might create a new, valuable chemical or chemical process just by mixing other chemicals together, or by exposing the right set of chemicals to the right set of conditions. Rubber vulcanization was invented when a mixture of chemicals spilled onto a hot stove, and Duco paint was invented when a batch of nitrocellulose and sodium acetate was left idle for a few days following a power failure. By contrast, it seems much harder to create a new, valuable machine by accident, in part because we can predict the behavior of physical objects much more readily than we can predict the behavior of chemicals: you can’t have an accident if you already know what’s going to happen. And while electrical phenomena are also opaque to human senses and not naturally intuitively predictable, it’s my sense that creating interesting combinations of them tends to require a lot of deliberate effort to create and shape moving electrical charges. But chemical reactions often happen on their own, without much in the way of human intervention.
The other notable pattern is that most accidental inventions (12 of the 15) were the product of deliberate research, or of attempts to invent something else. Mauve was invented when Perkin tried to synthesize quinine, the telephone breakthrough came when Bell and Watson were trying to build a harmonic telegraph, and X-rays were discovered when Roentgen was doing experiments with cathode ray tubes. Only three inventions — the stethoscope, safety glass, and the microwave — were the product of accidents outside the context of deliberate science or technology research and development. This probably also shouldn’t be surprising: it suggests the conditions for creating an accidental invention aren’t likely to be created in everyday life, but instead when trying to create or discover something new.
If we look at the frequency of accidental invention, it doesn’t seem to have changed much over time. On average a new one comes along every decade or so:
!function(){"use strict";window.addEventListener("message",(function(e){if(void 0!==e.data["datawrapper-height"]){var t=document.querySelectorAll("iframe");for(var a in e.data["datawrapper-height"])for(var r=0;r<t.length;r++){if(t[r].contentWindow===e.source)t[r].style.height=e.data["datawrapper-height"][a]+"px"}}}))}();ConclusionAccidental invention is in some ways the opposite of multiple invention. In the latter, an idea is obvious enough that multiple people have it; in the former, an idea is non-obvious enough that in a sense nobody has it at all. But apparently multiple invention is much more common — the rate of multiple invention for this set of inventions was close to 40%, compared to less than 8% accidental inventions.3
The major exception to this is with chemical inventions, where the rate of accidental invention ( around 19%) is much closer to the rate of multiple invention (33% for successes or near-successes). Evidently the nature of chemical phenomena — which are comparatively difficult to predict, but comparatively easy to create and manipulate — both makes accidental invention more likely, and multiple invention somewhat less likely.
1I think it’s debatable whether it makes sense to classify X-rays as an “invention” or not, but it’s on the Wikipedia list so I’ve included it here.
2Originally this was 46 chemical inventions, as safety glass was categorized as a mechanical one. But the nature of the discovery led me to re-categorize it as chemical.
3Though accidental and multiple invention are not mutually exclusive. The telephone, for instance, is on both lists: Bell’s breakthrough was accidental, but both he and Elisha Gray had the idea for the telephone.
September 20, 2025
Reading List 09/20/25
 French submarine cruiser Surcouf, via Wikipedia.
Welcome to the reading list, a weekly roundup of news and links related to buildings, infrastructure, and industrial technology. This week we look at shoddy US homebuilding, a foundation model for creating CAD files, ghost kitchens, lunar Helium-3, and more. Roughly 2/3rds of the reading list is paywalled, so for full access become a paid subscriber.
A few items of note this week:
IFP is hosting a launch party for “The Origins of Efficiency” in Washington DC on Friday, September 26th, at Signal House. If you want to chat with me, or buy a hardcover of the book before its official release date, come by! Details are here.
I was on Econtalk talking about building airplanes during WWII.
Hunterbrook on homebuildingHunterbrook is a media outlet owned by a hedge fund, with the idea that they will break newsworthy stories about businesses in order to (sometimes) trade on the resulting stock price moves. They recently wrote long, thorough report about the frequent low quality of homes produced by major US homebuilders:
Both D.R. Horton and Lennar promise that their mission to build affordable homes will not come at the cost of quality — even as they have told investors they would cut costs to offset diminishing margins amid a tightening housing market.
“You have to start value-engineering every component of the home, which means making compromises, not in quality, but in the way that you actually configure the homes,” Lennar CEO Stuart Miller said in an interview with Bloomberg Television last year.
D.R. Horton similarly promised its investors it would find ways to cut costs, like “replacing certain high quality fixtures and finishes with less expensive yet still high-quality fixtures and finishes.”
But many avoidable defects are caused by business practices that focus on building and selling quickly, with minimal concern for repeat business or quality control, according to Robert Knowles, president and founder of the National Association of Homeowners and a licensed professional engineer who said he has inspected thousands of new builds.
“There is no bonus for building the house to code, for quality,” Knowles said, to his knowledge. “There’s only bonuses for speed … and volume.” Knowles estimated 100% of all new builds probably have multiple code violations.
As someone who recently had to replace their HVAC system in a four-year old house, this unfortunately doesn’t come as a major surprise to me. Based on the frequency of lawsuits filed, it seems like this turn toward shoddiness might be a relatively recent phenomena:
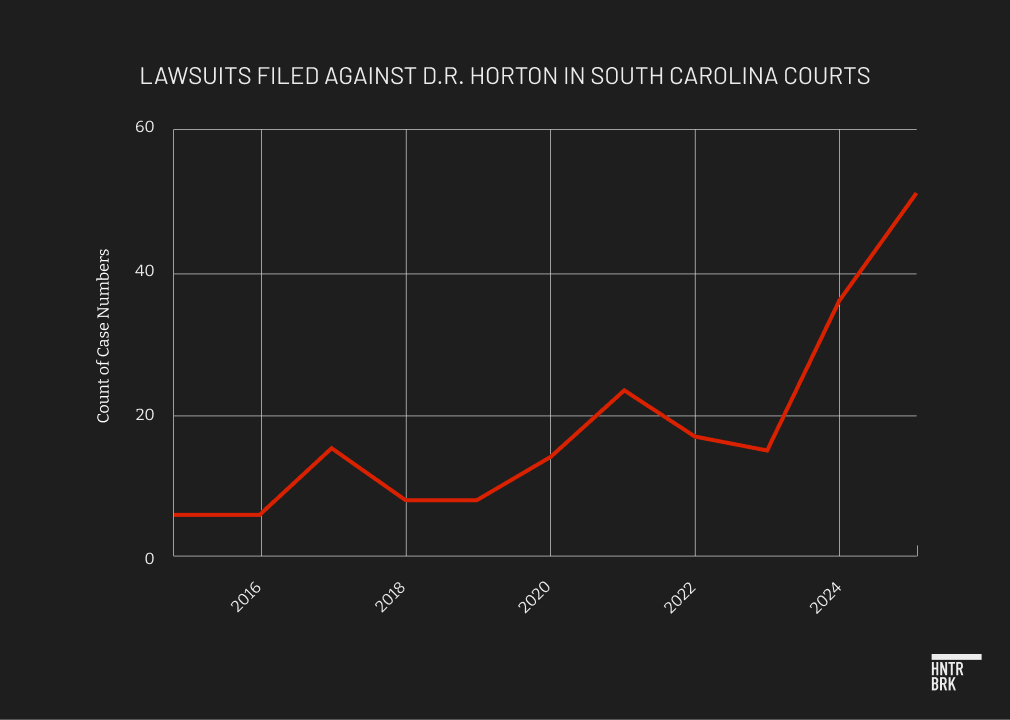
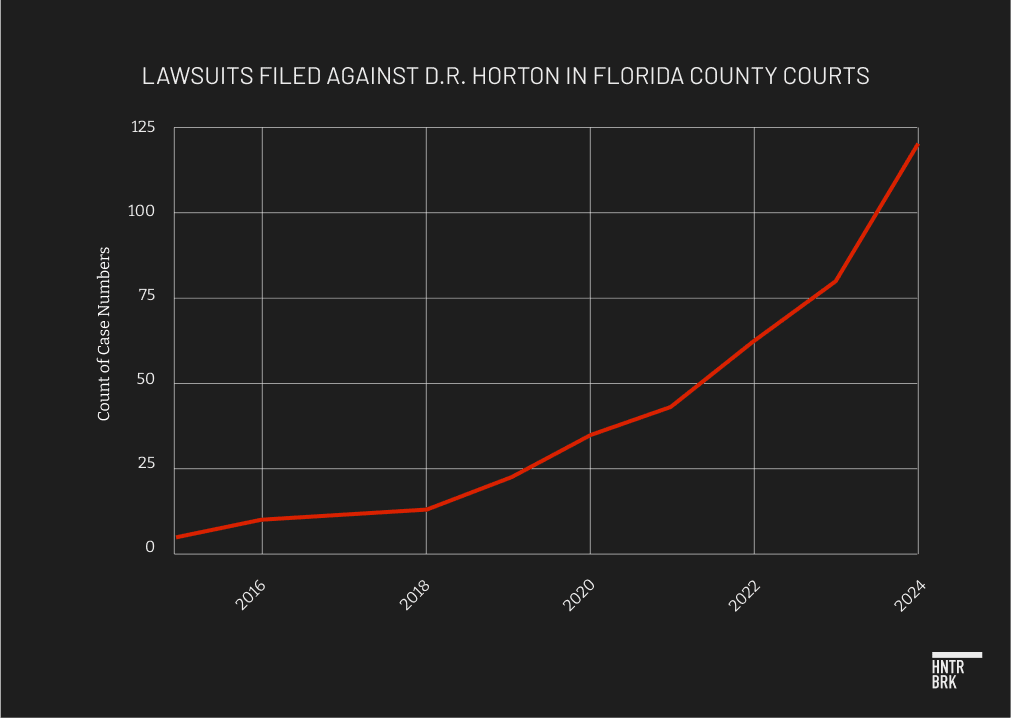 First gigawatt data center
In my essay from last year about how to build an AI data center, I noted that the power demanded by data centers kept increasing: 10 megawatt data centers of the 2010s giving way to 100 megawatt data centers in the 2020s, with even bigger ones on the way.
10 years ago, nearly all data centers used fewer than 10 megawatts, but a large data center today will use 100 megawatts or more. And companies are building large campuses with multiple individual data centers, pushing total power demand into the gigawatt range.
Now Elon Musk's xAI is building what will apparently be the world’s first 1 gigawatt data center. From SemiAnalysis:
CAD foundation model
The Colossus 2 project was kicked off on March 7th, 2025, when xAI acquired a 1m sqft warehouse in Memphis, and two adjacent sites totaling 100 acres. By August 22nd, 2025, we count 119 air-cooled chillers on site, i.e. roughly 200MW of cooling capacity. That’s enough to power roughly 110k GB200 NVL72. And an Elon tweet shows some racks were already installed in July.
xAI built in six months what took 15 months for Oracle, Crusoe and OpenAI!
…Memphis and Tennessee have been getting a lot of pushback, so xAI’s genius move was to develop a Gigawatt-scale energy hub right across the border in Southaven, Mississippi. In mid-2025, the company acquired a former Duke Energy power plant in Southaven. Shortly after, Mississippi regulators granted xAI temporary approval to run gas turbines there for up to 12 months without a permit!
…To deploy faster than peers, xAI relies on rental turbine companies. NYSE-listed Solaris Energy Infrastructure owns a fleet of 600MW of gas turbines, of which ~400MW currently serve xAI. Musk’s firm weighs 67% of SEI’s 1700MW orderbook, i.e. 1,140MW. There are ~240MW on the Memphis Colossus 1 site, while the remaining 900MW will be owned by a Joint Venture owned at 50.1% by Solaris and 49.9% by xAI.
I’ve previously noted that LLMs tend to be good at “digital” tasks like manipulating text and images, and less good at tasks that require interacting with the physical world, and that I’m interested in seeing how LLMs make progress on the latter sort of tasks. In that vein, here’s a new foundation model (a “base” AI model that can be then trained for some specific AI task) from Spectral Labs for generating CAD files. From the company’s website:
Icy moons
Today we are announcing SGS-1, a foundation model that can generate fully manufacturable and parametric 3D geometry. You can try a research preview of SGS-1 here.
Given an image or a 3D mesh, SGS-1 can generate CAD B-Rep parts in STEP format. Unlike all other existing generative models, SGS-1 outputs are accurate and can be edited easily in traditional CAD software.
Overview of SGS-1 - users can provide an image or “dumb” 3D file, and get back a parametric B-Rep file that can be easily edited to match specific dimensions
SGS-1 shows strong general results, producing much more complex and diverse CAD shapes than existing methods.

Outputs from the SOTA large reasoning model (GPT-5) demonstrate a clear lack of spatial understanding, producing outputs that are unusable or too simple to actually be useful. We use both SGS-1 and GPT-5 to generate the parametric geometry for the rail mount from the input image, in order to produce the desired target complete assembly.

SGS-1 accurately represents the geometry and can be plugged into an assembly context, while the output from the large reasoning model is missing core spatial features.


Like anyone who has read 2010: Odyssey Two, I knew that some moons of Jupiter and Saturn have significant amounts of water and ice on them. What I didn’t realize was that apparently they have much, much more water than earth does. (Earth doesn’t have that much more water than Pluto does!) Via Business Insider:
Earth seems drenched with water from mountaintop to ocean bottom.
But our home planet is a desert compared to some places the solar system, both in terms of its total water volume and the amount of liquid on Earth relative to its size.
Consider Jupiter's ice-encrusted moon Europa, which is smaller than Earth's moon. Scientists recently used 20-year-old Voyager data to find even more evidence that Europa has twice as much water as our planet. Even tiny Pluto may have an ocean nearly as large as Earth's.
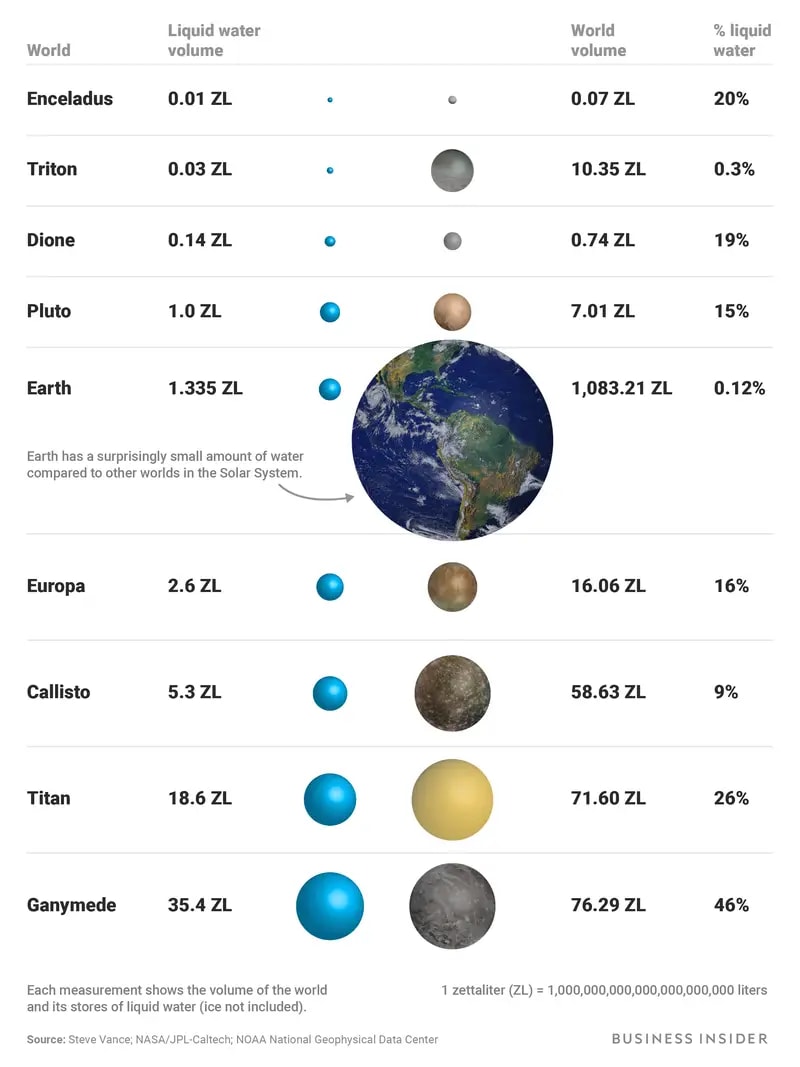
If earth had managed to collect around 3 times as much water as it did, it apparently wouldn’t have dry land at all. But apparently earth having as much water as it does is something of a surprise. Via The Conversation:
This isn’t actually a surprise. Earth formed in the warm part of the protoplanetary disk, at a location well within the “snow line”. In fact, the origin of Earth’s water has been a puzzle to astronomers for many years.
It seems most likely that Earth’s water was delivered from the colder reaches of the Solar system through impacts, most likely from the outer reaches of the asteroid belt. That delivery through bombardment would also have targeted Mars and Venus.
There is growing evidence that both Mars and Venus once had oceans much like Earth’s - until the vagaries of time took their toll.
In the 4.5 billion years since the Solar system’s formation, the Sun has grown markedly more luminous. As a result, Venus grew ever warmer until its oceans boiled, hundreds of millions of years ago.
Brian Potter's Blog

- Brian Potter's profile
- 10 followers


.jpg)