
Addy Osmani's Blog, page 2
August 1, 2018
The Cost Of JavaScript In 2018

Building interactive sites can involve sending JavaScript to your users. Often, too much of it. Have you been on a mobile page that looked like it had loaded only to tap on a link or tried to scroll and nothing happens?
Byte-for-byte, JavaScript is still the most expensive resource we send to mobile phones, because it can delay interactivity in large ways.
 JavaScript processing times for CNN.com as measured by WebPageTest (src). A high-end phone (iPhone 8) processes script in ~4s. Compare to th...


December 23, 2017
A Tinder Progressive Web App Performance Case Study

Tinder recently swiped right on the web. Their new responsive Progressive Web App — Tinder Online — is available to 100% of users on desktop and mobile, employing techniques for JavaScript performance optimization, Service Workers for network resilience and Push Notifications for chat engagement. Today we’ll walk through some of their web perf learnings.
 Journey to a Progressive Web App
Tinder Online started with the goal of getting adoption in new markets, striving to hit feature parity with V1 of Tinder’s experience on other platforms.
The MVP for the PWA took 3 months to implement using React as their UI library and Redux for state management. The result of their efforts is a PWA that delivers the core Tinder experience in 10% of the data-investment costs for someone in a data-costly or data-scarce market:
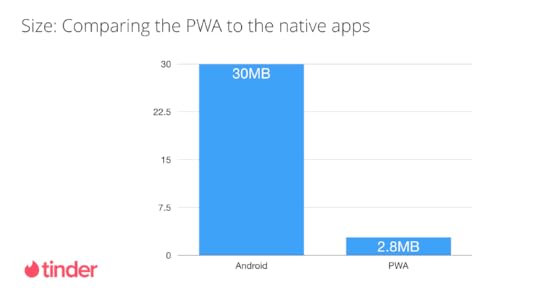 Comparing the data-investment for Tinder Online vs the native apps. It’s important to note that this isn’t comparing apples to apples, however. The PWA loads code for new routes on demand, and the cost of additional code is amortized over the lifetime of the application. Subsequent navigations still don’t cost as much data as the download of the app.
Early signs show good swiping, messaging and session length compared to the native app. With the PWA:
Users swipe more on web than their native appsUsers message more on web than their native appsUsers purchase on par with native appsUsers edit profiles more on web than on their native appsSession times are longer on web than their native appsPerformanceThe mobile devices Tinder Online’s users most commonly access their web experience with include:
Apple iPhone & iPadSamsung Galaxy S8Samsung Galaxy S7Motorola Moto G4Using the Chrome User Experience report (CrUX), we’re able to learn that the majority of users accessing the site are on a 4G connection:
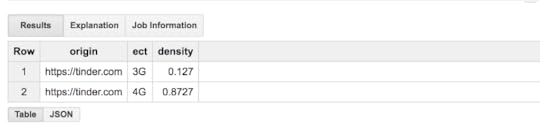
Note: Rick Viscomi recently covered CrUX on PerfPlanet and Inian Parameshwaran covered rUXt for better visualizing this data for the top 1M sites.
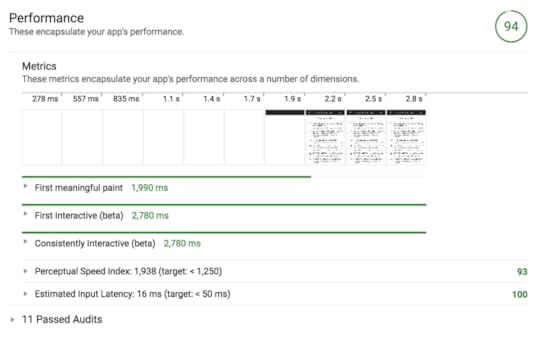
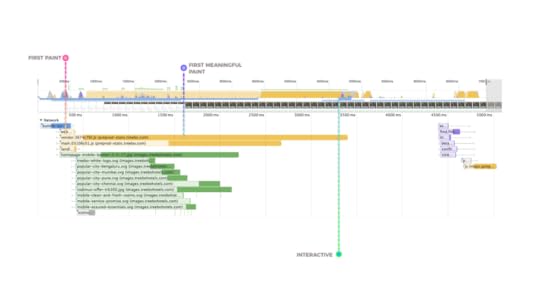
Testing the new experience on WebPageTest and Lighthouse (using the Galaxy S7 on 4G) we can see that they’re able to load and get interactive in under 5 seconds:
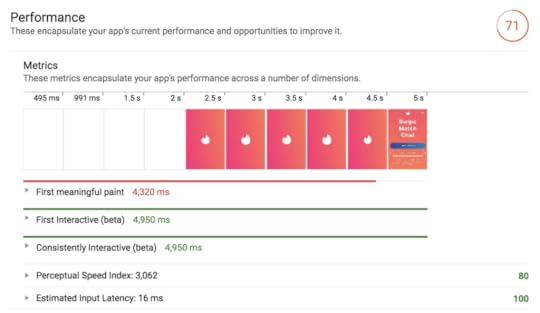
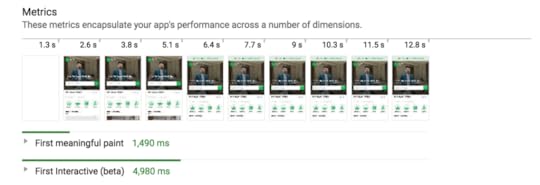
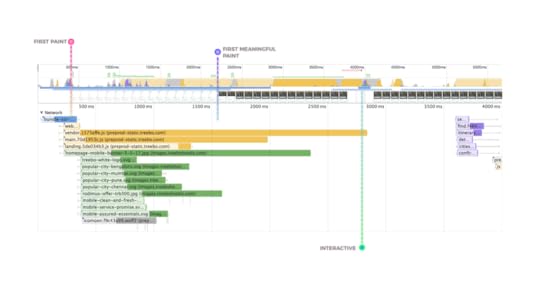
There is of course lots of room to improve this further on median mobile hardware (like the Moto G4), which is more CPU constrained:

Tinder are hard at work on optimizing their experience and we look forward to hearing about their work on web performance in the near future.
Performance OptimizationTinder were able to improve how quickly their pages could load and become interactive through a number of techniques. They implemented route-based code-splitting, introduced performance budgets and long-term asset caching.
Route-level code-splittingTinder initially had large, monolithic JavaScript bundles that delayed how quickly their experience could get interactive. These bundles contained code that wasn’t immediately needed to boot-up the core user experience, so it could be broken up using code-splitting. It’s generally useful to only ship code users need upfront and lazy-load the rest as needed.
To accomplish this, Tinder used React Router and React Loadable. As their application centralized all their route and rendering info a configuration base, they found it straight-forward to implement code splitting at the top level.
In summary:
React Loadable is a small library by James Kyle to make component-centric code splitting easier in React. Loadable is a higher-order component (a function that creates a component) which makes it easy to split up bundles at a component level.
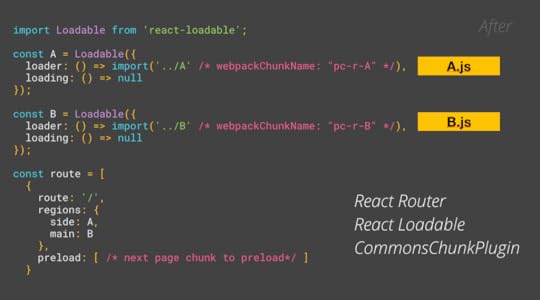
Let’s say we have two components “A” and “B”. Before code-splitting, Tinder statically imported everything (A, B, etc) into their main bundle. This was inefficient as we didn’t need both A and B right away:
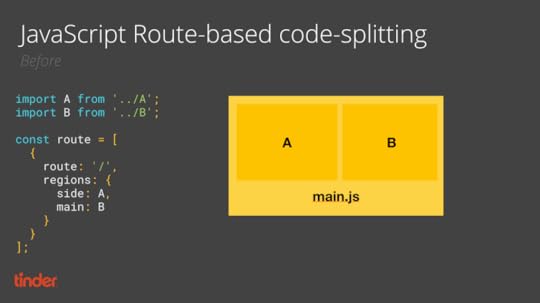
After adding code-splitting, components A and B could be loaded as and when needed. Tinder did this by introducing React Loadable, dynamic import() and webpack’s magic comment syntax (for naming dynamic chunks) to their JS:
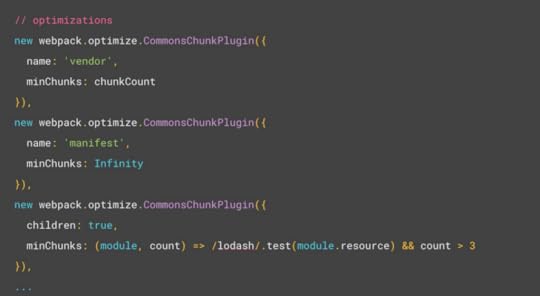
For “vendor” (library) chunking, Tinder used the webpack CommonsChunkPlugin to move commonly used libraries across routes up to a single bundle file that could be cached for longer periods of time:
Next, Tinder used React Loadable’s preload support to preload potential resources for the next page on control component:

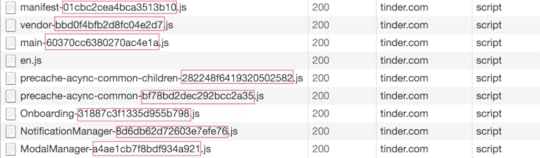
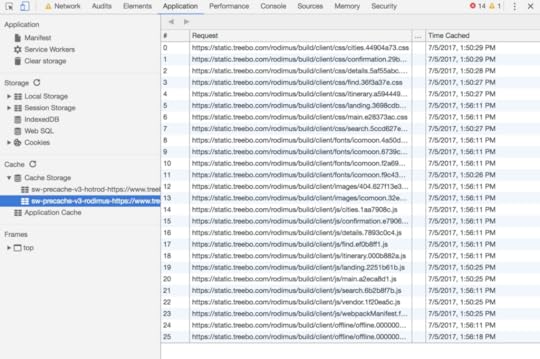
Tinder also used Service Workers to precache all their route level bundles and include routes that users are most likely to visit in the main bundle without code-splitting. They’re of course also using common optimizations like JavaScript minification via UglifyJS:
new webpack.optimize.UglifyJsPlugin({parallel: true,
compress: {
warnings: false,
screw_ie8: true
},
sourceMap: SHOULD_SOURCEMAP
}),Impact
After introducing route-based code-splitting their main bundle sizes went down from 166KB to 101KB and DCL improved from 5.46s to 4.69s:
 Long-term asset caching
Ensuring long-term caching of static resources output by webpack benefits from using [chunkhash] to add a cache-buster to each file.
Tinder were using a number of open-source (vendor) libraries as part of their dependency tree. Changes to these libraries would originally cause the [chunkhash] to change and invalidate their cache. To address this, Tinder began defining a whitelist of external dependencies and splitting out their webpack manifest from the main chunk to improve caching. The bundle size is now about 160KB for both chunks.
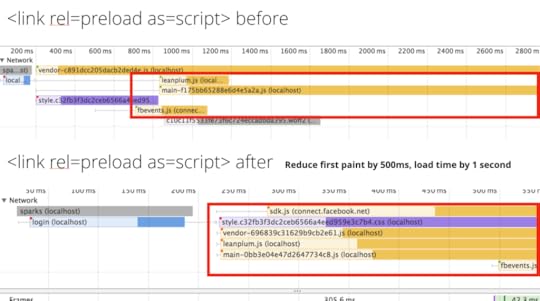
Preloading late-discovered resourcesAs a refresher, is a declarative instruction to the browser to load critical, late-discovered resources earlier on. In single-page applications, these resources can sometimes be JavaScript bundles.

Tinder implemented support for to preload their critical JavaScript/webpack bundles that were important for the core experience. This reduced load time by 1s and first paint from 1000ms to about 500ms.
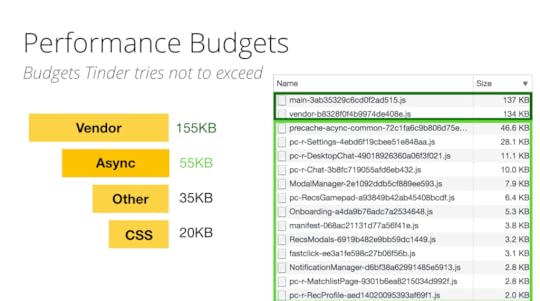
 Performance budgets
Tinder adopted performance budgets for helping them hit their performance goals on mobile. As Alex Russell noted in “Can you afford it?: real-world performance budgets”, you have a limited headroom to deliver an experience when considering slow 3G connections being used on median mobile hardware.
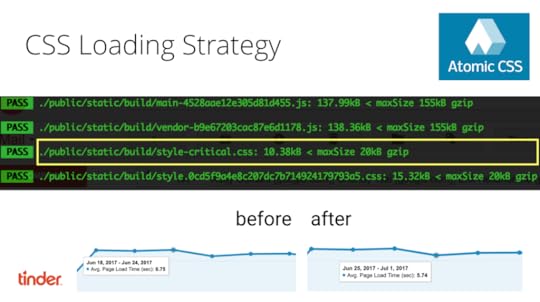
To get and stay interactive quickly, Tinder enforced a budget of ~155KB for their main and vendor chunks, asynchronous (lazily loaded) chunks are ~55KB and other chunks are ~35KB. CSS has a limit of 20KB. This was crucial to ensuring they were able to avoid regressing on performance.
 Webpack Bundle Analysis
Webpack Bundle Analyzer allows you to discover what the dependency graph for your JavaScript bundles looks like so you can discover whether there’s low-hanging fruit to optimize.
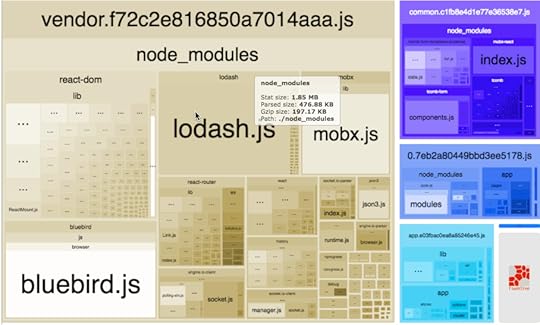
Tinder used Webpack Bundle Analyzer to discover areas for improvement:
Polyfills: Tinder are targeting modern browsers with their experience but also support IE11 and Android 4.4 and above. To keep polyfills & transpiled code to a minimum, they use For polyfills, they use babel-preset-env and core-js .Slimmer use of libraries: Tinder replaced localForage with direct use of IndexedDB.Better splitting: Split out components from the main bundles which were not required for first paint/interactiveCode re-use: Created asynchronous common chunks to abstract chunks used more than three times from children.CSS: Tinder also removed critical CSS from their core bundles (as they had shifted to server-side rendering and delivered this CSS anyway)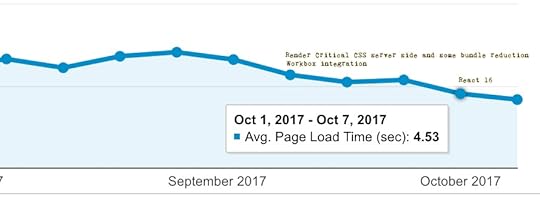
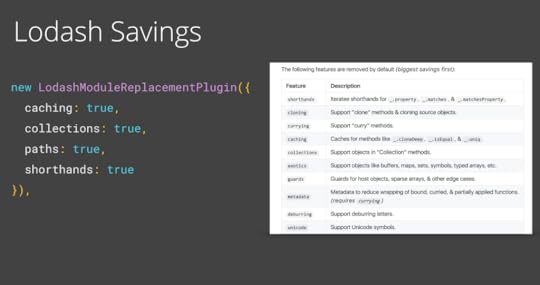
Using bundle analysis led to also also taking advantage of Webpack’s Lodash Module Replacement Plugin. The plugin creates smaller Lodash builds by replacing feature sets of modules with noop, identity or simpler alternatives:
Webpack Bundle Analyzer can be integrated into your Webpack config. Tinder’s setup for it looks like this:
plugins: [new BundleAnalyzerPlugin({
analyzerMode: 'server',
analyzerPort: 8888,
reportFilename: 'report.html',
openAnalyzer: true,
generateStatsFile: false,
statsFilename: 'stats.json',
statsOptions: null
})
The majority of the JavaScript left is the main chunk which is trickier to split out without architecture changes to Redux Reducer and Saga Register.
CSS StrategyTinder are using Atomic CSS to create highly reusable CSS styles. All of these atomic CSS styles are inlined in the initial paint and some of the rest of the CSS is loaded in the stylesheet (including animation or base/reset styles). Critical styles have a maximum size of 20KB gzipped, with recent builds coming in at a lean
Tinder use CSS stats and Google Analytics for each release to keep track of what has changed. Before Atomic CSS was being used, average page load times were ~6.75s. After they were ~5.75s.
Tinder Online also uses the PostCSS Autoprefixer plugin to parse CSS and add vendor prefixes based on rules from Can I Use:
new webpack.LoaderOptionsPlugin({options: {
context: paths.basePath,
output: { path: './' },
minimize: true,
postcss: [
autoprefixer({
browsers: [
'last 2 versions',
'not ie < 11',
'Safari >= 8'
]
})
]
}
}),Runtime performanceDeferring non-critical work with requestIdleCallback()
To improve runtime performance, Tinder opted to use requestIdleCallback() to defer non-critical actions into idle time.
requestIdleCallback(myNonEssentialWork);This included work like instrumentation beacons. They also simplified some HTML composite layers to reduce paint count while swiping.
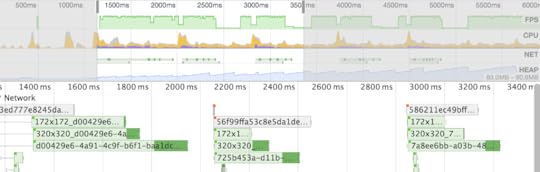
Using requestIdleCallback() for their instrumentation beacons while swiping:
before..
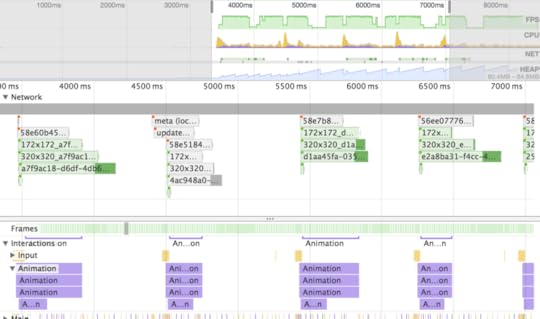
and after..
 Dependency upgrades
Webpack 3 + Scope Hoisting
In older versions of webpack, when bundling each module in your bundle would be wrapped in individual function closures. These wrapper functions made it slower for your JavaScript to execute in the browser. Webpack 3 introduced “scope hoisting” — the ability to concatenate the scope of all your modules into one closure and allow for your code to have a faster execution time in the browser. It accomplishes this with the Module Concatenation plugin:
new webpack.optimize.ModuleConcatenationPlugin()Webpack 3’s scope hoisting improved Tinder’s initial JavaScript parsing time for vendor chunk by 8%.
React 16
React 16 introduced improvements that decreased React’s bundle size compared to previous versions. This was in part due to better packaging (using Rollup) as well as removing now unused code.
By updating from React 15 to React 16, Tinder reduced the total gzipped size of their vendor chunk by ~7%.
The size of react + react-dom used to be~50KB gzipped and is now just ~35KB. Thanks to Dan Abramov, Dominic Gannaway and Nate Hunzaker who were instrumental in trimming down React 16’s bundle size.
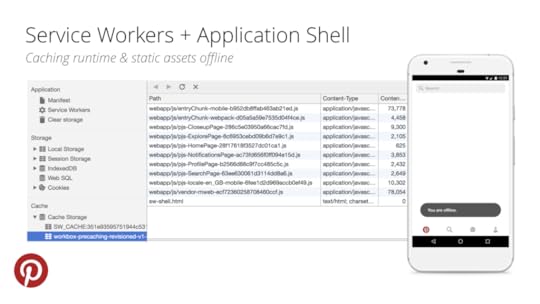
Workbox for network resilience and offline asset cachingTinder also use the Workbox Webpack plugin for caching both their Application Shell and their core static assets like their main, vendor, manifest bundles and CSS. This enables network resilience for repeat visits and ensures that the application starts-up more quickly when a user returns for subsequent visits.
 Opportunities
Digging into the Tinder bundles using source-map-explorer (another bundle analysis tool), there are additional opportunities for reducing payload size. Before logging in, components like Facebook Photos, notifications, messaging and captchas are fetched. Moving these away from the critical path could save up to 20% off the main bundle:

Another dependency in the critical path is a 200KB Facebook SDK script. Dropping this script (which could be lazily loaded when needed) could shave 1 second off initial loading time.
ConclusionsTinder are still iterating on their Progressive Web App but have already started to see positive results from the fruits of their labor. Check out Tinder.com and stay tuned for more progress in the near future!
With thanks and congrats to Roderick Hsiao, Jordan Banafsheha, and Erik Hellenbrand for launching Tinder Online and their input to this article. Thanks to Cheney Tsai for his review.
Related reading:
A Pinterest PWA performance case studyA Treebo React & Preact performance case studyTwitter Lite and high-performance PWAs at scaleThis article was cross-posted from Performance Planet. If you’re new to React, I’ve found React for Beginners a comprehensive starting point.

November 29, 2017
A Pinterest Progressive Web App Performance Case Study

Pinterest’s new mobile web experience is a Progressive Web App. In this post we’ll cover some of their work to load fast on mobile hardware by keeping JavaScript bundles lean and adopting Service Workers for network resilience.
 Login to https://pinterest.com on your phone to experience their new mobile siteWhy a Progressive Web App (PWA)? Some history.
The Pinterest PWA started because they were focused on international growth, which led them to the mobile web.
After analyzing usage for unauthenticated mobile web users, they realized that their old, slow web experience only managed to convert 1% of users into sign-ups, logins or native app installs. The opportunity to improve this conversation rate was huge, leading them to an investment in the PWA.
Building and shipping a PWA in a quarter
Over 3 months, Pinterest rebuilt their mobile web experience using React, Redux and webpack. Their mobile web rewrite led to several positive improvements in core business metrics.
Time spent is up by 40% compared to the old mobile web experience, user-generated ad revenue is up 44% and core engagements are up 60%:

Their mobile web rewrite also led to several improvements in performance.
Loading fast on average mobile hardware over 3GPinterest’s old mobile web experience was a monolith — it included large bundles of CPU-heavy JavaScript that pushed out how quickly Pin pages could load and get interactive.
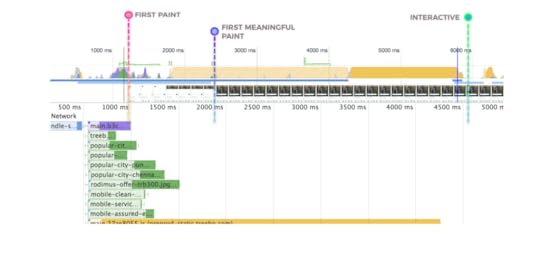
Users often had to wait 23 seconds before any UI was usable at all:
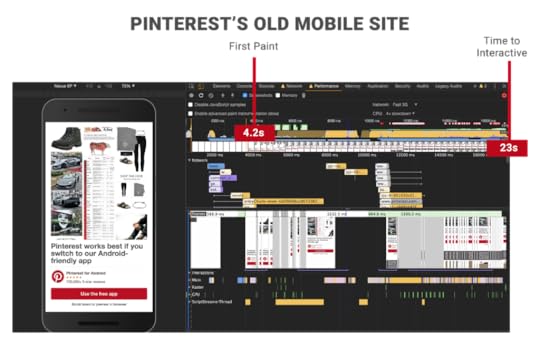 Pinterest’s old mobile web site took 23 seconds to get interactive. They would send down over 2.5MB of JavaScript (~1.5MB for the main bundle, 1MB lazily loaded in) taking multiple seconds to get parsed and compiled before the main thread finally settled down enough to be interactive.
Their new mobile web experience is a drastic improvement.
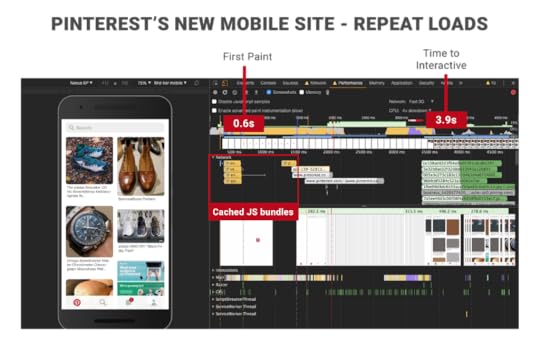
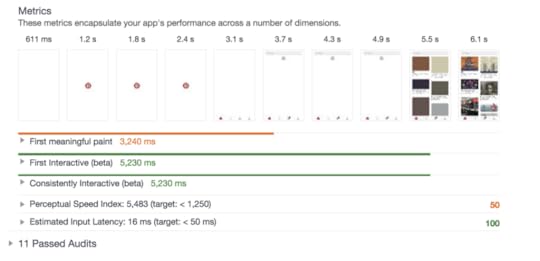
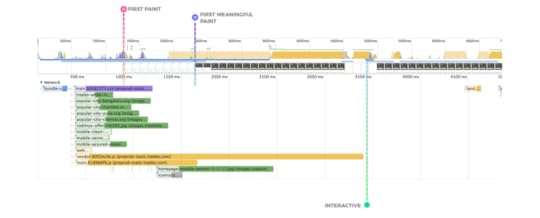
Not only did they break-up & shave hundreds of KB off their JavaScript, taking down the size of their core bundle from 650KB to 150KB but they also improved on key performance metrics. First Meaningful Paint was down from 4.2s to 1.8s and Time To Interactive reduced from 23s to 5.6s.

This is on average Android hardware over a slow 3G network connection. On repeat visits, the situation was even better.
Thanks to Service Worker caching of their main JavaScript, CSS and static UI assets they were able to bring down time to interactive on repeat visits all the way down to 3.9s:
Although Pinterest vend iOS & Android apps, they were able to deliver the same core home feed experience these apps do on the web in a fraction of the upfront download cost — just ~150KB minified & gzipped. This contrasts with the 9.6MB required to deliver this experience for Android and 56MB for iOS:

It’s important to note that this isn’t comparing apples to apples, however. The PWA loads code for new routes on demand, and the cost of additional code is amortized over the lifetime of the application. Subsequent navigations still don’t cost as much data as the download of the app.
 Pinterest’s Progressive Web App in Firefox, Edge and Safari on mobile.Route-based JavaScript chunking
Getting a web page to load and get interactive quickly benefits from only loading the code a user needs upfront. This reduces network transmission & JavaScript parse/compile times. Non-critical resources can then be lazily loaded as needed.
Pinterest started breaking up their multi-megabyte JavaScript bundles by splitting them into three different categories of webpack chunks that worked quite well:
 a vendor chunk which contained external dependencies (react, redux, react-router, etc) ~ 73KBan entry chunk which contained a majority of the code required to render the app (i.e. common libs, the main shell of the page, our redux store) ~ 72KBasync route chunks which contained code pertaining to individual routes ~13–18KB
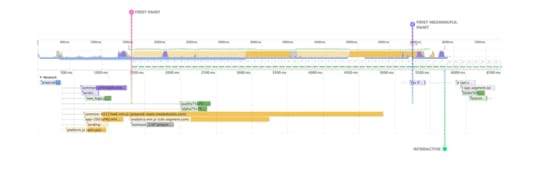
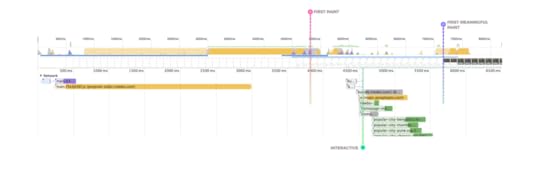
A Network waterfall for the experience highlights how a shift to progressively delivering code as needed avoids the need for monolithic bundles:
 For long-term caching, Pinterest also use a chunk-specific hash substitution for each filename.
Pinterest uses webpack’s CommonsChunkPlugin to break out their vendor bundles into their own cacheable chunk:
https://medium.com/media/8473c7a36cb1b9acf28ca995256a293a/hrefThey also used React Router for adding code-splitting to the experience:
https://medium.com/media/4e5b259c116f178c7ca52fdc9df769e1/hrefUse babel-preset-env to only transpile what target browsers needPinterest use Babel’s babel-preset-env to only transpile ES2015+ features unsupported by the modern browsers they target. Pinterest targets the last two versions of modern browsers, and their .babelrc setup looks a little like:
https://medium.com/media/6ed056a7794043dc2f75b14c8237172a/hrefThere are further optimizations they can do to only conditionally serve polyfills as needed (e.g the Internationalization API for Safari) but this is planned for the future.
Analyzing room for improvement with Webpack Bundle Analyzer
Webpack Bundle Analyzer is an excellent tool for really understanding what dependencies you’re sending down to your users in JavaScript bundles.
Below, you’ll see a lot of purple, pink and blue blocks in its output for an earlier build of Pinterest. These are async chunks for routes being lazily loaded in. Webpack Bundle Analyzer allowed Pinterest to visualize that most of these chunks contained duplicate code:

Webpack Bundle Analyzer helped visualize the size ratio of this problem between all their chunks.
Using the information about duplicate code in chunks, Pinterest were able to make a call. They moved duplicate code in async chunks to their main chunk. It increased the size of the entry chunk by 20% but decreased the size of all lazily loaded chunks by up to 90%!
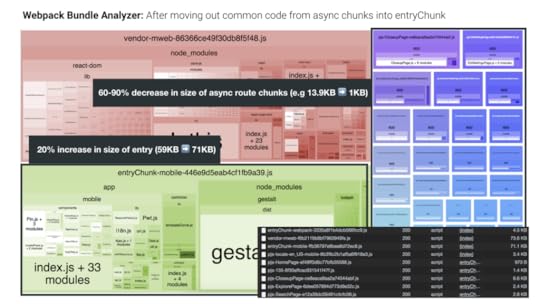 Image Optimization
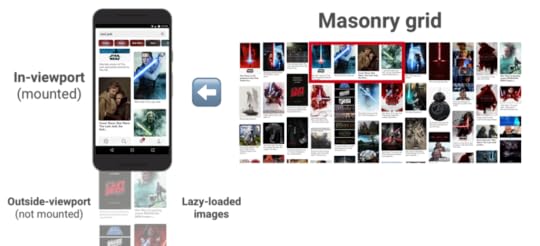
Most of the lazy-loading of content in the Pinterest PWA is handled by an infinite Masonry grid. It has built-in support for virtualization and only mounting children that are in the viewport.
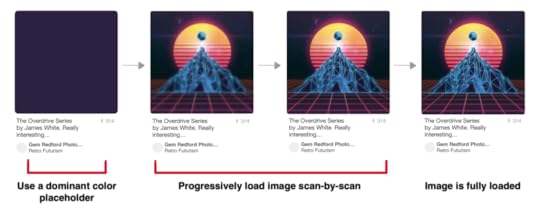
Pinterest also uses a progressive loading technique for images in their PWA. A placeholder with the dominant color is initially used for each Pin. Pin images are served as Progressive JPEGs, which improve image quality with each scan:
 React performance pain-points
Pinterest ran into some rendering performance issues with React as part of their use of this Masonry grid. Mounting and unmounting large trees of components (like Pins) can be slow. There’s a lot that goes into a Pin:
Although at the time of writing Pinterest are using React 15.5.4, their hope is that React 16 (Fiber) will help a lot with reducing time spent unmounting. In the mean time, Virtualizing the grid helped significantly with component unmount time.
Pinterest also throttle insertion of Pins so that they can measure/render the first Pins quicker, but means there’s more overall work for the device’s CPU.
Navigation TransitionsTo improve perceived performance, Pinterest also update the selected state of navigation bar icons independent of the route. This enables navigations from one route to another to not feel slow due to blocking on the network. The user gets visual UI painted quickly while we’re waiting for the data to arrive:
 Experience using Redux
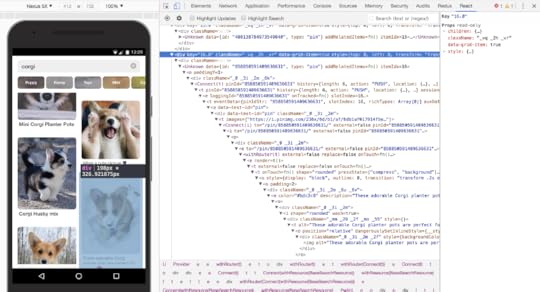
Pinterest use normalizr (which normalizes nested JSON according to a schema) for all of their API data. This is viewable from the Redux DevTools:
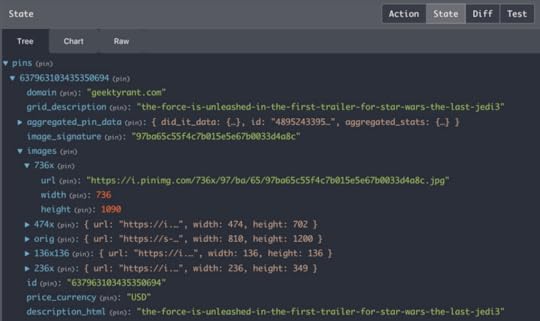
The downside to this process is that denormalization is slow so they ended up heavily relying on reselect’s selector pattern for memoizing denormalization during renders. They also always denormalize at the lowest level possible to ensure individual updates don’t cause large re-renders.
As an example, their grid item lists are just Pin IDs with the Pin component denormalizing itself. If there are changes to any given Pin, the full grid does not have to re-render. The trade-off is that there are a lot of Redux subscribers in the Pinterest PWA, though this hasn’t resulted in noticeable perf issues.
Caching assets with Service WorkersPinterest use the Workbox libraries for generating and managing their Service Workers:
https://medium.com/media/c49f45cc747c1988f0fc7130978b54ca/hrefToday, Pinterest cache any JavaScript or CSS bundles using a cache-first strategy and also cache their user-interface (the application shell).
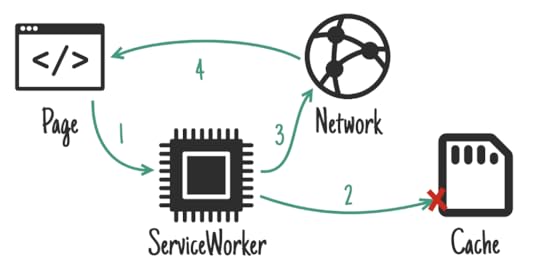 In a cache-first setup, if a request matches a cache entry, respond with that. Otherwise try to fetch the resource from the network. If the network request succeeds, update the cache. To learn more about caching strategies with Service Worker, read Jake Archibald’s Offline Cookbook.
They define a precache for the initial bundles loaded by the application shell (webpack’s runtime, vendor and entryChunks) too.
As Pinterest is a site with a global presence, supporting multiple languages, they also generate a per-locale Service Worker configuration so they can precache locale bundles. Pinterest also use webpack’s named chunks to precache top-level async route bundles.
This work was rolled out in several smaller, iterative steps.
1st: Pinterest’s Service Worker only did runtime caching of scripts lazy-loaded on demand. This was to take advantage of V8’s code caching, helping skip some of the parse/compile cost on repeat views so they can load quicker. Scripts served from Cache Storage where a Service Worker is present can eagerly opt into code caching as there’s a good chance the browser knows the user will end up using these resources on repeat views.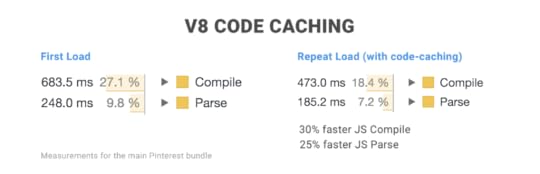 After this, Pinterest progressed to pre-caching their vendor and entry chunks.Next, Pinterest started precaching a few of the most used routes (like the home page, pin page, search page etc).Finally, they started generating a Service Worker for each locale so that they could also cache the locale bundle. This was important for not just repeat load performance, but also enabling basic offline rendering for most of their audience:https://medium.com/media/4a2ca05afb8b95596e679746666a96bc/hrefApplication Shell challenges
Pinterest found implementing their application shell a little tricky. Because of desktop-era assumptions about how much data could be sent down over a cable connection, initial payloads were large containing a lot of non-critical info, like user’s experiment groups, user info, contextual information etc.
They had to ask themselves: “do we cache this stuff in the application shell? or take the perf hit of making a blocking network request before rendering anything to fetch it at all”.
They decided to cache it in the application shell, which required some management of when to invalidate the app shell (logout, user information updates from settings etc). Each request response has an `appVersion` — if the app version changes, they unregister the Service Worker, register the new one then on the next route change they do a full page reload.
Adding this information to the application shell is a little trickier, but worth avoiding the render blocking request for.
Auditing with LighthousePinterest used Lighthouse for one-off validations that their performance improvements were on the right track. It was useful for keeping an eye on metrics such as Time to Consistently Interactive.
Next year they hope to use Lighthouse as a regression mechanism to verify that page loads remain fast.
The FuturePinterest just deployed support for Web Push notifications and have also been working on the unauthenticated (logged-out) experience for their PWA.

They are interested in exploring support for to preload critical bundles & reducing the amount of unused JavaScript delivered to users on first load. Stay tuned for more awesome perf work in the future!
With congrats to Zack Argyle, YenWei Liu, Luna Ruan, Victoria Kwong, Imad Elyafi, Langtian Lang, Becky Stoneman and Ben Finkel from Pinterest on launching their Progressive Web App and providing input to this write-up. Thanks to Jeffrey Posnick and Zouhir for their reviews of this post.

A Pinterest Progressive Web App Performance Case Study was originally published in Dev Channel on Medium, where people are continuing the conversation by highlighting and responding to this story.
November 15, 2017
The Cost Of JavaScript

As we build sites more heavily reliant on JavaScript, we sometimes pay for what we send down in ways that we can’t always easily see. In this post, I’ll cover why a little discipline can help if you’d like your site to load & be interactive quickly on mobile devices.
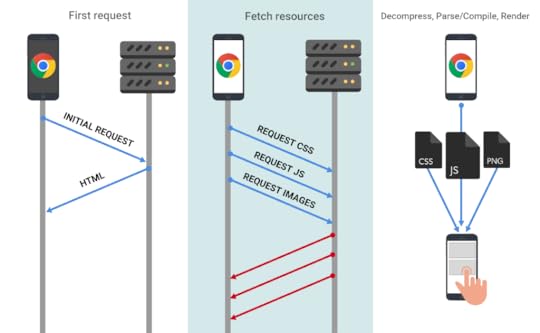
tl;dr: less code = less parse/compile + less transfer + less to decompress
NetworkWhen most developers think about the cost of JavaScript, they think about it in terms of the download & execution cost. Sending more bytes of JavaScript over the wire takes longer the slower a user’s connection is.
This can be a problem, even in first-world countries, as the effective network connection type a user has might not actually be 3G, 4G or WiFi. You can be on coffee-shop Wifi but connected to a cellular hotspot with 2G speeds.
You can reduce the network transfer cost of JavaScript by:
Only shipping the code a user needs. Code-splitting can help here. Minifying it (Uglify for ES5, babel-minify or uglify-es for ES2015) Compressing it heavily (using Brotli ~q11, Zopfli or gzip). Brotli outperforms gzip on compression ratio. It helped CertSimple save 17% on the size of compressed JS bytes and LinkedIn save 4% on their load times.Removing unused code. Identify with DevTools code coverage. For stripping code, see tree-shaking, Closure Compiler’s advanced optimizations and library trimming plugins like lodash-babel-plugin or Webpack’s ContextReplacementPlugin for libraries like Moment.js. Use babel-preset-env & browserlist to avoid transpiling features already in modern browsers. Advanced developers may find careful analysis of their Webpack bundles helps identify opportunities to trim unneeded dependencies. Caching it to minimize network trips. Determine optimal lifetimes for scripts (max-age) & supply validation tokens (ETag) to avoid transferring unchanged bytes. Service Worker caching can make your app network resilient & give you eager access to features like V8’s code cache. Learn about long-term caching with filename hashing. Best practices for reducing how much JavaScript you’re shipping down to users.Parse/Compile
Once downloaded, one of JavaScript’s heaviest costs is the time for a JS engine to parse/compile this code. In Chrome DevTools, parse and compile are part of the yellow “Scripting” time in the Performance panel.
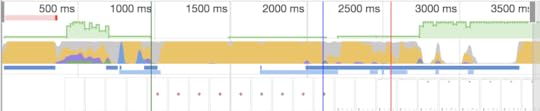
The Bottom-Up/Call Tree allow viewing exact Parse/compile timings:
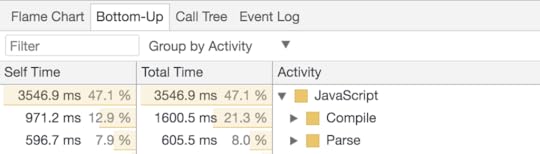 Chrome DevTools Performance panel > Bottom-Up. With V8’s Runtime Call Stats enabled, we can see time spent in phases like Parse and Compile
But, why does this matter?

Spending a long time parsing/compiling code can heavily delay how soon a user can interact with your site. The more JavaScript you send, the longer it will take to parse & compile it before your site is interactive.

Byte-for-byte, JavaScript is more expensive for the browser to process than the equivalently sized image or Web Font — Tom Dale
Compared to JavaScript, there are numerous costs involved in processing equivalently sized images (they still have to be decoded!) but on average mobile hardware, JS is more likely to negatively impact a page’s interactivity.
 JavaScript and image bytes have very different costs. Images usually don’t block the main thread or prevent interfaces from getting interactive while being decoded and rasterized. JS however can delay interactivity due to parse, compile and execution costs.
When we talk about parse and compile being slow; context is important — we’re talking about average mobile phones here. Average users can have phones with slow CPUs and GPUs, no L2/L3 cache and which may even be memory constrained.
Network capabilities and device capabilities don’t always match up. A user with an amazing Fiber connection doesn’t necessarily have the best CPU to parse and evaluate JavaScript sent to their device. This is also true in reverse..a terrible network connection, but a blazing fast CPU. — Kristofer Baxter, LinkedIn
In JavaScript Start-up Performance, I noted the cost of parsing ~1MB of decompressed (simple) JavaScript on low and high-end hardware. There is a 2–5x difference in time to parse/compile code between the fastest phones on the market and average phones.
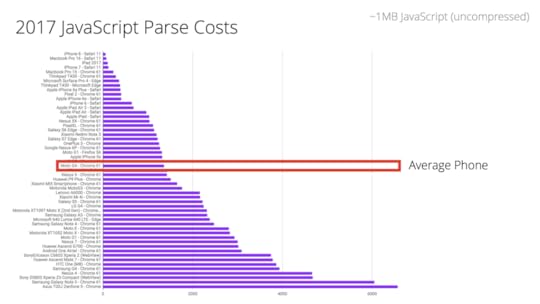 Parse times for a 1MB bundle of JavaScript (~250KB gzipped) across desktop & mobile devices of differing classes. When looking at the cost of parse, it’s the decompressed figures to consider e.g ~250KB gzipped JS decompresses to ~1MB of code.
What about a real-world site, like CNN.com?
On the high-end iPhone 8 it takes just ~4s to parse/compile CNN’s JS compared to ~13s for an average phone (Moto G4). This can significantly impact how quickly a user can fully interact with this site.
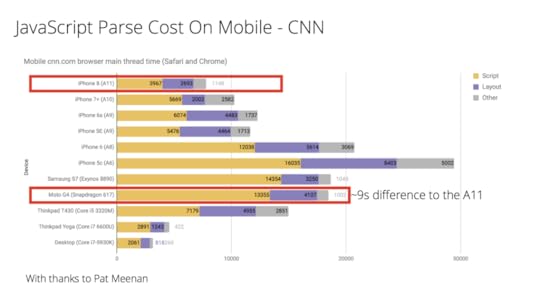 Parse times comparing the performance of Apple’s A11 Bionic chip to the Snapdragon 617 in more average Android hardware.
This highlights the importance of testing on average hardware (like the Moto G4) instead of just the phone that might be in your pocket. Context matters however: optimize for the device & network conditions your users have.

Analytics can provide insight into the mobile device classes your real users are accessing your site with. This can provide opportunities to understand the real CPU/GPU constraints they’re operating with.
Are we really sending down too much JavaScript? Err, possibly :)
Using HTTP Archive (top ~500K sites) to analyze the state of JavaScript on mobile, we can see that 50% of sites take over 14 seconds to get interactive. These sites spend up to 4 seconds just parsing & compiling JS.
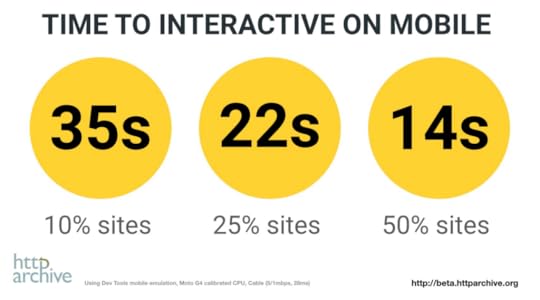
Factor in the time it takes to fetch and process JS and other resources and it’s perhaps not surprising that users can be left waiting a while before feeling pages are ready to use. We can definitely do better here.
Removing non-critical JavaScript from your pages can reduce transmission times, CPU-intensive parsing & compiling and potential memory overhead. This also helps get your pages interactive quicker.
Execution timeIt’s not just parse and compile that can have a cost. JavaScript execution (running code once parsed/compiled) is one of the operations that has to happen on the main thread. Long execution times can also push out how soon a user can interact with your site.
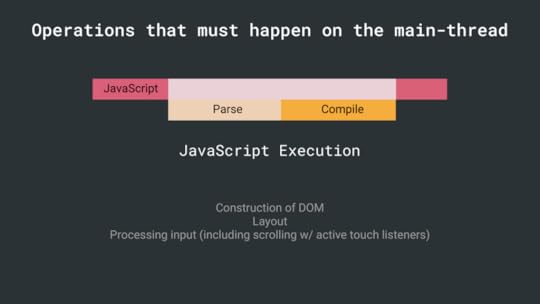
If script executes for more than 50ms, time-to-interactive is delayed by the entire amount of time it takes to download, compile, and execute the JS — Alex Russell
To address this, JavaScript benefits from being in small chunks to avoid locking up the main thread. Explore if you can reduce how much work is being done during execution.
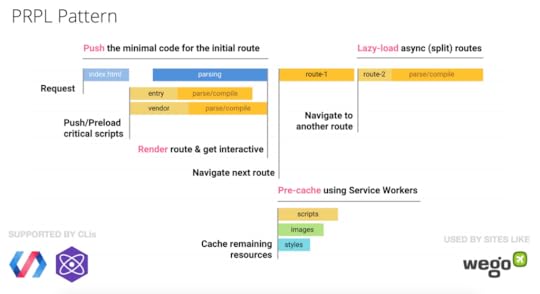
Patterns for reducing JavaScript delivery costWhen you’re trying to keep parse/compile & network transmit times for JavaScript slow, there are patterns that can help like route-based chunking or PRPL.
PRPL is a pattern that optimizes for interactivity through aggressive code-splitting and caching:
Let’s visualize the impact it can have.
We analyze the load-time of popular mobile sites and Progressive Web Apps using V8’s Runtime Call Stats. As we can see, parse time (shown in orange) is a significant portion of where many of these sites spend their time:
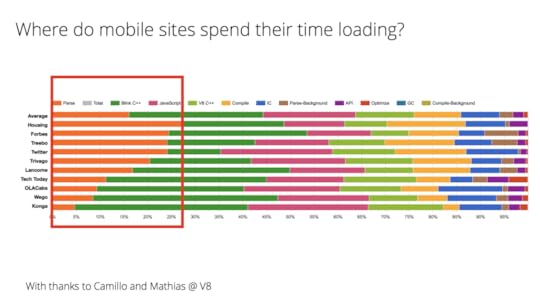
Wego, a site that uses PRPL, manages to maintain a low parse time for their routes, getting interactive very quickly. Many of the other sites above adopted code-splitting and performance budgets to try lowering their JS costs.
Other costsJavaScript can impact page performance in other ways:
Memory. Pages can appear to jank or pause frequently due to GC (garbage collection). When a browser reclaims memory, JS execution is paused so a browser frequently collecting garbage can pause execution more frequently than we may like. Avoid memory leaks and frequent gc pauses to keep pages jank free.During runtime, long-running JavaScript can block the main-thread causing pages that are unresponsive. Chunking up work into smaller pieces (using requestAnimationFrame() or requestIdleCallback() for scheduling) can minimize responsiveness issues.Progressive Bootstrapping
Many sites optimize content visibility as the expensive of interactivity. To get a fast first paint when you do have large JavaScript bundles, developers sometimes employ server-side rendering; then “upgrade” it to attach event handlers when the JavaScript finally gets fetched.
Be careful — this has its own costs. You 1) generally send down a larger HTML response which can push our interactivity, 2) can leave the user in an uncanny valley where half the experience can’t actually be interactive until JavaScript finishes processing.
Progressive Bootstrapping may be a better approach. Send down a minimally functional page (composed of just the HTML/JS/CSS needed for the current route). As more resources arrive, the app can lazy-load and unlock more features.
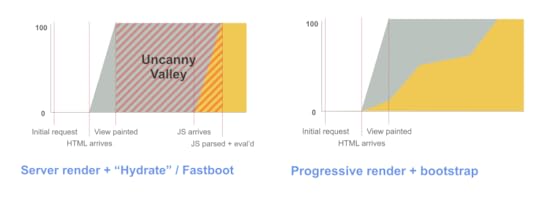 Progressive Bootstrapping visual by Paul Lewis
Loading code proportionate to what’s in view is the holy grail. PRPL and Progressive Bootstrapping are patterns that can help accomplish this.
ConclusionsTransmission size is critical for low end networks. Parse time is important for CPU bound devices. Keeping these low matters.
Teams have found success adopting strict performance budgets for keeping their JavaScript transmission & parse/compile times low. See Alex Russell’s “Can You Afford It?: Real-world Web Performance Budgets” for guidance on budgets for mobile.
 It’s useful to consider how much JS “headroom” the architectural decisions we make can leave us for app logic.
If you’re building a site that targets mobile devices, do your best to develop on representative hardware, keep your JavaScript parse/compile times low and adopt a Performance Budget for ensuring your team are able to keep an eye on their JavaScript costs.
Learn Morehttps://medium.com/media/72e649e2df191c30286c7319de7bd526/hrefJavaScript Start-up PerformanceSolving the web performance crisis — Nolan LawsonCan you afford it? Real-world performance budgets — Alex RussellEvaluating web frameworks and libraries — Kristofer BaxterCloudflare’s Results of experimenting with Brotli for compression (note dynamic Brotli at a higher quality can delay initial page render so evaluate carefully. You probably want to statically compress instead.)Performance Futures — Sam SacconeWith thanks to Nolan Lawson, Kristofer Baxter and Jeremy Wagner for their feedback.

The Cost Of JavaScript was originally published in Dev Channel on Medium, where people are continuing the conversation by highlighting and responding to this story.
September 19, 2017
Hacker News Progressive Web Apps
At Google I/O this year, we introduced HNPWA (Hacker News Readers as PWAs) — a project aiming to demonstrate Progressive Web Apps can be implemented with popular JavaScript frameworks. Implementations follow a short specification but ultimately must demonstrate they can perform well on metrics like how soon a user can interact with the apps.
This is validated using Lighthouse on average mobile hardware (a Moto G4) using WebPageTest’s Faster 3G and Emerging Market 3G profiles.

We started off with apps written in Polymer, Vue, Preact, React, Svelte and Angular and thanks to the community have grown to 22 applications.
Implementations make use of architecture patterns like PRPL and route-based code-splitting. They also use Web Platform primitives like and HTTP/2 Server Push.
The latest suite of apps to ship on HNPWA include StencilJS , Glimmer , React with create-react-app , vanilla JavaScript, Zuix and Next.js :

While HNPWA is not a benchmark, similar to our predecessor TodoMVC, the project tries to give developers open-source examples of how to build PWAs using their preferred JS stacks.
Our hope is that this educational material is useful and gives developers insight into what frameworks meet a decent bar on real mobile devices.
Focusing on user-centric metricsOne of the useful things about Lighthouse is that its metrics highlight key moments during the user’s loading journey, like is it useful? (First meaningful paint) and is it usable? (First Interactive and Consistently Interactive).
These specifically look at when an implementation can first respond to user input and when the network is idle and the main thread can consistently accept user input.
Our hope is that HNPWA can give you a rough feel for how much headroom for your own application logic different frameworks can offer you on mobile.
With many frameworks now including PWA support out of the box, including Polymer (App Toolbox), React (create-react-app), Preact (preact-cli) and Vue (template), passing the baseline Lighthouse PWA audits has become a little more straight-forward. This shifts over the focus to getting performance right and has encouraged implementations to carefully think about how to efficiently load content.
 Only load code the user needs
We mentioned many apps use code-splitting to only deliver the minimal code needed for each route, lazy-loading the rest in. This is great technique for improving how quickly a route is interactive.
Some apps (like PreactHN) even do differential serving based on browser support, such as using babel-preset-env to serve each browser a JS bundle based on the ES2015+ features available:

 Prioritize resources that are important
Other apps take advantage of , a declarative instruction to load late-discovered resources at a higher priority, to make sure their critical JavaScript bundles get fetched as soon as possible.

In the Vue HN app, critical Webpack chunks are loaded sooner using while “lazy” chunks needed for future navigations to other routes are ’d. This is a low-priority hint to the browser to start loading resources that aren’t important for the current page in advance.
To check out the source behind any HNPWA app, click the “Source Code” button in our listings.
 Why Hacker News apps?
HN has open API that is free to use, been around for a number of years, offers multiple “views” and is relatively stable to build on. It also has solid community abstraction APIs build on top of it, such as the excellent node-hnapi (by Lim Chee Aun) used by many HNPWA apps.
There are of course, several other open data sources if HN isn’t your thing, such as Wikipedia’s API. We welcome any efforts to create similar projects to HNPWA using other data sources.
What’s next?We’re always looking to expand the catalog of implementations on HNPWA and welcome contributions. At the same time, we also exploring how we can improve backend latency of using HN as a data-source through our new HNPWA API project. David East from Firebase will be joining us on the blog next time with some details of how you can try that today.
Thank you.
This project would simply not be possible without our community of contributors. A huge thank you to everyone that’s written an implementation and helped us keep the site going. You are all awesome.

Until next time, check out the HN apps, but maybe don’t read the comments ;)
~Addy and the HNPWA team.

Hacker News Progressive Web Apps was originally published in HNPWA on Medium, where people are continuing the conversation by highlighting and responding to this story.
September 12, 2017
A React And Preact Progressive Web App Performance Case Study: Treebo
Authors: Treebo: Lakshya Ranganath , Chrome: Addy Osmani

Treebo is India’s top rated budget hotel chain, operating in a segment of the travel industry worth $20 billion. They recently shipped a new Progressive Web App as their default mobile experience, initially using React and eventually switching to Preact in production.
What they saw compared to their old mobile site was a 70%+ improvement in time to first paint , 31% improvement in time-to-interactive. and loaded in under 4 seconds over 3G for many typical visitors and on their target hardware. It was interactive in under 5s using WebPageTest’s slower 3G emulation in India.
Switching from React to Preact was responsible for a 15% improvement in time-to-interactive alone. You can check out Treebo.com for their full experience but today we would like to dive into some of the technical journey that made shipping this PWA possible.
 Treebo’s Progressive Web AppA Performance JourneyThe old mobile site
Treebo’s old mobile site was powered by a monolithic Django setup. Users had to wait for a server side request for every page transition on the website. This original setup had a first paint time of 1.5s, a first meaningful paint time of 5.9s and was first interactive in 6.5s.
 A basic single-page React app
For their first iteration of the rewrite Treebo started off with a Single Page Application built using React and a simple webpack setup.
You can take a look at the actual code used below. This generates some simple (monolithic) JavaScript and CSS bundles.
https://medium.com/media/ce58c5cbf271148a3eaaa4f0545dea66/hrefThis experience had a first paint of 4.8s, was first interactive in about 5.6s and their meaningful header images painted in about 7.2s.
 Server-side Rendering
Next, they went about optimizing their first paint a little so they tried out Server-side Rendering. It’s important to note, server side rendering is not free. It optimizes one thing at the cost of another.
With server-side rendering, your server’s response to the browser is the HTML of your page that is ready to be rendered so the browser can start rendering without having to wait for all the JavaScript to be downloaded and executed.
Treebo used React’s renderToString() to render components to an HTML string and injecting state for the application on initial boot up.
https://medium.com/media/9af938c7097ee52e9e2ff9c90746cf45/hrefIn Treebos’ case, using server side rendering dropped their first paint time to 1.1s and first meaningful paint time down to 2.4s — this improved how quickly users perceived the page to be ready, they could read content earlier on and it performed slightly better at SEO in tests. But the downside was that it had a pretty negative impact on time to interactive.
Although users could view content, the main thread got pegged while booting up their JavaScript and just hung there.
With SSR, the browser had to fetch and process a much larger HTML payload than before and then still fetch, parse/compile and execute the JavaScript. It was effectively doing more work.
This meant that first interactive happened about 6.6s, regressing.
SSR can also push TTI back by locking up the main thread on lower-end devices.
Code-splitting & route-based chunkingThe next thing Treebo looked at was route-based chunking to help bring down their time-to-interactive numbers.
Route-based chunking aims to serve the minimal code needed to make a route interactive, by code-splitting the routes into “chunks” that can be loaded on demand. This encourages delivering resources closer to the granularity they were authored in.
What they did here was they split out their vendor dependencies, their Webpack runtime manifests and their routes — into separate chunks.
https://medium.com/media/a14fc39a8f2e4dabc4e12583d2e3957c/hrefhttps://medium.com/media/f01df51a447d98b2bbed0166b5aaeab3/hrefThis reduced the time to first interactive down to 4.8s. Awesome!
The only downside was that it started the current route’s JavaScript download only after their initial bundles were done executing, which was also not ideal.
But it did at least have some positive impact on the experience. For route-based code-splitting and this experience, they’re doing something a little bit more implicit. They’re using React Router’s declarative support for getComponent with a webpack import() call to asynchronously load in chunks.
 The PRPL Performance Pattern
Route-based chunking is a great first step in intelligently bundling code for more granular serving and caching. Treebo wanted to build on this and looked to the PRPL pattern for inspiration.
PRPL is a pattern for structuring and serving PWAs, with an emphasis on the performance of app delivery and launch.
PRPL stands for:
Push critical resources for the initial URL route.Render initial route.Pre-cache remaining routes.Lazy-load and create remaining routes on demand.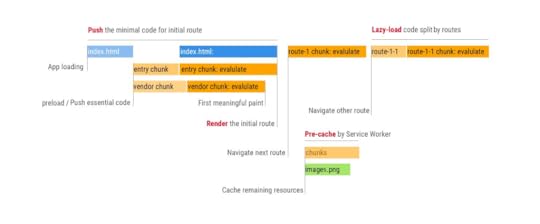 A PRPL visualization by Jimmy Moon
The “Push” part encourages serving an unbundled build designed for server/browser combinations that support HTTP/2 to deliver the resources the browser needs for a fast first paint while optimizing caching. The delivery of these resources can be triggered efficiently using or HTTP/2 Push.
Treebo opted to use to preload the current route’s chunk ahead of time. This had the impact of dropping their first interactive times since the current route’s chunk was already in the cache when webpack made a call to fetch it after their initial bundles finished executing. It shifted the time down a little bit and so the first interactive happened at the 4.6s mark.

The only con they had with preload is that it’s not implemented cross-browser. However, there’s an implementation of link rel preload in Safari Tech Preview. I’m hopeful that it’s going to land and stick this year. There’s also work underway to try landing it in Firefox.
HTML StreamingOne difficulty with renderToString() is that it is synchronous, and it can become a performance bottleneck in server-side rendering of React sites. Servers won’t send out a response until the entire HTML is created. When web servers stream out their content instead, browsers can render pages for users before the entire response is finished. Projects like react-dom-stream can help here.
To improve perceived performance and introduce a sense of progressive rendering to their app, Treebo looked to HTML Streaming. They would stream the head tag with link rel preload tags set up to early preload in their CSS and their JavaScripts. They then perform their server side rendering and send the rest of the payload down to the browser.
The benefit of this was that resource downloads started earlier on, dropping their first paint to 0.9s and first interactive to 4.4s. The app was consistently interactive around the 4.9/5 second mark.
The downside here was that it kept the connection open for a little bit longer between the client and server, which could have issues if you run into longer latency times. For HTML streaming, Treebo defined an early chunk with the content, then they have the main content and the late chunks. All of these being injected into the page. This is what it looks like:
https://medium.com/media/5fb0be5a5d8ec95dc1c920b7d9efdc35/hrefEffectively, the early chunk has got their rel=preload statements for all of their different script tags. The late chunk has got the server rendered html and anything that’s going to include state or actually use the JavaScript that’s being loaded in.
Inlining critical-path CSSCSS Stylesheets can block rendering. Until the browser has requested, received, downloaded and parsed your stylesheets, the page can remain blank. By reducing the amount of CSS the browser has to go through, and by inlining (critical-path styles) it on the page, thus removing a HTTP request, we can get the page to render faster.
Treebo added support for Inlining their critical-path CSS for the current route and asynchronously loading in the rest of their CSS using loadCSS on DOMContentLoaded.
It had the effect of removing the critical-path render blocking link tag for stylesheets and inlining fewer lines of core CSS, improving first paint times to about 0.4s.
https://medium.com/media/18915ccf260494d1a9677419a8b9510d/hrefThe downside was that time to first interactive went up a bit to 4.6s as the payload size was larger with inline styles and took time to parse before JavaScript could be executed.
 Offline-caching static assets
A Service Worker is a programmable network proxy, allowing you to control how network requests from your page are handled.
Treebo added support for Service Worker caching of their static assets as well a custom offline page. Below we can see their Service Worker registration and how they used sw-precache-webpack-plugin for resource caching”
https://medium.com/media/60a3e6af796f29657589f084dd9e1570/href
Caching static assets like their CSS and JavaScript bundles means pages load up (almost) instantly on repeat visits as they load from the disk cache rather than having to go back out to the network each time. Diligently defined caching headers can have this same effect with respect to disk cache hit-rates, but it’s Service Worker that gives us offline support.
Serving JavaScript cached using Service Worker using the Cache API (as we covered in JavaScript Start-up Performance) also has the nice property of early-opting Treebo into V8’s code cache so they save a little time on start-up during repeat visits.
Next, Treebo wanted to try getting their vendor bundle-size and JS execution time down, so they switched from React to Preact in production.
Switching from React to PreactPreact is a tiny 3KB alternative to React with the same ES2015 API. It aims to offer high performance rendering with an optional compatibility later (preact-compat) that works with the rest of the React ecosystem, like Redux.
Part of Preact’s smaller size comes from removing Synthetic Events and PropType validations. In addition it:
Diffs Virtual DOM against the DOMAllows props like class and forPasses (props, state) to renderUses standard browser eventsSupports fully async renderingSubtree invalidation by defaultIn a number of PWAs, switching to Preact has led to smaller JS bundle sizes and lower initial JavaScript boot-up times for the application. Recent PWA launches like Lyft, Uber and Housing.com all use Preact in production.
Note: Working with a React codebase and want to use Preact? Ideally, you should use preact and preact-compat for your dev, prod and test builds. This will enable you to discover any interop bugs early on. If you would prefer to only alias preact and preact-compat in Webpack for production builds (e.g if your preference is using Enzyme), make sure to thoroughly test everything works as expected before deploying to your servers.
In Treebo’s case, this switch had the impact of dropping their vendor bundle sizes from 140kb all the way down to 100kb. This is all gzipped, by the way. It dropped first interactive times from 4.6s to 3.9s on Treebo’s target mobile hardware which was a net win.
You can do this in your Webpack config by aliasing react to preact-compat, and react-dom to preact-compat as well.
https://medium.com/media/da0ff4a627b95269c8e239392ddfe867/hrefThe downside to this approach was that they did have to end up putting together a few workarounds in order to get Preact working exactly with all the different pieces of the React ecosystem that they wanted to use.
Preact tends to be a strong choice for the 95% of cases you would use React; for the other 5% you may end up needing to file bugs to work around edge-cases that are not yet factored in.
Notes: As WebPageTest does not currently offer a way to test real Moto G4s directly from India, performance tests were run under the “Mumbai — EC2 — Chrome — Emulated Motorola G (gen 4) — 3GSlow — Mobile” setting. Should you wish to look at these traces they can be found here .
Skeleton screens“A skeleton screen is essentially a blank version of a page into which information is gradually loaded.”
~Luke Wroblewski

Treebo like to implement their skeleton screens using preview enhanced components (a little like skeleton screens for each component). The approach is basically to enhance any atomic component (Text, Image etc) to have a preview version, such that if the source data that is required for the component is not present, it shows the preview version of the component instead.
For example, if you look at the hotel name, city name, price etc in the list items above, they’re implemented using Typography components like which take two extra props, preview and previewStyle which is used like so.
https://medium.com/media/eae1a3e09833fd6f03de8d02f93e03e8/hrefBasically, if the hotel.name does not exist then the component changes the background to a greyish color with the width and other styles set according to the previewStyle passed down (width defaults to 100% if no previewStyle is passed).
https://medium.com/media/198b3c5462c925b69024087f46a3cf3f/hrefTreebo likes this approach because the logic to switch to the preview mode is independent of the data actually being shown which makes it flexible. If you look at the “Incl. of all taxes” part, it’s just static text, which could have been shown right at the start but that would’ve looked very confusing to the user since the prices are still loading during the api call.
So to get the static text “Incl. of all prices” into a preview mode alongside the rest of the ui they just use the price itself as the logic for the preview mode.
https://medium.com/media/e228ced8d0e28d70380ede7a48af014f/hrefThis way while the prices are loading you get a preview UI and once the api succeeds you get to see the data in all its glory.
Webpack-bundle-analyzerAt this point, Treebo wanted to perform some bundle analysis to look at what other low-hanging fruit they could optimize.
Note: If you’re using a library like React on mobile, it’s important to be diligent about the other vendor libraries you are pulling in. Not doing so can negatively impact performance. Consider better chunking your vendor libraries so that routes only load those that are needed
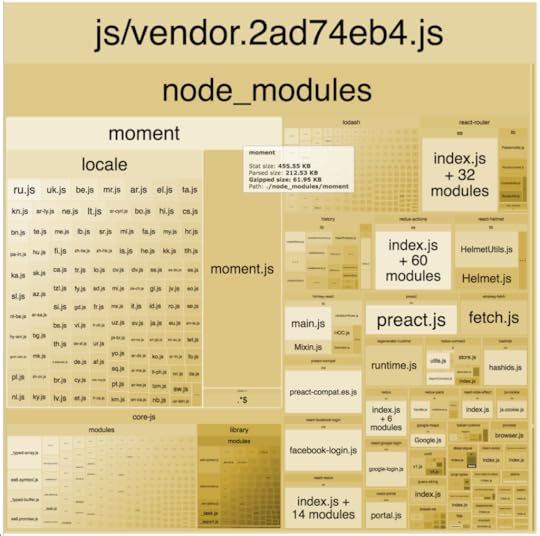
Treebo used webpack-bundle-analyzer to keep track of their bundle size changes and to monitor what modules are contained in each route chunk. They also use it to find areas where they can optimize to reduce bundle sizes such as stripping moment.js’ locales and reusing deep dependencies.
Optimizing moment.js with webpackTreebo relies heavily on moment.js for their date manipulations. When you import moment.js and bundle it with Webpack, your bundle will include all of moment.js and it’s locales by default which is ~61.95kb gzipped. This seriously bloats your final vendor bundle size.
To optimize the size of moment.js, there are two webpack plugins available: IgnorePlugin, ContextReplacementPlugin
Treebo opted to remove all locale files with the IgnorePlugin since they didn’t need any of the them.
new webpack.IgnorePlugin(/^\.\/locale$/, /moment$/)
With the locales stripped out, the moment.js’ bundled size dropped to ~16.48kb gzipped.
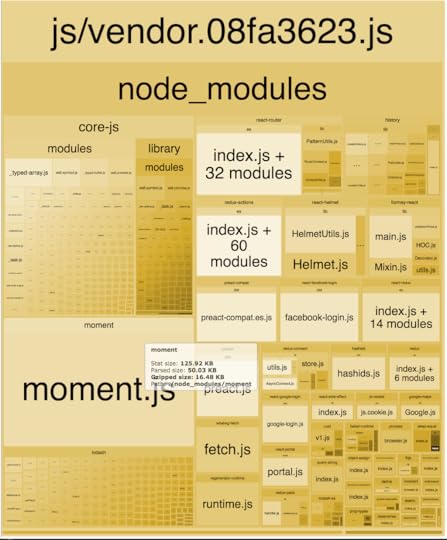
The biggest improvement as a side effect of stripping out moment.js’ locales was that the vendor bundle size dropped from ~179kb to ~119kb. That’s a massive 60kb drop from a critical bundle that has to be served on first load. All this translates to a considerable decrease in first interaction times. You can read more about optimizing moment.js here.
Reusing existing deep dependenciesTreebo was initially using the “qs” module to perform query string operations. Using the webpack-bundle-analyzer output they found that “react-router” included the “history” module which in-turn included the “query-string” module.
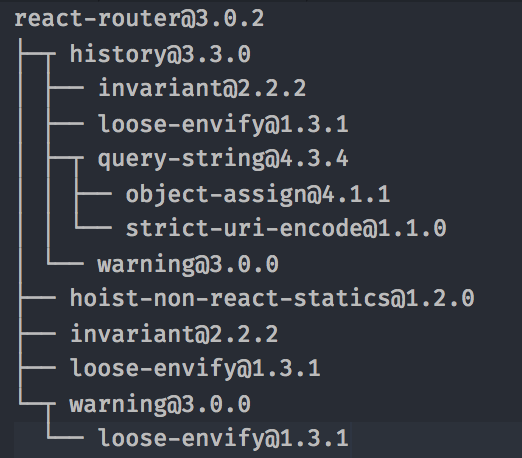
Since there were two different modules both accomplishing the same operations, replacing “qs” with this version of “query-string” (by installing it explicitly) in their source code, dropped their bundle size by a further 2.72kb gzipped (size of the “qs” module).
Treebo have been good open source citizens. They’ve been using a lot of open source software. In return, they’ve actually open sourced most of their Webpack configuration, as well as a boilerplate that contains a lot of the set up they’re using in production. You can find that here: https://github.com/lakshyaranganath/pwa

They’ve also committed to trying to keep that up to date. As they evolve you can take advantage of them as another PWA reference implementation.
Conclusions and the futureTreebo knows that no application is perfect, they actively explore many methods to keep improving the experience they deliver to their users. Some of which are:
Lazy Loading Images
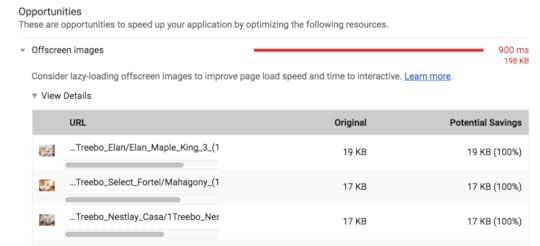
Some of you might have figured out from the network waterfall graphs before that the website image downloads are competing for bandwidth with the JS downloads.

Since image downloads are triggered as soon as the browser parses the img tags, they share the bandwidth during JS downloads. A simple solution would be lazy loading images only when they come into the user’s viewport, this will see a good improvement in our time to interactive.
Lighthouse highlights these problems well in the offscreen images audit:
Dual Importing
Treebo also realise that while they are asynchronously loading the rest of the CSS for the app (after inlining the critical css), this approach is not viable for their users in the long run as their app grows. More features and routes means more CSS, and downloading all of that leads to bandwidth hogging and wastage.
Merging approaches followed by loadCSS and babel-plugin-dual-import, Treebo changed their approach to loading CSS by using an explicit call to a custom implemented importCss(‘chunkname’) to download the CSS chunk in parallel to their import(‘chunkpath’) call for their respective JS chunk.
https://medium.com/media/450a0d6ec0fda650bc1be64de14d455c/hrefWith this new approach, a route transition results in two parallel asynchronous requests, one for JS and the other for CSS unlike the previous approach where all of the CSS was being downloaded on DOMContentLoaded. This is more viable since a user will only ever download the required CSS for the routes they are visiting.
A/B Testing
Treebo are currently implementing an AB testing approach with server side rendering and code splitting so as to only push down the variant that user needs during both server and client side rendering. (Treebo will follow up with a blog post on how they tackled this).
Eager Loading
Treebo ideally don’t want to always load all the split chunks of the app on load of the initial page since they want to avoid the bandwidth contention for critical resource downloads — this also wastes precious bandwidth for mobile users especially if you’re not caching it with service-worker for their future visits. If we look at how well Treebo is doing on metrics like consistently interactive, there’s still much room for improvement:

This is an area they’re experimenting with improving. One example is eager loading the next route’s chunk during the ripple animation of a button. onClick Treebo make a webpack dynamic import() call to the next route’s chunk entry and delay the route transition with a setTimeout. They also want to make sure that the next route’s chunk is small enough to be downloaded within the given 400ms timeout on a slow 3g network.
That’s a wrap.It’s been fun collaborating on this write-up. There’s obviously more work to be done, but we hope you found Treebo’s performance journey an interesting read :) You can find us over on twitter at @addyosmani and @__lakshya (yep, double underscore xD) we would love to hear your thoughts.
With thanks to @_zouhir , @_developit and @samcccone for their reviews and input.
If you’re new to React, React for Beginners by Wes Bos is a comprehensive overview for getting started.

A React And Preact Progressive Web App Performance Case Study: Treebo was originally published in Dev Channel on Medium, where people are continuing the conversation by highlighting and responding to this story.
March 27, 2017
Preload, Prefetch And Priorities in Chrome

Today we’ll dive into insights from Chrome’s networking stack to provide clarity on how web loading primitives (like & ) work behind the scenes so you can be more effective with them.
As covered well in other articles, preload is a declarative fetch, allowing you to force the browser to make a request for a resource without blocking the document’s onload event.
Prefetch is a hint to the browser that a resource might be needed, but delegates deciding whether and when loading it is a good idea or not to the browser.
 Preload can decouple the load event from script parse time. If you haven’t used it before, read ‘Preload: What is it Good For?’ by Yoav WeissPreload success stories in production sites
Before we dive into the details, here’s a quick summary of some positive impact to loading metrics that have been observed using preload in the last year:
Housing.com saw a ~10% improvement in Time to Interactive when they switched to preloading key late-discovered scripts for their Progressive Web App:

Shopify’s switch to preloading Web Fonts saw a 50% (1.2 second) improvement in time-to-text-paint on Chrome desktop (cable). This removed their flash-of-invisible text completely.
 Left: with preload, Right: without (video)
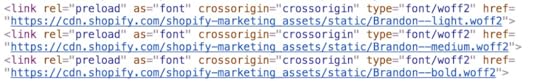 Web Font loading using
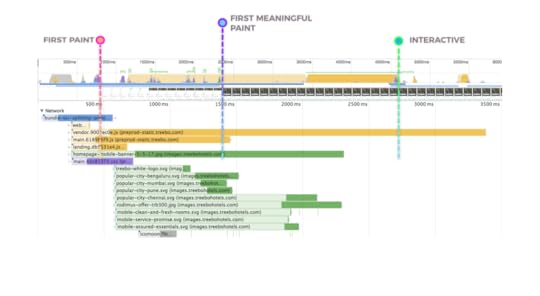
 Treebo, one of India’s largest hotel chains shaved 1 second off both time to First Paint and Time to Interactive for their desktop experience over 3G, by preloading their header image and key Webpack bundles:

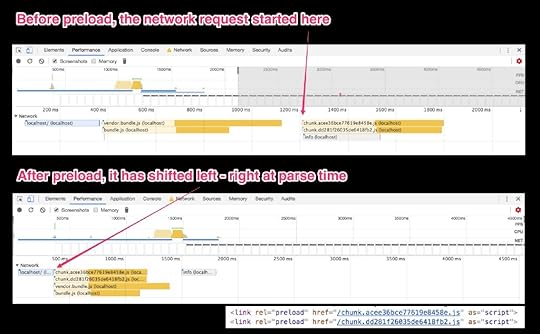
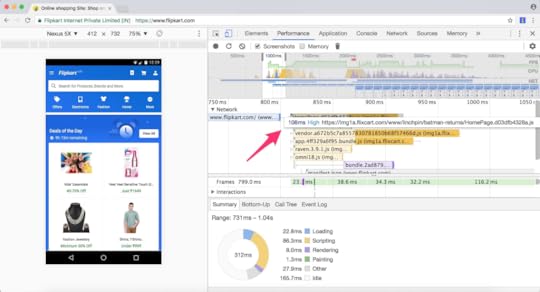
Similarly, by switching to preloading their key bundles, Flipkart shaved a great deal of main thread idle before route chunks get evaluated on their PWA (trace from a low-end phone over 3G):
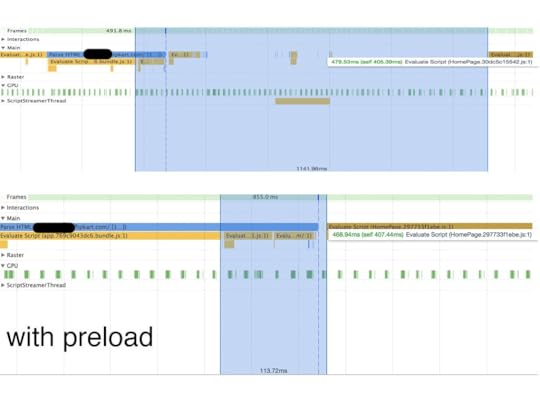 Top: without preload, Bottom: with preload
And the Chrome Data Saver team saw time to first contentful paint improvements of 12% on average for pages that could use preload on scripts and CSS stylesheets.
As for prefetch, it’s widely used and at Google we still use it in Search results pages to prefetch critical resources that can speed up rendering destination pages.
Preload is used in production by large sites for a number of use-cases and you can find more of them later on in the article. Before that, let’s dive into how the network stack actually treats preload vs prefetch.
When should you vs ?Tip: Preload resources you have high-confidence will be used in the current page. Prefetch resources likely to be used for future navigations across multiple navigation boundaries.
Preload is an early fetch instruction to the browser to request a resource needed for a page (key scripts, Web Fonts, hero images).
Prefetch serves a slightly different use case — a future navigation by the user (e.g between views or pages) where fetched resources and requests need to persist across navigations. If Page A initiates a prefetch request for critical resources needed for Page B, the critical resource and navigation requests can be completed in parallel. If we used preload for this use case, it would be immediately cancelled on Page A’s unload.
Between preload and prefetch, we get solutions for loading critical resources for the current navigation _or_ a future navigation.
What is the caching behavior for and ?Chrome has four caches: the HTTP cache, memory cache, Service Worker cache & Push cache. Both preload and prefetched resources are stored in the HTTP cache.
When a resource is preloaded or prefetched is travels up from the net stack through to the HTTP cache and into the renderer’s memory cache. If the resource can be cached (e.g there’s a valid cache-control with valid max-age), it is stored in the HTTP cache and is available for current and future sessions. If the resource is not cacheable, it does not get stored in the HTTP cache. Instead, it goes up to the memory cache and stays there until it gets used.
How does Chrome’s network prioritisation handle preload and prefetch?Here’s a break-down (courtesy of Pat Meenan) showing how different resources are prioritized in Blink as of Chrome 46 and beyond:
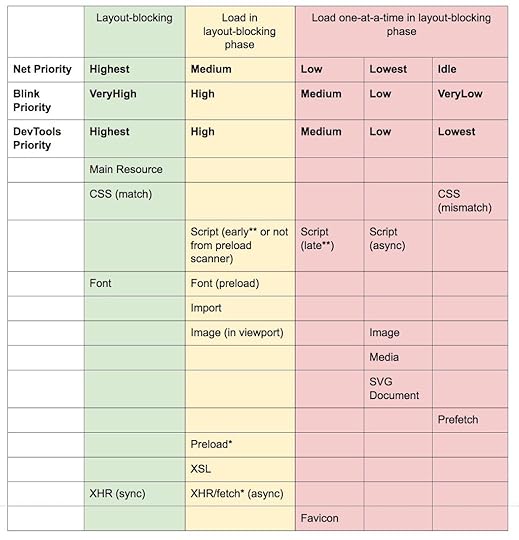 * Preload using “as” or fetch using “type” use the priority of the type they are requesting. (e.g. preload as=style will use Highest priority). With no “as” they will behave like an XHR. ** “Early” is defined as being requested before any non-preloaded images have been requested (“late” is after). Thanks to Paul Irish for updating this table with the DevTools priorities mapping to the Net and Blink priorities.
Let’s talk about this table for a moment.
Scripts get different priorities based on where they are in the document and whether they are async, defer or blocking:
Blocking scripts requested before the first image (an image early in the document) are Net:MediumBlocking scripts requested after the first image is fetched are Net:LowAsync/defer/injected scripts (regardless of where they are in the document) are Net:LowestImages (that are visible and in the viewport) have a higher priority (Net:Medium) than those that are not in the viewport (Net:Lowest), so to some extent Chrome will do it’s best to pseudo-lazy-load those images for you. Images start off with a lower priority and after layout is done and they are discovered to be in the viewport, will get a priority boost (but note that images already in flight when layout completes won’t be reprioritized).
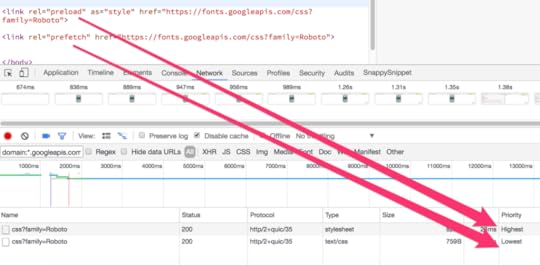
Preloaded resources using the “as” attribute will have the same resource priority as the type of resource they are requesting. For example, preload as=“style” will get the highest priority while as=”script” will get a low or medium priority. These resources are also subject to the same CSP policies (e.g script is subject to script-src).
Preloaded resources without an “as” will otherwise be requested with the same priority as async XHR (so High).
If you’re interested in understanding what priority a resource was loaded with, this information is exposed in DevTools via both the Network section of Timeline/Performance:
and in the Network panel behind the “Priority” column:
 What happens when a page tries to preload a resource that has already been cached in the Service Worker cache, the HTTP cache or both?
This is going to be a large “it depends” but generally, something good should almost always happen in this case — the resource won’t be refetched from the network unless it has expired from the HTTP cache or the Service Worker intentionally refetches it.
If the resource is in the HTTP cache (between the SW Cache & the network) then preload should get a cache hit from the same resource.
Are there risks with these primitives of wasting a user’s bandwidth?With “preload” or “prefetch”, you’re running some risk of wasting a user’s bandwidth, especially if the resource is not cacheable.
Unused preloads trigger a console warning in Chrome, ~3 seconds after onload:
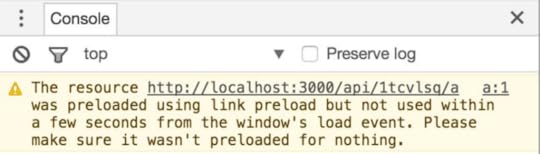
The reason for this warning is you’re probably using preload to try warming the cache for other resources you need to improve performance but if these preloaded resources aren’t being used, you’re doing extra work for no reason. On mobile, this sums up to wasting a user’s data plans, so be mindful of what you’re preloading.
What can cause double fetches?Preload and prefetch are blunt tools and it isn’t hard to find yourself double-fetching if you aren’t careful.
Don’t use “prefetch” as a fallback for “preload”. They’re again, used for different purposes and often end up causing double fetches while this probably isn’t your intention. Use preload if it’s supported for warming the cache for current sessions otherwise prefetch for future sessions. Don’t use one in place of the other.
Don’t rely on fetch() working with “preload”… just yet. In Chrome if you try to use preload with the fetch() API you will end up triggering a double download. This doesn’t currently occur with XHR and we have an open bug to try addressing it.
Supply an “as” when preloading or you’ll negate any benefits!
If you don’t supply a valid “as” when specifying what to preload, for example, scripts, you will end up fetching twice.
Preloaded fonts without crossorigin will double fetch! Ensure you’re adding a crossorigin attribute when fetching fonts using preload otherwise they will be double downloaded. They’re requested using anonymous mode CORS. This advice applies even if fonts are on the same origin as the page. This is applicable to other anonymous fetches too (e.g XHR by default).
Resources with an integrity attribute can’t reuse preloaded resources (for now) and can also cause double fetches. The `integrity` attribute for link elements has not yet been implemented and there’s an open spec issue about it. This means the presence of any integrity metadata will currently discard preloaded resources. In the wild, it can also result in duplicate requests where you have to make a trade-off between security and performance.
Finally, although it won’t cause double fetches, this is generally good advice:
Don’t try preloading absolutely everything! Instead, select specific late discovered resources that you want to load earlier and use preload to tell the browser about them.
Should I just preload all the assets that my page requests in the head? Is there a recommended limit like “only preload ~6 things”?This is a good example of Tools, not rules. How much you preload may well factor in how much network contention you’re going to have with other resources also being loaded on your page, your user’s available bandwidth and other network conditions.
Preload resources that are likely to be discovered late in your page, but are otherwise important to fetch as early as possible. With scripts, preloading your key bundles is good as it separates fetching from execution in a way that just using say,
Does prefetch have any magical properties you should be aware of? Well, yes.In Chrome, if a user navigates away from a page while prefetch requests for other pages are still in flight, these requests will not get terminated.
Furthermore, prefetch requests are maintained in the unspecified net-stack cache for at least 5 minutes regardless of the cachability of the resource.
I’m using a custom “preload” implementation written in JS. How does this differ from rel=”preload” or Preload headers?Preload decouples fetching a resource from JS processing and execution. As such, preloads declared in markup are optimized in Chrome by the preload scanner. This means that in many cases, the preload will be fetched (with the indicated priority) before the HTML parser has even reached the tag. This makes it a lot more powerful than a custom preload implementation.
Wait. Shouldn’t we be using HTTP/2 Server Push instead of Preload?Use Push when you know the precise loading order for resources and have a service worker to intercept requests that would cause cached resources to be pushed again. Use preload to move the start download time of an asset closer to the initial request — it’s useful for both first and third-party resources.
Again, this is going to be an “it depends”. Let’s imagine we’re working on a cart for the Google Play store. For a given request to play.google.com/cart:
Using Preload to load key modules for the page requires the browser to wait for the play.google.com/cart payload in order for the preload scanner to detect dependencies, but after this contains sufficient information to saturate a network pipe with requests for the site’s assets. This might not be the most optimal at cold-boot but is very cache and bandwidth friendly for subsequent requests.
Using H/2 Server Push, we can saturate the network pipe right away on the request for play.google.com/cart but can waste bandwidth if the resources being pushed are already in the HTTP or Service Worker cache. There are always going to be trade-offs for these two approaches.
Although Push is invaluable, it doesn’t enable all the same use-cases as Preload does.
Preload has the benefit of decoupling download from execution. Thanks to support for document onload events you can control scripting if, how and when a resource gets applied. This can be powerful for say, fetching JS bundles and executing them in idle blocks or fetching CSS and applying them at the right point in time.
Push can’t be used by third-party hosted content. By sending resources down immediately, it also effectively short-circuits the browser’s own resource prioritization logic. In cases where you know exactly what you’re doing, this can yield performance wins, but in cases where you don’t you could actually harm performance significantly.
What is the Link preload header? How does it compare to the preload link tag? And how does it relate to HTTP/2 Server Push?As with other types of links, a preload link can be specified using either an HTML tag or an HTTP header (a Link preload header). In either case, a preload link directs the browser to begin loading a resource into the memory cache, indicating that the page expects with high confidence to use the resource and doesn’t want to wait for the preload scanner or the parser to discover it.
When the Financial Times introduced a Link preload header to their site, they shaved 1 second off the time it took to display the masthead image:
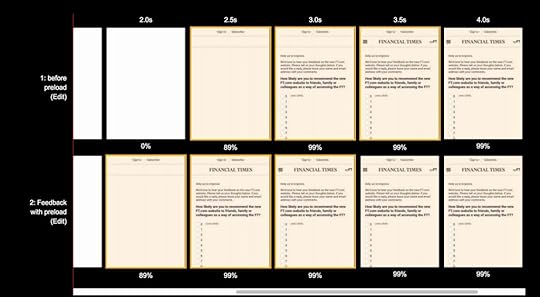 Bottom: with preload, Top: without. Comparison for Moto G4 over 3G: Before: https://www.webpagetest.org/result/170319_Z2_GFR/, After: https://www.webpagetest.org/result/170319_R8_G4Q/
You can provide preload links in either form, but there is one important difference you should understand: as allowed by the spec, many servers initiate an HTTP/2 Server Push when they encounter a preload link in HTTP header form. The performance implications of H/2 Server Push are different from those of preloading (see below), so you should make sure you don’t unintentionally trigger pushes.
You can avoid unwanted pushes by using preload link tags instead of headers, or by including the ‘nopush’ attribute in your headers.
How can I feature detect support for link rel=preload?Feature detecting for can be accomplished using the following snippet:
const preloadSupported = () => {const link = document.createElement('link');
const relList = link.relList;
if (!relList || !relList.supports)
return false;
return relList.supports('preload');
};
The FilamentGroup also have a preload check they use as part of their async CSS loading library, loadCSS.
Can you immediately apply preloaded CSS stylesheets?Absolutely. Preload support markup based asynchronous loading. Stylesheets loaded using can be immediately applied to the current document using the `onload` event as follows:
For more examples like this, see Use Cases in this great Yoav Weiss deck.
What else is Preload being used for in the wild?According to the HTTPArchive, most sites using use it to preload Web Fonts , including Teen Vogue and as mentioned earlier, Shopify:
While other popular sites like LifeHacker and JCPenny use it to asynchronously load CSS (via the FilamentGroup’s loadCSS ):
And then there are a growing breed of Progressive Web Apps (like Twitter.com mobile, Flipkart and Housing) using it to preload scripts that are needed for the current navigation using patterns like PRPL :

The basic idea there is to maintain artifacts at high-granularity (as opposed to monolithic bundles) so any facet of the app can on demand load it’s dependencies or preload those that are likely to be needed next to warm up the cache.
What is the current browser support for Preload and Prefetch?is available to ~50% of the global population according to CanIUse and is implemented in the Safari Tech Preview. is available to 71% of global users.
Further insights you may find helpful:Yoav Weiss landed a recent change in Chrome that avoids preload contending with CSS & blocking scripts.He also recently split the ability to preload media into three distinct types: video, audio and track.Domenic Denicola is exploring a spec change to add support for preloading ES6 Modules.Yoav also recently shipped support for Link header support for “prefetch” allowing easier additional of resource hints needed for the next navigation.Further reading on these loading primitives:Preload — what is it good for? — Yoav WeissA study by the Chrome Data Saver teamPlanning for performance — Sam SacconeWebpack plugin for auto-wiring up What is preload, prefetch and preconnect? — KeyCDNWeb Fonts preloaded by Zach LeatHTTP Caching: cache-control by Ilya GrigorikWith thanks to @ShopifyEng, @AdityaPunjani from Flipkart, @HousingEngg, @adgad and @wheresrhys at the FT and @__lakshya from Treebo for sharing their before/after preload stats.
With many thanks for their technical reviews & suggestions: Ilya Grigorik, Gray Norton, Yoav Weiss, Pat Meenan, Kenji Baheux, Surma, Sam Saccone, Charles Harrison, Paul Irish, Matt Gaunt, Dru Knox, Scott Jehl.

Preload, Prefetch And Priorities in Chrome was originally published in reloading on Medium, where people are continuing the conversation by highlighting and responding to this story.
February 27, 2017
Progressive Web App Libraries in Production

Two years ago, our team at Google started work on JavaScript libraries to reduce the friction for building Progressive Web Apps.
We started with Service Worker tools like sw-precache and sw-toolbox — now used by 1000s of brands to power offline caching & instant loading (on repeat visit) in their production mobile sites:

In 2017, if you aren’t taking advantage of Service Workers, you’re leaving performance wins for returning users on the table.
Let’s compare the before/after Timeline strips for the CNet’s Tech Today and Housing.com PWAs. We can see first view taking a few seconds over average 3G. Look at the 3–4 second improvement Service Worker caching their App’s Shell and data made to their loading times:
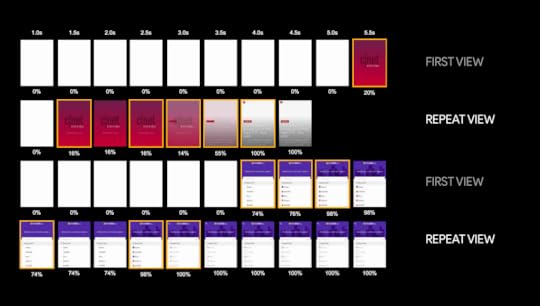
Wooo. They’re almost instant :) This approach has helped sites load and get interactive far more quickly with Service Worker. This replicates a desirable performance characteristic of native apps — once the (web) app is installed, up-front costs for reloading are amortized and don’t have a variable delay.
Service Workers are about Reliable Performance. Not just “Offline Support” — Alex Russell, Chrome
Large sites like Twitter.com, who recently shipped 100% of their mobile web traffic to their PWA with Service Worker, an Application Shell architecture and the PRPL pattern are also seeing similar wins:

This isn’t an optimization that only applies to mobile and PWAs. Service Workers can improve the load performance of your desktop sites too.
For example, Flipkart cache their static assets so on repeat visits First Meaningful Paint occurs 1.5s faster than first load:
 Flipkart.com on desktop using sw-precache to cache static assets to shave seconds off their repeat visit load times
As covered in JavaScript Start-up Performance, a Service Worker also opts you in to V8’s code caching on first execution of your JavaScript so you’ll get faster start-up times for JS too.
Service Workers can help with more than just caching.
We also shipped a library for Offline Google Analytics, powered by Service Worker and IndexedDB. When a user is offline or has a flaky network connection, we’ll queue up their analytics and post them once they return online. This is used by sites like eBay Classifieds in Mexico to minimize the loss of useful stats when users are on the go:
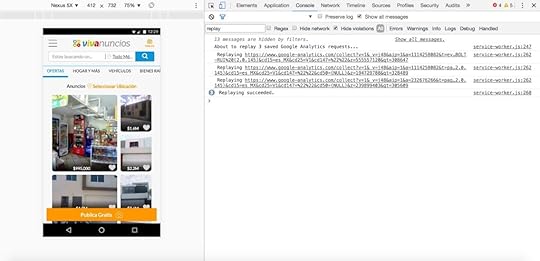
After successfully dogfooding the idea in the Google I/O 2015 site we found it useful enough that we wanted to generalize it so anyone could use it.
A nice compliment to the offline analytics library is Autotrack — a helper to make it easier to track analytics events most people care about. It has plugins for PWA/SPA URL changes, element visibility, user scrolling, media queries, page visibility & more. These plugins help production sites like 1Password easily track important events without the boilerplate overhead:
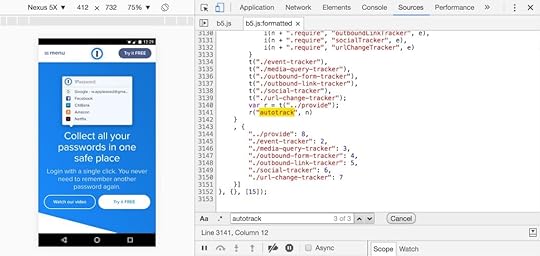
Next, we started work on a Web Push Notifications library, but an opportunity arose to collaborate with Firebase on a much nicer solution so we also helped ship Firebase Cloud Messaging. It’s a cross-platform messaging solution that can send message or data based notifications and works great with PWAs.
Alibaba is just one of the production PWAs using FCM today:

We also contributed to the web-push library by Mozilla, an alternative folks can look at in this space.
With Service Worker being a core part of many of our libraries, we
also needed some utilities to help unit test them. We created selenium-assistant for end-to-end testing across multiple browsers using Selenium. We also wrote sw-testing-helpers to manage Service Workers in tests.
Google Developer Codelabs for sw-precache , sw-toolbox & offline-analytics are freely available.
Service Worker generationsw-precache (which also works great with Webpack) generates a Service Worker for you. At it’s simplest, you can provide it with a “dist” directory and it will provide sane defaults for caching any static assets offline, so they instantly load from the Cache Storage API on repeat visits:
$ sw-precache --root=distYou can verify files are being correctly cached by using the Chrome DevTools Application panel. Look for ‘Cache Storage’ after loading your page and you should see entries corresponding to the directory supplied:
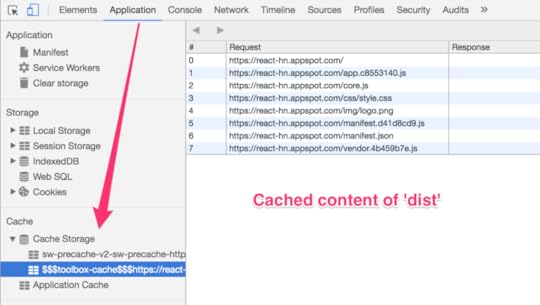
There’s also support for passing complex configurations using --config . Any of the options from the file can be overridden through a command-line flag. We recommend using an external JavaScript file to define configurations using module.exports. For example, assume there's a path/to/sw-precache-config.js file that contains:
module.exports = {staticFileGlobs: [
'app/css/**.css',
'app/**.html',
'app/images/**.*',
'app/js/**.js'
],
stripPrefix: 'app/',
runtimeCaching: [{
urlPattern: /this\\.is\\.a\\.regex/,
handler: 'networkFirst'
}]
};
We can pass the file to the command-line interface, also setting the verbose option:
sw-precache --config=path/to/sw-precache-config.js --verboseThis provides the most flexibility, such as providing a regular expression for the runtimeCaching.urlPattern option. On successfully running sw-precache, it will also summarize the estimated size of assets being precached to help you stay aware of user data-plan usage:

With the Webpack plugin, a typical setup for precaching static assets might look as follows:
const SWPrecacheWebpackPlugin = require('sw-precache-webpack-plugin');module.exports = {// ...
plugins: [
// ...
new SWPrecacheWebpackPlugin({
cacheId: 'my-cache',
filename: 'service-worker.js',
staticFileGlobs: [
'./public/images/**/*.{png,jpg,gif}',
'./public/scripts/**/*.js',
'./public/styles/**/*.css',
'./public/partials/**/*.html'
],
stripPrefix: './public/'
})
]
};Integrating sw-precache into a gulp build system
To use sw-precache in gulp, we first import the plugin at the top of our gulpfile:
const swPrecache = require('sw-precache');We then create a gulp task and call write on swPrecache as follows:
swPrecache.write(filePath, options, callback)filePath is the location of the file to write the service worker to. options is an object that defines the behavior of the generated service worker (see the documentation on Github for the full list of options). The callback is always executed. This is for gulp to know when an async operation has completed. If there is an error, it is passed to the callback. If no error is found, null is passed to the callback.
Let’s look at an example:
gulp.task('generate-service-worker', function(callback) {swPrecache.write('app/service-worker.js'), {
//1
staticFileGlobs: [
'app/index.html',
'app/js/bundle.js',
'app/css/bundle.css',
'app/img/**/*.{svg,png,jpg,gif}'
],
// 2
importScripts: [
'app/node_modules/sw-toolbox/sw-toolbox.js',
'app/js/toolbox-script.js'
],
// 3
stripPrefix: 'app/'
}, callback);
});
We call the gulp task 'generate-service-worker' and pass a callback to the function to make it asynchronous.
swPrecache.write generates a service worker with the following options:
The resources in staticFileGlobs are precached, meaning the generated service worker will contain an install event handler that caches the resources.The scripts in importScripts are included in the generated service worker inside an importScripts method. In the example we are including the sw-toolbox module and a script containing our routes.The app/ prefix is removed from all file paths in staticFileGlobs so that the paths in the generated service worker are relative.Runtime Cachingsw-toolbox is a complimentary library that enables you to intercept network requests in the Service Worker and perform a caching strategy with the response. It works off of routes, which behave like fetch() event listeners.
A route intercepts network requests matching a URL pattern and HTTP request method. It then responds based on the rules in the request handler. sw-toolbox has about 5 built-in handlers for covering the most common caching strategies:

If you’re familiar with Express, sw-toolbox supports URL patterns using a similar syntax to its routing syntax.
toolbox.router.get('img/**/*.{png,jpg}', global.toolbox.cacheFirst);This will intercept GET requests for any PNG/JPG file under the img folder. It handles requests according to the cacheFirst strategy, first checking the cache for a response. If that fails, the request gets sent to the network. If that succeeds, the response gets added to the cache.
Full domains can also be used here, e.g this will cache your Google Fonts:
toolbox.router.get('https://fonts.googleapis.com/', toolbox.cacheFirst);We can also intercept GET requests to another domain using Express-style routing. We just define an ‘origin’ property in our options (a string or RegExp) which gets matched against the full origin of the URL.
toolbox.router.get('/(.*)', global.toolbox.cacheFirst, {origin: /\.googleapis\.com$/
});
A RegExp object can also be used. Here we’re defining a route for POST requests that start with “https://www.googleapis.com”:
toolbox.router.post(/^https://www.googleapis.com\//, global.toolbox.networkFirst);
Tip: When inspecting Cache Storage, you can differentiate what sw-toolbox is caching as it manages the $$$toolbox-cache$$ namespace.
More granular control
sw-toolbox also gives us the ability to granularly control caching characteristics. In addition to specifying an origin, we can also customize the cache as follows:
We give it a name (“products”)We give it a maximum size of 12 items (using the maxEntries parameter)We set the content to expire in a day (24 hours = 86400 seconds)toolbox.router.get('/(.*)', global.toolbox.cacheFirst, {cache: {
name: 'products',
maxEntries: 12,
maxAgeSeconds: 86400
},
origin: /\.products\.com$/
});
You can find tutorials on sw-precache & sw-toolbox in our Progressive Web Apps Instructor Led training material.
Offline Google AnalyticsAs mentioned earlier, offline Google Analytics can relay analytics requests a user performed offline when a network connection is available again. To add this to your Service Worker involves just two lines of code:
// Import offline analytics into the SW global scope:importScripts('path/to/offline-google-analytics-import.js');// initialize it
goog.offlineGoogleAnalytics.initialize();
Boom. That’s it!
It’s also possible to supply an object with custom parameters that will be included with each request that is replayed:
goog.offlineGoogleAnalytics.initialize({parameterOverrides: {
cd1: 'Guacamole',
cd2: 'So much cheese'
}
});
Note: the main use case for passing in an object of parameter overrides is detecting when hits are sent normally (vs replayed by Service Worker).
Autotrack.jsSetting up Autotrack is relatively straight-forward. In addition to including analytics.js in your page, also async load in the Autotrack library. Next, update your default tracking code to require any Autotrack plugins needed:
window.ga=window.ga||function(){(ga.q=ga.q||[]).push(arguments)};ga.l=+new Date;
ga('create', '', 'auto');// Autotrack plugins availablega('require', 'urlChangeTracker');
ga('require', 'cleanUrlTracker');
ga('require', 'eventTracker');
ga('require', 'maxScrollTracker');
ga('require', 'outboundLinkTracker');
ga('require', 'pageVisibilityTracker');
ga('send', 'pageview');
)
importScripts('https://www.gstatic.com/firebasejs/3.6.10/firebase-messaging.js')
Then initialize the Firebase app in Service Worker. Pass your
messagingSenderId (from Firebase Project Settings) to do so:
'messagingSenderId': ''
});
Next, retrieve an instance of Firebase Messaging to handle background
messages:
and request permission to show notifications. You may want to wait until
an appropriate time to do rather than doing this when the page boots up:
.then(function() {
console.log('Notification permissions granted.');
// ...
})
.catch(function(err) {
console.log('Permission denied', err);
});
Now when the user receives a message from FCM, a notification is displayed
if they granted permission to enable this.
We’re currently working on the next big version of our Service Worker libraries, expanding our explorations to also cover Background Sync, Service-Worker based HiDPI image-switching and smarter analytics for PWAs. We look forward to sharing more as beta releases for these libraries become available.
We’re also planning on a new post over on our Sustainable Loading channel talking about Service Workers in production on Google.com.
Until then, we hope our libraries prove useful, regardless of whether you’re building a PWA or just trying to improve performance on your site :)
With thanks to the awesome members of our team — Jeff Posnick, Matt Gaunt, Taylor Savage, Joe Medley, Prateek Bhatnagar, Lucas Mullens, Phil Walton, Alex Russell and former member Mat Scales for their contributions to our small family of open-source libraries.
ResourcesInstant Loading with Service WorkersGetting started with Firebase Cloud Messaging for WebGreat libraries and tools for great Progressive Web AppsWeb Push Notifications bookInstant Loading: Building offline-first PWAsOffline Google AnalyticsOffline-caching for your static siteBooking.com: PWAs with Service Workers (sw-toolbox)WashingtonPost: AMP up with PWAs (sw-toolbox)Adding PWA support to create-react-app with sw-precacheOffline Angular Apps with Service Workers (sw-precache)
Progressive Web App Libraries in Production was originally published in Dev Channel on Medium, where people are continuing the conversation by highlighting and responding to this story.
February 9, 2017
JavaScript Start-up Performance

As web developers, we know how easy it is to end up with web page bloat. But loading a webpage is much more than shipping bytes down the wire. Once the browser has downloaded our page’s scripts it then has to parse, interpret & run them. In this post, we’ll dive into this phase for JavaScript, why it might be slowing down your app’s start-up & how you can fix it.
Historically, we just haven’t spent a lot of time optimizing for the JavaScript Parse/Compile step. We almost expect scripts to be immediately parsed and executed as soon as the parser hits a Here’s a simplified breakdown of how V8 works
 A simplified view of how V8 works. This is our idealized pipeline that we’re working towards.
Let’s focus on some of the main phases.
What slows our web apps from booting up?Parsing, Compiling and Executing scripts are things a JavaScript engine spends significant time in during start-up. This matters as if it takes a while, it can delay how soon users can interact with our site. Imagine if they can see a button but not click or touch it for multiple seconds. This can degrade the user experience.
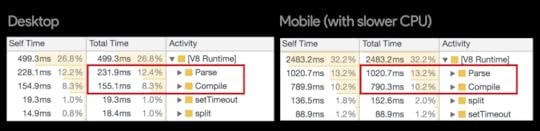 Parse & Compile times for a popular website using V8’s Runtime Call Stats in Chrome Canary. Notice how a slow Parse/Compile on desktop can take far longer on average mobile phones.
Start-up times matter for performance-sensitive code. In fact, V8 - Chrome’s JavaScript engine, spends a large amount of time parsing and compiling scripts on top sites like Facebook, Wikipedia and Reddit:
 The pink area (JavaScript) represents time spent in V8 and Blink’s C++, while the orange and yellow represent parse and compile.
Parse and Compile have also been highlighted as a bottleneck by a number of large sites & frameworks you may be using. Below are tweets from Facebook’s Sebastian Markbage and Google’s Rob Wormald:
body[data-twttr-rendered="true"] {background-color: transparent;}.twitter-tweet {margin: auto !important;}body[data-twttr-rendered="true"] {background-color: transparent;}.twitter-tweet {margin: auto !important;}@swannodette Parse/compile is a huge problem. I'll keep bugging our guys to share numbers. However, the disconnect is what size to measure.
@aerotwist @github my read of the data currently is angular's main startup cost is before we start touching DOM at all, mainly in JS parse.
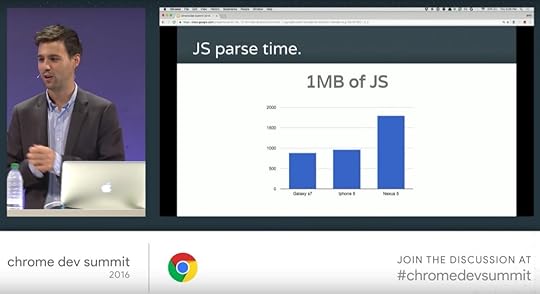 Sam Saccone calls out the cost of JS parse in ‘Planning for Performance’
As we move to an increasingly mobile world, it’s important that we understand the time spent in Parse/Compile can often be 2–5x as long on phones as on desktop. Higher-end phones (e.g the iPhone or Pixel) will perform very differently to a Moto G4. This highlights the importance of us testing on representative hardware (not just high-end!) so our users’ experiences don’t suffer.
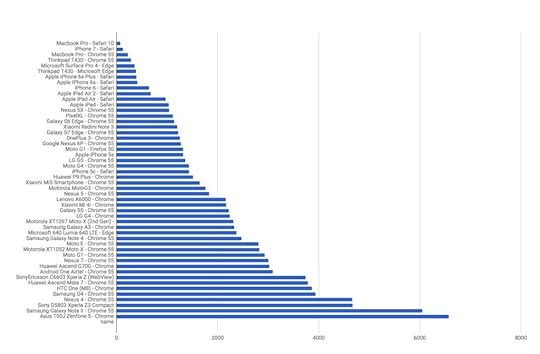 Parse times for a 1MB bundle of JavaScript across desktop & mobile devices of differing classes. Notice how close a high-end phone like an iPhone 7 is to perf on a Macbook Pro vs the performance as we go down the graph towards average mobile hardware.
If we’re shipping huge bundles for our app, this is where endorsing modern bundling techniques like code-splitting, tree-shaking and Service Worker caching can really make a huge difference. That said, even a small bundle, written poorly or with poor library choices can result in the main thread being pegged for a long time in compilation or function call times. It’s important to holistically measure and understand where our real bottlenecks are.
What Are JavaScript Parse & Compile bottlenecks for the average website?“Buuuut, I’m not Facebook”, I hear you say dear, reader. “How heavy are Parse & Compile times for average sites out in the wild?”, you might be asking. Let’s science this out!
I spent two months digging into the performance of a large set of production sites (6000+) built with different libraries and frameworks — like React, Angular, Ember and Vue. Most of the tests were recently redone on WebPageTest so you can easily redo them yourself or dig into the numbers if you wish. Here are some insights.
Apps became interactive in 8 seconds on desktop (using cable) and 16 seconds on mobile (Moto G4 over 3G)

What contributed to this? Most apps spent an average of 4 seconds in start-up (Parse/Compile/Exec)..on desktop.
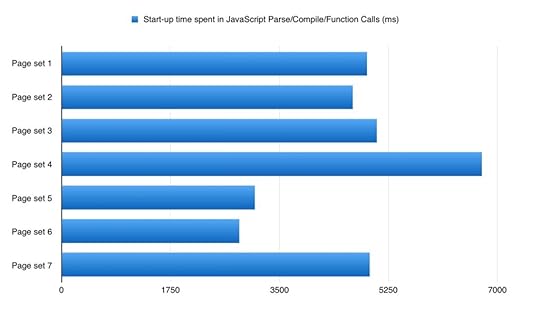
On mobile, parse times were up to 36% higher than they were on desktop.
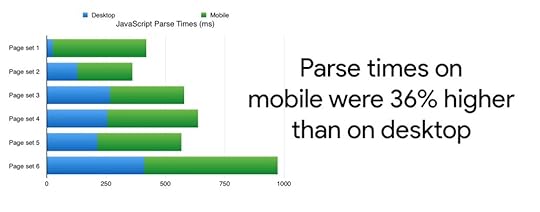
Was everyone shipping huge JS bundles? Not as large as I had guessed, but there’s room for improvement. At the median, developers shipped 410KB of gzipped JS for their pages. This is in line with the 420KB over ‘average JS per page’ reported by the HTTPArchive. The worst offenders were sending anywhere up to 10MB of script down the wire. Oof.
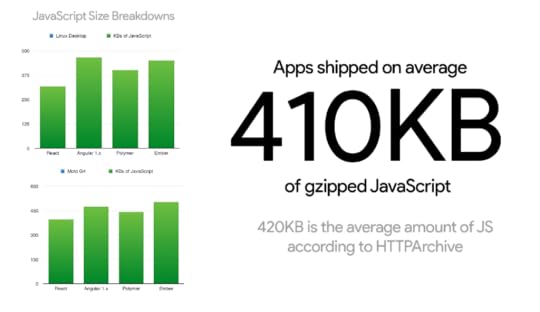 HTTPArchive stat: the average page ships down 420KB of JavaScript
Script size is important, but it isn’t everything. Parse and Compile times don’t necessarily increase linearly when the script size increases. Smaller JavaScript bundles generally do result in a faster load time (regardless of our browser, device & network connection) but 200KB of our JS !== 200KB of someone else’s and can have wildly different parse and compile numbers.
Measuring JavaScript Parse & Compile todayChrome DevTools
Timeline (Performance panel) > Bottom-Up/Call Tree/Event Log will let us drill into the amount of time spent in Parse/Compile. For a more complete picture (like the time spent in Parsing, Preparsing or Lazy Compiling), we can turn on V8’s Runtime Call Stats. In Canary, this will be in Experiments > V8 Runtime Call Stats on Timeline.
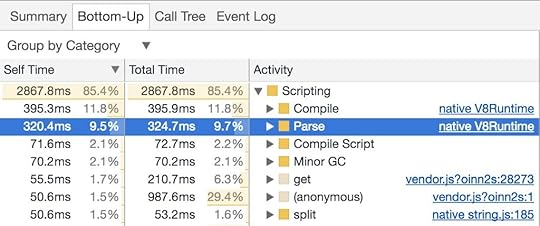
Chrome Tracing
about:tracing — Chrome’s lower-level Tracing tool allows us to use the `disabled-by-default-v8.runtime_stats` category to get deeper insights into where V8 spends its time. V8 have a step-by-step guide on how to use this that was published just the other day.
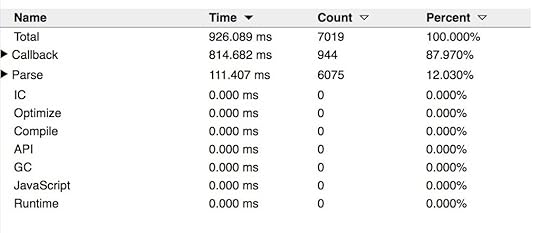
WebPageTest
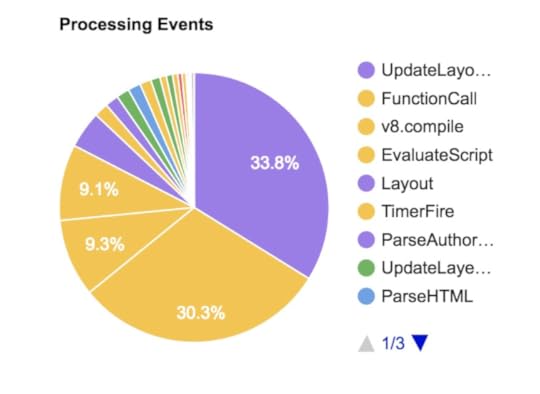
WebPageTest’s “Processing Breakdown” page includes insights into V8 Compile, EvaluateScript and FunctionCall time when we do a trace with the Chrome > Capture Dev Tools Timeline enabled.
We can now also get out the Runtime Call Stats by specifying `disabled-by-default-v8.runtime_stats` as a custom Trace category (Pat Meenan of WPT now does this by default!).

For a guide on how to get the most out of this, see this gist I wrote up.
User Timing
It’s possible to measure Parse times through the User Timing API as Nolan Lawson points out below:
body[data-twttr-rendered="true"] {background-color: transparent;}.twitter-tweet {margin: auto !important;}Measuring this stuff is extremely tricky! In short, this is the error I made:
The third performance.mark()
This approach can be affected on subsequent reloads by V8’s preparser. This could be worked around by appending a random string to the end of the script, something Nolan does in his optimize-js benchmarks.
I use a similar approach for measuring the impact of JavaScript Parse times using Google Analytics:
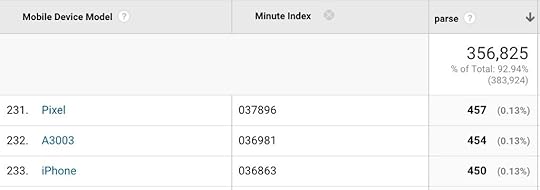 A custom Google Analytics dimension for ‘parse’ allows me to measure JavaScript parse times from real users and devices hitting my pages in the wild.
DeviceTiming
Etsy’s DeviceTiming tool can help measure parse & execution times for scripts in a controlled environment. It works by wrapping local scripts with instrumentation code so that each time our pages are hit from different devices (e.g laptops, phones, tablets) we can locally compare parse/exec. Daniel Espeset’s Benchmarking JS Parsing and Execution on Mobile Devices goes into more detail on this tool.
 What can we do to lower our JavaScript parse times today?Ship less JavaScript. The less script that requires parsing, the lower our overall time spent in the parse & compile phases will be.Use code-splitting to only ship the code a user needs for a route and lazy load the rest. This probably is going to help the most to avoid parsing too much JS. Patterns like PRPL encourage this type of route-based chunking, now used by Flipkart, Housing.com and Twitter.Script streaming: In the past, V8 have told developers to use `async/defer` to opt into script streaming for parse-time improvements of between 10–20%. This allows the HTML parser to at least detect the resource early, push the work to the script streaming thread and not halt the document parsing. Now that this is done for parser-blocking scripts too, I don’t think there’s anything actionable we need to do here. V8 recommend loading larger bundles earlier on as there’s only one streamer thread (more on this later)Measure the parse cost of our dependencies, such as libraries and frameworks. Where possible, switch them out for dependencies with faster parse times (e.g switch React for Preact or Inferno, which require fewer bytes to bootup and have smaller parse/compile times). Paul Lewis covered framework bootup costs in a recent article. As Sebastian Markbage has also noted, a good way to measure start-up costs for frameworks is to first render a view, delete and then render again as this can tell you how it scales. The first render tends to warm up a bunch of lazily compiled code, which a larger tree can benefit from when it scales.
If our JavaScript framework of choice supports an ahead-of-time compilation mode (AoT), this can also help heavily reduce the time spent in parse/compile. Angular apps benefit from this for example:
 Nolan Lawson’s ‘Solving the Web Performance Crisis’What are browsers doing to improve Parse & Compile times today?
Developers are not the only ones to still be catching up on real-world start-up times being an area for improvement. V8 discovered that Octane, one of our more historical benchmarks, was a poor proxy for real-world performance on the 25 popular sites we usually test. Octane can be a poor proxy for 1) JavaScript frameworks (typically code that isn’t mono/polymorphic) and 2) real-page app startup (where most code is cold). These two use-cases are pretty important for the web. That said, Octane isn’t unreasonable for all kinds of workloads.
The V8 team has been hard at work improving start-up time and we’ve already seem some wins here:
body[data-twttr-rendered="true"] {background-color: transparent;}.twitter-tweet {margin: auto !important;}V8 has had a ~25% improvement in JavaScript start-up performance year-on-year. Shifted to focusing more on better perf for real-world apps.
We also estimate a 25% improve on V8 parse times for many pages looking at our Octane-Codeload numbers:
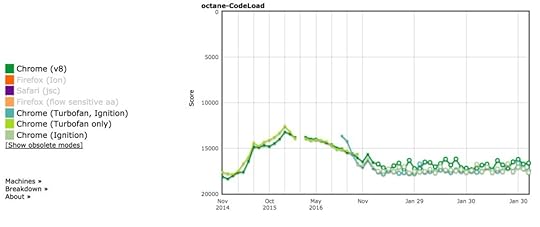
And we’re seeing wins in this area for Pinterest too. There are a number of other explorations V8 has started over the last few years to improve Parsing and Compile times.
Code caching
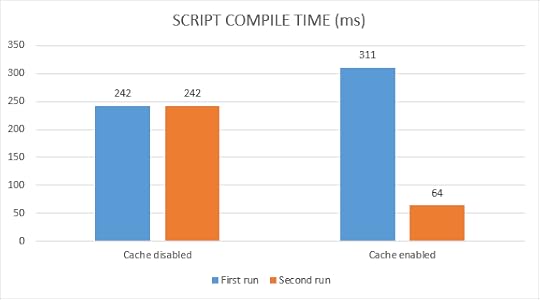 From using V8’s code caching
Chrome 42 introduced code caching — a way to store a local copy of compiled code so that when users returned to the page, steps like script fetching, parsing and compilation could all be skipped. At the time we noted that this change allowed Chrome to avoid about 40% of compilation time on future visits, but I want to provide a little more insight into this feature:
Code caching triggers for scripts that are executed twice in 72 hours.For scripts of Service Worker: Code caching triggers for scripts that are executed twice in 72 hours.For scripts stored in Cache Storage via Service Worker: Code caching triggers for scripts in the first execution.So, yes. If our code is subject to caching V8 will skip parsing and compiling on the third load.
We can play around with these in chrome://flags/#v8-cache-strategies-f... to look at the difference. We can also run Chrome with — js-flags=profile-deserialization to see if items are being loaded from the code cache (these are presented as deserialization events in the log).
One caveat with code caching is that it only caches what’s being eagerly compiled. This is generally only the top-level code that’s run once to setup global values. Function definitions are usually lazily compiled and aren’t always cached. IIFEs (for users of optimize-js ;)) are also included in the V8 code cache as they are also eagerly compiled.
Script Streaming
Script streaming allows async or defer scripts to be parsed on a separate background thread once downloading begins and improves page loading times by up to 10%. As noted earlier, this now also works for sync scripts.
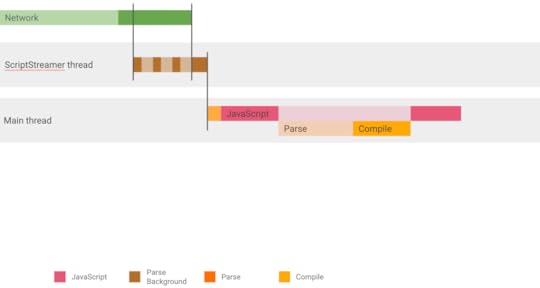
Since the feature was first introduced, V8 have switched over to allowing all scripts, even parser blocking It’s important to measure for any potential wins here.
Practically, so we can discover the resource early and then parse it on the background thread.
It’s also possible to check with DevTools Timeline whether the correct scripts get streamed — if there’s one big script that dominates the parse time, it would make sense to make sure it’s (usually) picked up by the streaming.

Better Parsing & Compiling
Work is ongoing for a slimmer and faster Parser that frees up memory and is more efficient with data structures. Today, the largest cause of main thread jank for V8 is the nonlinear parsing cost. Take a snippet of UMD:
(function (global, module) { … })(this, function module() { my functions })
V8 won’t know that module is definitely needed so we won’t compile it when the main script gets compiled. When we decide to compile module, we need to reparse all of the inner functions. This is what makes V8’s parse-times non-linear. Every function at n-th depth is parsed n times and causes jank.
V8 are already working on collecting info about inner functions during the initial compile, so any future compilations can ignore their inner functions. For module-style functions, this should result in a large perf improvement.
See ‘The V8 Parser(s) — Design, Challenges, and Parsing JavaScript Better’ for the full story.
V8 are also exploring offloading parts of JavaScript compilation to the background during startup.
Precompiling JavaScript?
Every few years, it’s proposed engines offer a way to precompile scripts so we don’t waste time parsing or compiling code pops up. The idea is if instead, a build-time or server-side tool can just generate bytecode, we’d see a large win on start-up time. My opinion is shipping bytecode can increase your load-time (it’s larger) and you would likely need to sign the code and process it for security. V8’s position is for now we think exploring avoiding reparsing internally will help see a decent enough boost that precompilation may not offer too much more, but are always open to discussing ideas that can lead to faster startup times. That said, V8 are exploring being more aggressive at compiling and code-caching scripts when you update a site in a Service Worker and we hope to see some wins with this work.
We discussed precompilation at BlinkOn 7 with Facebook and Akamai and my notes can be found here.
The Optimize JS lazy-parsing parens ‘hack’
JavaScript engines like V8 have a lazy parsing heuristic where they pre-parse most of the functions in our scripts before doing a complete round of parsing (e.g to check for syntax errors). This is based on the idea that most pages have JS functions that are lazily executed if at all.

Pre-parsing can speed up startup times by only checking the minimal a browser needs to know about functions. This breaks down with IIFEs. Although engines try to skip pre-parsing for them, the heuristics aren’t always reliable and this is where tools like optimize-js can be useful.
optimize-js parses our scripts in advance, inserts parenthesis where it knows (or assumes via heuristics) functions will be immediately executed enabling faster execution. Some of the paren-hacked functions are sure bets (e.g IIFEs with !). Others are based on heuristics (e.g in a Browserify or Webpack bundle it’s assumed all modules are eagerly loaded which isn’t necessarily the case). Eventually, V8 hopes for such hacks to not be required but for now this is an optimization we can consider if we know what you’re doing.
V8 are also working on reducing the cost for cases where we guess wrong, and that should also reduce the need for the parens hack
ConclusionsStart-up performance matters. A combination of slow parse, compile and execution times can be a real bottleneck for pages that wish to boot-up quickly. Measure how long your pages spend in this phase. Discover what you can do to make it faster.
We’ll keep working on improving V8 start-up performance from our end as much as we can. We promise ;) Happy perfing!
Read MorePlanning for PerformanceSolving the Web Performance Crisis by Nolan LawsonJS Parse and Execution TimeMeasuring Javascript Parse and LoadUnpacking the Black Box: Benchmarking JS Parsing and Execution on Mobile Devices (slides)When everything’s important, nothing is!The truth about traditional JavaScript benchmarksDo Browsers Parse JavaScript On Every Page LoadWith thanks to V8 (Toon Verwaest, Camillo Bruni, Benedikt Meurer, Marja Hölttä, Seth Thompson), Nolan Lawson (MS Edge), Malte Ubl (AMP), Tim Kadlec (Synk), Gray Norton (Chrome DX), Paul Lewis, Matt Gaunt and Rob Wormald (Angular) and for their reviews of this article.
Update: Thanks to some awesome members of the community, this article is now available in Chinese and Russian too.

JavaScript Start-up Performance was originally published in reloading on Medium, where people are continuing the conversation by highlighting and responding to this story.
December 15, 2016
Webpack Performance Budgets
Webpack 2.2 RC includes support for Performance Budgets — a new feature that will help warn (or optionally error) when the size of your JavaScript bundles may be large enough to impact your user experience. The feature is completely configurable, and we hope it will help you ship faster sites


