
Charles Rotblut's Blog, page 2
June 24, 2011
Money Isn’t Changing Hands Fast Enough
Federal Reserve Chairman Ben Bernanke continues to be the enemy of savers. On Wednesday, the Boston Red Sox fan reiterated his belief that interest rates should be kept at rock-bottom levels for an extended period of time. He views this as necessary in order to keep the economy growing.
Part of Bernanke’s problem has been his inability to accelerate the pace of money movement, or velocity. Velocity is an economic measure of how many times a dollar is used to purchase goods and services. For instance, if I give you a $100 bill and you put it into your dresser, there is no real velocity. However, if you use it to make a repair on your car and then your mechanic spends the cash on buying a replacement part, velocity accelerates. Thus, there are advantages to sustaining a certain level of velocity.
An example more applicable to the current environment is the housing market. The National Association of Realtors reported a 3.8% decline in existing home sales and a 4.6% drop in home prices on Tuesday. A homeowner who cannot sell his house, either because he is underwater on his mortgage or simply can’t find buyers for a price he wants to sell at, has capital that is stationary. He is therefore unlikely to buy someone else’s house, much less spend additional money on items and services often associated with a home purchase. Thus, the capital tied up in the homeowner’s current house is not circulated back into the economy, thereby slowing velocity.
How slow is velocity currently? The chart below, from the St. Louis Federal Reserve Bank, shows the long-term trend in M2 money stock velocity. (This is the ratio of quarterly nominal GDP to the quarterly average of M2 money stock. M2 is a broad set of financial assets, including cash held outside of depository institutions, savings deposits, and money market accounts. Nominal GDP is economic growth that has not been adjusted for the impact of inflation.) The gray bars show when recessions have occurred.
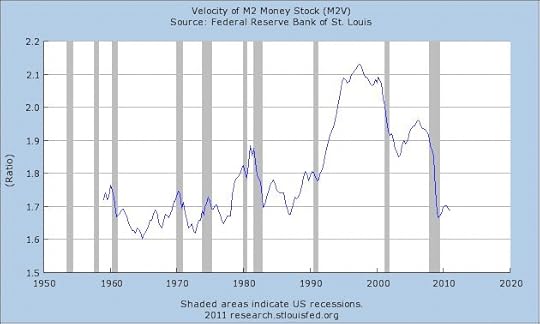
As you can see, velocity is at historically low levels. Velocity is, however, just one snapshot of the economy and not a sole indicator you should rely on. However, when you factor in other signposts, a picture of money not changing enough hands is formed. For example, economist Lawrence Yun complained about “overly restrictive loan underwriting standards” in the National Association of Realtors’ existing home sales press release. At the same time, U.S. corporations remain apprehensive about spending money, particularly when it comes to hiring, despite having large cash balances.
In simplistic terms, Bernanke’s hope is that if money is both cheap and accessible, velocity will eventually increase, thereby spurring growth. The short-term downside of his policy is that bond rates are staying at historically low levels. The long-term danger is that inflation will jump, forcing the Federal Reserve to hike up interest rates. Though the fed Chairman’s margin for error is large and he has many detractors, we still don’t know what the actual end result will be. Many of you have assumptions, but the future is rarely what we expect it to be.
Excerpted from my weekly AAII Investor Update email. For more information about the American Association of Individual Investors, visit www.aaii.com


Money Isn't Changing Hands Fast Enough
Federal Reserve Chairman Ben Bernanke continues to be the enemy of savers. On Wednesday, the Boston Red Sox fan reiterated his belief that interest rates should be kept at rock-bottom levels for an extended period of time. He views this as necessary in order to keep the economy growing.
Part of Bernanke's problem has been his inability to accelerate the pace of money movement, or velocity. Velocity is an economic measure of how many times a dollar is used to purchase goods and services. For instance, if I give you a $100 bill and you put it into your dresser, there is no real velocity. However, if you use it to make a repair on your car and then your mechanic spends the cash on buying a replacement part, velocity accelerates. Thus, there are advantages to sustaining a certain level of velocity.
An example more applicable to the current environment is the housing market. The National Association of Realtors reported a 3.8% decline in existing home sales and a 4.6% drop in home prices on Tuesday. A homeowner who cannot sell his house, either because he is underwater on his mortgage or simply can't find buyers for a price he wants to sell at, has capital that is stationary. He is therefore unlikely to buy someone else's house, much less spend additional money on items and services often associated with a home purchase. Thus, the capital tied up in the homeowner's current house is not circulated back into the economy, thereby slowing velocity.
How slow is velocity currently? The chart below, from the St. Louis Federal Reserve Bank, shows the long-term trend in M2 money stock velocity. (This is the ratio of quarterly nominal GDP to the quarterly average of M2 money stock. M2 is a broad set of financial assets, including cash held outside of depository institutions, savings deposits, and money market accounts. Nominal GDP is economic growth that has not been adjusted for the impact of inflation.) The gray bars show when recessions have occurred.

As you can see, velocity is at historically low levels. Velocity is, however, just one snapshot of the economy and not a sole indicator you should rely on. However, when you factor in other signposts, a picture of money not changing enough hands is formed. For example, economist Lawrence Yun complained about "overly restrictive loan underwriting standards" in the National Association of Realtors' existing home sales press release. At the same time, U.S. corporations remain apprehensive about spending money, particularly when it comes to hiring, despite having large cash balances.
In simplistic terms, Bernanke's hope is that if money is both cheap and accessible, velocity will eventually increase, thereby spurring growth. The short-term downside of his policy is that bond rates are staying at historically low levels. The long-term danger is that inflation will jump, forcing the Federal Reserve to hike up interest rates. Though the fed Chairman's margin for error is large and he has many detractors, we still don't know what the actual end result will be. Many of you have assumptions, but the future is rarely what we expect it to be.
Excerpted from my weekly AAII Investor Update email. For more information about the American Association of Individual Investors, visit www.aaii.com


June 17, 2011
Avoid Companies Where You Can’t Assess the Risk
An accounting scandal is the last thing investors need right now given the ongoing market correction, but one made did make the headlines this week. Sino-Forest (SNOFF), a company accused of falsifying financial statements, apparently dodged questions about its books during a conference call on Tuesday.
I have no knowledge about the validity of the allegations. I can tell you, however, that the U.S. Securities and Exchange Commission (SEC) recently issued a bulletin warning investors about companies accessing the U.S. markets via reverse mergers. This bulletin followed sanctions filed against Heli Electronics Corp. (HELI), China Changjiang Mining & New Energy Co (CHJI), RINO International Corporation (RINO) and others. (I’ll explain more in the July issue of the AAII Journal, which we sent to the printer today.)
Often, where there is smoke, there is fire. Sometimes, however, it’s just smoke. While there is certainly money to be made for those who can tell the difference, the risks of being incorrect are very high. AAII founder James Cloonan has purposely kept Chinese reverse merger stocks out of the Shadow Stock Portfolio because the risks far outweigh the potential rewards.
It’s not just these specific companies. At the Morningstar Investor Conference last week, emerging market fund managers emphasized the importance of corporate governance when investing overseas. One manager singled out Russia, explaining that he has no idea how to invest in a market where the government can essentially take over a company simply because it doesn’t like the CEO.
In the U.S., there are industries that have regulatory problems. Though not anywhere on the same scale as accounting fraud or autocratic governments, regulatory problems are still unpredictable and can lead to sharp drops in a stock’s price.
An example are for-profit education companies, which I have ignored when they have appeared on my risk/reward stock screen. [DeVry (DV) is currently among the passing companies.] My aversion comes from the fact that before the recent brouhaha over student loans, there were issues with enrollment practices. Perhaps the regulatory problems are passing, but with thousands of other stocks to choose from, I’d rather put my research efforts-and my money-elsewhere.
Given the market’s performance as of late, I certainly don’t need to remind you that stocks can be risky even when there is no alleged scandal. This is why you always need to consider your ability to assess a company’s risks. If you can make a reasonable assessment, then you can figure out whether the potential for reward justifies buying the security. If you can’t, it is better to find another investment.
To be clear, in order to make money in the stock market, you have to accept some level of risk. There will always be events that you can’t predict. However, if you know there is a past record of nefarious actions, either involving the company or its peers, then you should ask whether the risks are simply too high.
On the Lighter Side…
Among the investment ideas given by the emerging market fund managers at last week’s conference was alcohol. One manager quipped, ?When people gain wealth, the first thing they do is buy better booze.?
Among the “sin” stocks mentioned were Carlsberg, Pernod Ricard and Diageo (DEO). The first two are not listed on U.S. exchanges, but Diageo is. I happen to run a separate beer stock screen and have looked at DEO before. (Diageo’s brands include Guinness, Kilkenny and Red Stripe.) The stock yields a 2.5% dividend, but also trades at a premium price-to-book multiple because of the company’s high debt level.
On Tuesday, the editors of The Wall Street Journal’s MarketBeat blog noted the recent launch of the IQ U.S. Real Estate Small Cap ETF, which trades under the ticker ROOF. If that pun was not enough for you, Marketbeat also noted the existence of funds trading under the tickers BARN, MOO, MINT and SOIL. (I promise that I will refrain from talking about beefing up your portfolio with shares of COW.)
This Week’s Gratis Tip
One of the indicators that can alert you to potential problems with a company is inventory turnover. An unexpected change may mean orders are slowing or the company is having difficulty obtaining adequate supplies to meet demand. “Stock” Supply Data: Inventory Turnover shows you a simple method for analyzing inventory levels.
The Week Ahead
Nearly 20 members of the S&P 500 will report earnings, giving us the first glimpse of second-quarter profits. Among the more notable names are Adobe Systems (ADBE) and Walgreen (WAG) on Tuesday, Bed Bath & Beyond (BBBY) and FedEx (FDX) on Wednesday, and Oracle (ORCL) and Discover Financial Services (DFS) on Thursday.
The Federal Reserve will hold a two-day meeting starting on Tuesday. Bond expert Bill Gross of PIMCO tweeted that the meeting’s statement “will likely stress ‘extended period of time’ language or even a period of interest rate caps.” (In other words, Gross thinks the Fed will emphasize its desire to keep interest rates at record low levels for the foreseeable future.) The statement will be published on Wednesday afternoon at 12:30 p.m Eastern time and Fed Chairman Ben Bernanke will hold a press conference at 2:15 p.m. Eastern time.
The week’s first economic report will be May existing home sales, which is scheduled for release on Tuesday. May new home sales data will be published on Thursday. Friday will feature May durable goods orders and the final revision to first-quarter GDP.
Excerpted from my weekly AAII Investor Update email. For more information about the American Association of Individual Investors, visit www.aaii.com


Avoid Companies Where You Can't Assess the Risk
An accounting scandal is the last thing investors need right now given the ongoing market correction, but one made did make the headlines this week. Sino-Forest (SNOFF), a company accused of falsifying financial statements, apparently dodged questions about its books during a conference call on Tuesday.
I have no knowledge about the validity of the allegations. I can tell you, however, that the U.S. Securities and Exchange Commission (SEC) recently issued a bulletin warning investors about companies accessing the U.S. markets via reverse mergers. This bulletin followed sanctions filed against Heli Electronics Corp. (HELI), China Changjiang Mining & New Energy Co (CHJI), RINO International Corporation (RINO) and others. (I'll explain more in the July issue of the AAII Journal, which we sent to the printer today.)
Often, where there is smoke, there is fire. Sometimes, however, it's just smoke. While there is certainly money to be made for those who can tell the difference, the risks of being incorrect are very high. AAII founder James Cloonan has purposely kept Chinese reverse merger stocks out of the Shadow Stock Portfolio because the risks far outweigh the potential rewards.
It's not just these specific companies. At the Morningstar Investor Conference last week, emerging market fund managers emphasized the importance of corporate governance when investing overseas. One manager singled out Russia, explaining that he has no idea how to invest in a market where the government can essentially take over a company simply because it doesn't like the CEO.
In the U.S., there are industries that have regulatory problems. Though not anywhere on the same scale as accounting fraud or autocratic governments, regulatory problems are still unpredictable and can lead to sharp drops in a stock's price.
An example are for-profit education companies, which I have ignored when they have appeared on my risk/reward stock screen. [DeVry (DV) is currently among the passing companies.] My aversion comes from the fact that before the recent brouhaha over student loans, there were issues with enrollment practices. Perhaps the regulatory problems are passing, but with thousands of other stocks to choose from, I'd rather put my research efforts-and my money-elsewhere.
Given the market's performance as of late, I certainly don't need to remind you that stocks can be risky even when there is no alleged scandal. This is why you always need to consider your ability to assess a company's risks. If you can make a reasonable assessment, then you can figure out whether the potential for reward justifies buying the security. If you can't, it is better to find another investment.
To be clear, in order to make money in the stock market, you have to accept some level of risk. There will always be events that you can't predict. However, if you know there is a past record of nefarious actions, either involving the company or its peers, then you should ask whether the risks are simply too high.
On the Lighter Side…
Among the investment ideas given by the emerging market fund managers at last week's conference was alcohol. One manager quipped, ?When people gain wealth, the first thing they do is buy better booze.?
Among the "sin" stocks mentioned were Carlsberg, Pernod Ricard and Diageo (DEO). The first two are not listed on U.S. exchanges, but Diageo is. I happen to run a separate beer stock screen and have looked at DEO before. (Diageo's brands include Guinness, Kilkenny and Red Stripe.) The stock yields a 2.5% dividend, but also trades at a premium price-to-book multiple because of the company's high debt level.
On Tuesday, the editors of The Wall Street Journal's MarketBeat blog noted the recent launch of the IQ U.S. Real Estate Small Cap ETF, which trades under the ticker ROOF. If that pun was not enough for you, Marketbeat also noted the existence of funds trading under the tickers BARN, MOO, MINT and SOIL. (I promise that I will refrain from talking about beefing up your portfolio with shares of COW.)
This Week's Gratis Tip
One of the indicators that can alert you to potential problems with a company is inventory turnover. An unexpected change may mean orders are slowing or the company is having difficulty obtaining adequate supplies to meet demand. "Stock" Supply Data: Inventory Turnover shows you a simple method for analyzing inventory levels.
The Week Ahead
Nearly 20 members of the S&P 500 will report earnings, giving us the first glimpse of second-quarter profits. Among the more notable names are Adobe Systems (ADBE) and Walgreen (WAG) on Tuesday, Bed Bath & Beyond (BBBY) and FedEx (FDX) on Wednesday, and Oracle (ORCL) and Discover Financial Services (DFS) on Thursday.
The Federal Reserve will hold a two-day meeting starting on Tuesday. Bond expert Bill Gross of PIMCO tweeted that the meeting's statement "will likely stress 'extended period of time' language or even a period of interest rate caps." (In other words, Gross thinks the Fed will emphasize its desire to keep interest rates at record low levels for the foreseeable future.) The statement will be published on Wednesday afternoon at 12:30 p.m Eastern time and Fed Chairman Ben Bernanke will hold a press conference at 2:15 p.m. Eastern time.
The week's first economic report will be May existing home sales, which is scheduled for release on Tuesday. May new home sales data will be published on Thursday. Friday will feature May durable goods orders and the final revision to first-quarter GDP.
Excerpted from my weekly AAII Investor Update email. For more information about the American Association of Individual Investors, visit www.aaii.com


June 10, 2011
Is the Market’s Slump A Concern?
U.S. stocks have been slumping, losing ground for five consecutive weeks. This week remains up for grabs between the bulls and the bears, but the short-term losses are in the books.
On the surface, five consecutive down weeks sounds bad. Okay, it sounds real bad. In percentage terms, however, the S&P 500 is only down 5.5%, which does not even qualify as a correction. In fact, it’s more of a normal fluctuation than anything else. The market is finicky, and on any given day it will offer you a different price for your securities than the day before or after.
Obviously, the bigger concern is whether the stock market is starting to adjust for a slower rate of economic growth. The number of jobs added last month was worse than the most pessimistic forecast tabulated by Econoday, which tracks economic information. Several other indicators are also pointing to slower growth, including the ISM manufacturing survey, the S&P/Case-Schiller home price index and the Conference Board’s leading indicator index.
Economists are acting as if the pace of growth has slowed, and many have cut their full-year consensus forecasts in response. Ahead of last week’s jobs report, the Blue Chip Economic Indicators survey showed the consensus forecast for U.S. GDP growth declining to 2.7%, from 2.9% in April. Ironically, stock analysts continue to be upbeat, with the Thomson Reuters’ consensus earnings estimate for the S&P 500 now projecting 16.9% growth, up from 14.6% at the start of April.
In his weekly commentary, Sam Stovall of Standard & Poor’s said he has found that “stock investors act more on faith than fundamentals (and therefore remind me of
Billy Graham more than Ben Graham) as they don’t wait for the reports to confirm their expectations.” The recent pullback in stocks suggests that some investors have made a leap of faith that the economists are right and the analysts are wrong. That does not mean that the economy will actually slow enough to drag year-end stock prices down, however. Traders may be quick to buy and sell, but that does not make their calls correct. Furthermore, acting IMF chief John Lipsky told Reuters earlier this week that current policies are “consistent with a return to moderate growth” and that he anticipates the current slowdown will prove to be temporary.
It is important to realize that we are in a seasonally weak period for stocks. As I noted two weeks ago, June is the second-worst month for the Dow Jones industrial average and the third-worst month for the S&P 500. It is no friend to small-cap stocks either, ranking as the fourth-worst month for the Russell 2000, according to the Stock Trader’s Almanac. Despite this bad reputation, June tends to be essentially unchanged on average. (The Stock Trader’s Almanac does note, however, that pre-election-year Junes tend to have 1% to 2% gains, depending on the index—so like Chicago Cubs fans, we can have hope.)
Given that Washington has yet to agree on a resolution for dealing with the debt ceiling and the uneven pace of economic growth, it would not surprise me to see more choppiness in the market, especially as we approach the August deadline for raising the federal debt ceiling. The volatility may be frustrating, but over the long term, stocks compensate you for putting up with the market’s finickiness. What’s important is to focus on the current valuation of your holdings, not whether they were priced somewhat higher or lower a few weeks ago. A fundamentally sound company with good prospects that is trading at an attractive valuation is a good bargain, regardless of the mood the market is in.
Excerpted from my weekly AAII Investor Update email. For more information about the American Association of Individual Investors, visit www.aaii.com


Is the Market's Slump A Concern?
U.S. stocks have been slumping, losing ground for five consecutive weeks. This week remains up for grabs between the bulls and the bears, but the short-term losses are in the books.
On the surface, five consecutive down weeks sounds bad. Okay, it sounds real bad. In percentage terms, however, the S&P 500 is only down 5.5%, which does not even qualify as a correction. In fact, it's more of a normal fluctuation than anything else. The market is finicky, and on any given day it will offer you a different price for your securities than the day before or after.
Obviously, the bigger concern is whether the stock market is starting to adjust for a slower rate of economic growth. The number of jobs added last month was worse than the most pessimistic forecast tabulated by Econoday, which tracks economic information. Several other indicators are also pointing to slower growth, including the ISM manufacturing survey, the S&P/Case-Schiller home price index and the Conference Board's leading indicator index.
Economists are acting as if the pace of growth has slowed, and many have cut their full-year consensus forecasts in response. Ahead of last week's jobs report, the Blue Chip Economic Indicators survey showed the consensus forecast for U.S. GDP growth declining to 2.7%, from 2.9% in April. Ironically, stock analysts continue to be upbeat, with the Thomson Reuters' consensus earnings estimate for the S&P 500 now projecting 16.9% growth, up from 14.6% at the start of April.
In his weekly commentary, Sam Stovall of Standard & Poor's said he has found that "stock investors act more on faith than fundamentals (and therefore remind me of
Billy Graham more than Ben Graham) as they don't wait for the reports to confirm their expectations." The recent pullback in stocks suggests that some investors have made a leap of faith that the economists are right and the analysts are wrong. That does not mean that the economy will actually slow enough to drag year-end stock prices down, however. Traders may be quick to buy and sell, but that does not make their calls correct. Furthermore, acting IMF chief John Lipsky told Reuters earlier this week that current policies are "consistent with a return to moderate growth" and that he anticipates the current slowdown will prove to be temporary.
It is important to realize that we are in a seasonally weak period for stocks. As I noted two weeks ago, June is the second-worst month for the Dow Jones industrial average and the third-worst month for the S&P 500. It is no friend to small-cap stocks either, ranking as the fourth-worst month for the Russell 2000, according to the Stock Trader's Almanac. Despite this bad reputation, June tends to be essentially unchanged on average. (The Stock Trader's Almanac does note, however, that pre-election-year Junes tend to have 1% to 2% gains, depending on the index—so like Chicago Cubs fans, we can have hope.)
Given that Washington has yet to agree on a resolution for dealing with the debt ceiling and the uneven pace of economic growth, it would not surprise me to see more choppiness in the market, especially as we approach the August deadline for raising the federal debt ceiling. The volatility may be frustrating, but over the long term, stocks compensate you for putting up with the market's finickiness. What's important is to focus on the current valuation of your holdings, not whether they were priced somewhat higher or lower a few weeks ago. A fundamentally sound company with good prospects that is trading at an attractive valuation is a good bargain, regardless of the mood the market is in.
Excerpted from my weekly AAII Investor Update email. For more information about the American Association of Individual Investors, visit www.aaii.com


June 3, 2011
Not Enough Diversification from Long-Term Treasuries
Ten-year Treasury notes may not be giving you enough comparative diversification benefits to justify their potential downside risk. Though long-term Treasuries have historically had low correlation coefficients with large-cap stocks, intermediate-term Treasuries are even less correlated with large-cap stocks.
I want to clearly state that is not an argument against holding Treasuries, even though yields on the benchmark 10-year note fell below 3% yesterday. Rather, it is about finding a proper balance between risk and reward.
Bonds are a form of a loan. The most common types of bonds pay a set percentage of interest over a specified period of time, referred to as the coupon rate. At maturity, the face, ("par") value of the bond is returned. Since the coupon rate does not change, bonds with longer maturities are more sensitive to interest rate changes than those with shorter maturities. All things being equal, an investor would rather not hold a bond with a low coupon rate when new bonds are being issued at higher coupon rates. This is why bond prices fall when interest rates rise, and why bond prices rise when interest rates fall.
You can see this relationship by watching changes in yield. Yield factors in both the interest rate paid by the bond and the actual price of the bond. It is a measure of the total cash flows you will receive by holding the bond to maturity.
In an environment where interest rates are projected to stay stable or fall over the next several years, long-term bonds have an appeal. An investor can lock in a comparatively good interest rate now. Unfortunately, given that yields on the 10-year Treasury note fell below 3% yesterday and the latest issuance of the benchmark note had a coupon that was not much higher, history suggests rates are likely to rise in the future. (The consensus view also calls for higher interest rates; when rates will actually rise and by how much are the big unknowns.)
In such an environment, the allocation benefit of long-term Treasuries may not be comparatively beneficial. According to the Ibbotson SBBI 2011 Yearbook, long-term Treasuries have a correlation coefficient of 0.11 to large-cap stocks. This means that long-term Treasuries have very different return characteristics than the S&P 500; not opposite, but different. (The closer a correlation coefficient gets to zero, the greater the diversification benefit. A correlation coefficient of +1.0 means returns should move in lockstep, whereas a correlation coefficient of -1.0 means returns are mirror opposites.)
Combining long-term Treasuries with large-cap stocks does provide diversification benefits. However, intermediate-term Treasuries have a correlation coefficient of 0.08. In other words, they are less correlated to large-cap stocks than long-term Treasuries are. This means you can get improved diversification with less interest rate risk. (In case you're wondering, long-term corporate bonds have a correlation of 0.23 with large-cap stocks. The Ibbotson SBBI Yearbook uses a 20-year maturity for calculating long-term Treasury and corporate bond returns and a five-year maturity for intermediate-term Treasury returns.)
Diversification is just one consideration, however. Bonds do provide regular income and, depending on your needs, holding a longer-term bond may still make a lot of sense. You should consider the coupon rate paid by your bond, which may be higher than the yields currently quoted for Treasuries. Furthermore, bonds give you a return of investment, whereas stocks merely provide a return on investment. Finally, you can offset the interest rate risk by combining short-term bonds with your long-term bond holdings (a strategy referred to as a creating a "barbell"). If you own bond funds, you can either opt for funds with shorter durations or create a fund barbell by mixing long-term and short-term bond funds.
Excerpted from my weekly AAII Investor Update email. For more information about the American Association of Individual Investors, visit www.aaii.com


May 26, 2011
Diversifying Away From Stocks and Bonds
What diversification options are there beyond stocks, bonds and commodities? A member recently asked me this question. Here is an expanded version of the answer I sent him.
Not all stocks and bonds move in sync with one another, and making sure your holdings in both are properly diversified is the best place to start. If you have never given thought to your stock and bond allocations, you need to adjust these before moving on to other asset classes. Even if you have paid attention to your allocations in the past, review your portfolio annually (or every six months) to ensure the percentage invested in these two asset classes makes sense given your goals and tolerance for risk. (AAII members have access to asset allocation models that show suggested diversification strategies.)
Stocks – Simply splitting your holdings between U.S. large-cap, U.S. small-cap, developed international market and emerging market stocks gives diversification benefits. Though correlations (the extent to which different assets move in sync with one another) become closer during financial crises, they move apart during periods of recovery. Over the long term, each of these stock categories will generate different types of returns.
Bonds – Though the outlook for interest rates is uncertain, bonds continue to play an important role in your portfolio, since they provide both income and return on capital. Diversification can be achieved by holding a variety of U.S. government, corporate and foreign bonds. If you are worried about inflation, shorten the duration of your holdings, which will reduce the sensitivity of the portfolio to interest rate changes. (My bond funds have average durations of between four and five years.)
REITs – Real estate investment trusts provide a stream of income as well property ownership. They are sensitive to interest rate changes, but are more correlated with stocks than bonds. Keep in mind that if you own a house, you are already invested in residential real estate. If you have a mortgage, you're investing in residential real estate on margin. Thus, a REIT focused on commercial real estate may make more sense.
Master Limited Partnerships – MLPs are mostly involved in the oil and natural gas pipeline business. They have a unique structure that results in them paying relatively high yields, but MLPs tend to be more correlated with stocks. MLPs come with potential tax issues and their distributions must be monitored when they are held within an IRA.
Preferred Stock – This is a hybrid security that offers a stream of dividend payments and limited voting rights, but is sensitive to interest rates and should be monitored for credit quality. This is why preferred stocks share return characteristics with both stocks and bonds. In a portfolio, they would be funded with some money that would otherwise be allocated to stocks and some money that would otherwise be allocated to bonds.
Annuities – These are contracts that return a stream of income over a certain period of time. The advantage is that they can guarantee you a minimum level of return. The disadvantage is that they can be complicated, have high comparative costs and offer limited upside, especially compared to the potential returns realized by investing in stocks. When used properly, annuities can offer financial security and can offset part of your bond holdings.
Precious Metals – Gold's value has historically been inversely correlated to currency valuations over long periods of time. Over shorter periods, it is influenced by shifts in sentiment. Precious metals are a hedge for your portfolio that is unlikely to create wealth unless your timing is really good. An ETF can remove many of the headaches (including the threat of theft) associated with buying and storing gold and other precious metals. Arguments can be made to use both stock and bond dollars to buy precious metals; if pushed, I would suggest allocating to gold from your stock holdings given the lack of cash flow.
Commodities – A basket of commodities, including precious metals, energy (e.g., oil) and agricultural goods (e.g., wheat) provides a hedge against inflation. It also lowers the volatility of a portfolio holding only stocks. Commodities are subject to sharp swings in volatility. Futures contracts are used to invest in these (accessible via mutual funds and ETFs), but come with an additional level of risk and complication. If used, 10% to 15% of the money invested in stocks should be shifted to commodities.
Hedge Fund Strategies – A growing number of mutual funds and ETFs follow strategies designed to mimic those used by hedge funds. These can provide different returns than you would otherwise get in a more traditional investment. The downsides are that you will be paying higher fees, the strategies can be complex, and they are risky by themselves. The suggested allocations discussed at a Morningstar conference on alternative investments that I attended on Tuesday ranged from 0% to 25% of portfolio dollars (funded from both stock and bond allocations), with 15% used as a benchmark. One fund manager said that anyone who does not fully understand the strategy being used should avoid hedge funds and any investments that mimic them. This is good advice that applies to any investment offering.
Currencies – Foreign currencies can help protect your portfolio against fluctuations in the U.S. dollar. They are volatile, and an individual investor is pitted against traders with access to economists and offices staffed 24 hours a day. (Foreign currency exposure can also be obtained by investing in foreign bonds.) From an allocation standpoint, use portfolio dollars from both stocks and bonds if you are holding a currency fund for an extended of period of time and from stocks if you are going to trade currencies actively (which I do not recommend).
The Role of Cash
The one asset class not mentioned above is cash. Cash and its equivalents (money market funds, CDs, Treasury bills, etc.) give you both safety and flexibility. The primary advantage of holding onto cash is having the ability to pay for unexpected expenses and take advantage of new, attractive investment opportunities when they appear. The downside is that inflation erodes your purchasing power. (Remember when putting $5 in the gas tank actually allowed you to drive somewhere?)
Excerpted from my weekly AAII Investor Update email. For more information about the American Association of Individual Investors, visit www.aaii.com


May 6, 2011
Lessons From the Flash Crash
Today marks the first anniversary of the flash crash. During the afternoon of May 6, 2010, U.S. stock prices plunged in a matter of minutes. The sudden downward move caused stop orders for many stocks to be executed, leaving some shareholders with unanticipated losses or realized capital gains. The events of that afternoon brought to the surface a few important points for individual investors.
The first is the involvement of high-frequency trading firms. Though their existence was known to professional traders and money managers, these firms were not in the public spotlight. Their ability to trade quickly has increased the speed at which breaking news is priced into the market. This arguably makes the market more efficient, especially for securities with higher levels of trading volume. It also makes day trading even more risky for individual investors than it previously was.
A second point is that how you place an order matters greatly. Investors who had standing orders to sell a stock or exchange-traded fund (ETF) if it fell below a certain price learned the risks of such orders on May 6, 2010. As Chris Nagy of TD Ameritrade explains in the new issue of the AAII Journal, a stop order turns into a market order once triggered if more specific instructions are not given. During the flash crash, prices fell rapidly and many orders were executed at what turned out to be artificially low prices. (Some of the trades were later cancelled.)
An alternative to a plain stop order is a stop-limit order, which includes a minimum price at which you want to sell the stock. This is not without risk either, as a stock could fall below the minimum price you want to sell at without your order being executed. Put options (a contract to sell the stock at a future date) lock in a sell price, but increase costs, especially since they expire worthless if not executed.
As you can see, even actions intended to provide downside protection to your portfolio are not without risk. Therefore, you need to weigh your desire to sell a stock or ETF as soon as the price drops to a certain point versus your willingness to wait until you are able access your account and asses the price action and news. (Investors who did not place stop orders saw their portfolios mostly unaffected by the flash crash.) If you do use stop orders, consider that events like the flash crash are rare.
The third point is that technology is a double-edged sword. Electronic trading has shortened settlement times, lowered bid-ask prices for frequently traded stocks, reduced brokerage costs and improved the flow of information. On the other hand, the stock and futures markets are now more interconnected, which means fluctuations in one market can influence the other market. Furthermore, when something does go haywire, the speed at which traders react is vastly accelerated. It is difficult for regulators to keep up with technological and market changes, especially since problems can be unforeseen, as was the case with the flash crash.
Regulators have been taking steps to prevent another flash crash from occurring. The latest idea is a proposal to institute a "limit up-limit down" system that would pause trading in stocks that move beyond a band based on transaction prices for the previous five-minute period. As I said last month, I think this should help, though any new regulation always has the potential for unintended consequences.
It is important to note that the markets do function normally the overwhelming majority of the time. There will always be systematic risks (the chance of losing money by simply participating in the financial markets), whether due to market gyrations or other, very infrequent events such as the flash crash. However, there is also a risk to not investing at all.
Excerpted from my weekly AAII Investor Update email. For more information about the American Association of Individual Investors, visit www.aaii.com


April 15, 2011
Bond Investors Are Taking On More Risk
Inflation and speculation about what the Fed's next move will be are prominent in headlines about the bond market, but there are also scattered reports that show an increased tolerance for risk among bond investors.
One recent example is payment-in-kind toggle notes, or PIK toggles. These are notes that allow borrowers to issue additional debt securities in lieu of paying cash for interest payments. In other words, if an issuer does not have the cash for the next coupon payment, bondholders will receive more debt. Think about it as a loan that is being repaid with a promissory note to pay you even more back at a later date. As Dow Jones Newswires reported last week, a $600 million offering from Aramark Holdings Corporation tied for the biggest PIK toggles offering since the start of 2010.
It's not just PIK notes. A few weeks ago, I sold my shares in PIMCO Corporate Opportunity (PTY) because the high-yield closed-end fund was trading at a 25% premium to its underlying net asset value. I realize this fund operates under the watchful eye of famed bond investor Bill Gross, but a 25% premium is a steep price to pay. Bluntly put, somebody was willing to pay $1.25 per dollar of assets just to own a high-yield fund. (A quick side note: If you invest in closed-end funds, pay attention to the net asset value (NAV) before you buy the fund and while you own it.)
These events follow anecdotal reports I saw last year about issuers trying to ease the covenants, or loan requirements, placed in their debt offerings. The inherent problem with viewing scattered reports and data is that they can lead to a misperception of what is actually occurring. To confirm my viewpoints on the bond markets, I called Guy LeBas, the chief fixed-income strategist at Janney Montgomery Scott.
Guy told me that the demand for high-yield debt is a function of the improving economy, declining returns for the debt market, and the fact that the weakest issuers were effectively shaken out by the last recession. He further pointed out that some bond investors are viewing credit risk (the chances of a company defaulting on its debt) as less of a concern than interest rate risk (the chances of interest rates rising).
The trade-off between higher portfolio income and wealth preservation is one that many AAII members face. Substituting dividend-yielding stocks for bonds doesn't solve this problem, because a correction or a bear market will drag down dividend-yielding stocks. Suffice it to say, those of you who depend on portfolio income don't have great options to choose from. (Believe me, I wish could I tell you otherwise.)
The best strategy is simply to diversify your bond holdings while paying attention to the quality of what you are investing in. Seek out bonds, both government and corporate, with varying maturity dates and yields. Also, consider using funds to get overseas fixed-income exposure. Most importantly, just realize that, although the uncertainty about future interest rates is disconcerting, no one knows with certainty when the Federal Reserve will start to raise rates or by how much.
Get to Know Bond Ladders
An effective way of managing a fixed-income portfolio for an uncertain interest rate environment is to ladder bonds. The terminology refers to combining bonds with different maturity dates within the same portfolio. This allows you to maintain an exposure to bonds and remove the risk of incorrectly timing the market. As bonds mature, you simply reinvest the proceeds into new bonds at the then-prevailing interest rates.
If you own fixed-income funds instead of individual bonds, you won't be able to build a true ladder. What you could do, however, is combine funds with different durations. Since duration is a measure of interest rate sensitivity, one easy way to go about this is to look for a mixture of short-term, intermediate-term and long-term bond funds.
Know Your Bond Yields, As Well
Bond yields and returns can get pretty complicated very fast. For example, coupon yield, current yield and yield-to-maturity each have precise meanings. The Ins and Outs of Bond Yield provides a clear explanation of these differences and how to figure out what you will actually earn from a bond.
Excerpted from my weekly AAII Investor Update email. For more information about the American Association of Individual Investors, visit www.aaii.com


