Len Cabrera's Blog, page 5
April 28, 2017
Microeconomic View of International Trade
Here’s a little refresher on the microeconomic view of international trade. For simplicity, we assume perfectly competitive domestic and international markets. That means domestic consumers can buy as much foreign goods as they want without affecting the world price. Similarly, domestic producers can sell as much as they want in foreign markets without affecting the world price. While not essential to the basic results, these assumptions make the graphs easier to interpret (and draw!).
First,...


April 27, 2017
No Excuse Not To Save
Search any finance site and you’re bound to find an article on retirement savings and the importance of starting early. It’s not exactly earth-shattering news, but I read them anyway out of morbid curiosity about the comments. Today’s entertainment (and disappointment) came from a recent Yahoo! Finance story about retirement mistakes to avoid:
Not Starting Early Not having a Roth IRA Raiding your retirement account Cashing out your 401(k)Good advice, but with any article I see on savings,...
April 25, 2017
Incentives Matter… Even in Education
A couple weeks ago, there was an article in the Gainesville Sun that said the average out-of-pocket expenses for tuition and fees for a bachelor’s degree from the University of Florida was only $10,660. That same day, I happened to be looking at the school’s website and something caught my eye: The school received $724 million in research grants last year. My inner economist quickly realized the incentive problem that leads to poor quality teaching at UF (at least from the perspective of the students I tutor). I did some quick math and confirmed that incentives do in fact matter, even at public universities. Follow the money…
Assuming a four year program, the $10,660 figure translates into $2,665 per year per student (out-of-pocket). The school has 35,043 undergrad students. That means the school collects about $93M per year directly from these students. In other words, they get over 7.5 times more money from research grants than they do from students. (At my Air Force retirement, when asked if I was planning to teach at UF, I joked: “They don’t teach at UF, they write grant proposals.” At the time I didn’t realize how true that statement was.)
Let’s be fair: the school collects more for students than just their out-of-pocket expenses. According to the school’s own numbers, tuition and fees come to $6,380 per year ($22,278 for out-of-state students, who comprise 3% of students). That means the school collects $247M for students (assuming someone else pays the difference). That still makes research grants almost 3 times more than money from students.
So what happens at a school that’s not focused on students? It doesn’t hurt their reputation. UF is ranked #14 for best public colleges by U.S. News & World Report. Part of their formula relies on the student-faculty ratio, which they say is 21:1. (Other sites say the number is 20:1.) A lower number is supposed to imply a student focus because they’re more likely to get more personalized attention from professors. But at a research school, faculty who focus on research may only step into a classroom to lecture to one very large section of students, so the figure could be misleading. A better measure would be actual class sizes. Trying to find the average class size is difficult, but we know what a good standard should be from UF: Their website says “the honors classes are limited to 25 or fewer students.”
What’s the average class size for regular classes at UF? Collegedata.com says “full-time faculty teaching undergraduates” and “regular class size” are not reported. That doesn’t sound like a school that wants to brag about student focus. Collegeconfidential.com has students talking about 300+ and 500+ student classes (a number confirmed anecdotally from students I’ve tutored). Surprisingly, Startclass.com says “Small class sizes (mostly 10-19 students).” UF’s own website says this: “Class size averages depend, of course, on the program, the college and the level of the student. Instructional Faculty & Class Size can be found on the Office of Institutional Research site.”
Visiting the link to Office of Institutional Planning and Research shows class sizes from Fall 2012:
[image error]
That’s where Startclass.com got its number, but while 10-19 is the median size, it’s less than 30% of the total. Realize that classes with 30+ students make up 32.6%, and over a fifth of the classes (23%) have over 40 students. If you remove those honors classes and majors classes, the average class size for freshmen and sophomores will be even worse. Like I said, not student focused.
I don’t mean to imply there aren’t good teachers at UF, or that all professors do not care about their students. I’m just pointing out that it appears quality education (at least as measured by average class size) is not the focus at the institutional level. The money shows why.
You could argue another reason for the lack of student focus is that students pay less than 40% of the cost (and even that is likely paid by parents). That brings up the same third-party payer issues we have in healthcare. That’s a blog post for another time.


April 24, 2017
Social Security: Take It While You Can!
Today’s post is for the chronologically gifted (i.e., those eligible for Social Security). The conclusion from a Sean Williams article on The Motley Fool: take your benefits while you can. The only way holding off on social security benefits pays off is if you expect to live beyond 85. It’s a morbid thought, thinking about when you’ll die, but that’s the fact of retirement planning. You have to make sure there’s enough money to support yourself while you are alive.
Williams used the average monthly Social Security payout for retirees ($1,363.66) and looked at lifetime payouts for various retirement ages (62 to 70). Assuming 2% cost of living adjustments, the 62-year-old retiree’s payouts exceeds all others until age 85. So if you’re eligible for Social Security, you may as well take it now. You’ll get lower monthly payments but greater total benefits.
For the rest of us, realize how little Social Security actually pays: $1,363.66 x 12 = $16,363.92. That’s not much to live on, even if you have no debt. You need to start planning now to make sure you grow a retirement nest egg that will support the quality of life you want in the future. Also read Chapter 6 of Basic Personal Finance and you’ll realize you’re Social Security benefits will be less than current retirees (if you get any at all).


April 23, 2017
Median Savings (Again)
CNBC is milking the Economic Policy Institute report from March 2016 to report “news” over a year later. This time it’s average and median retirement savings for people in their 50s.
Age
Average
Median
50-55
$124,831
$8,000
56-61
$163,577
$17,000
Note how low those medians are. I used the age 32-37 median (< $500!) on the back cover of Basic Personal Finance. These numbers show that over half the population is not prepared to support themselves in retirement. Don’t let that happen to you. The key is to plan ahead and establish financial discipline early in your life to save for the future. That’s rule #1 in Basic Personal Finance: Pay yourself first!
The original report is here. The table below is their summary chart that was featured in the CNBC story.
[image error]


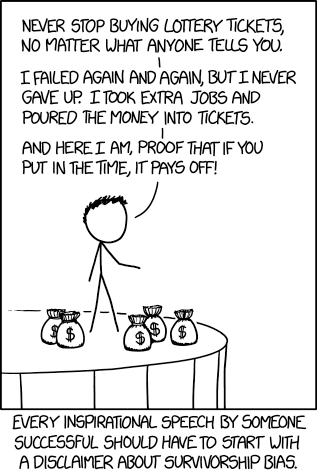
Rich ≠ Financial Literacy
Thanks to XKCD for demonstrating that people with money don’t necessarily know anything about money. https://xkcd.com/1827/