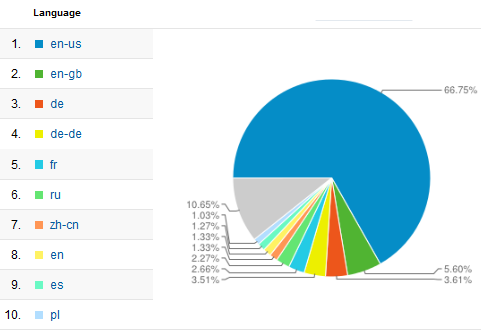
What languages do our readers speak – from Google Analytics
I’ve grabbed some Google Analytics statistics about the languages used by visitors to the Atlassian documentation wiki. The information is based on the language setting in people’s browsers. It’s a pretty cool way of judging whether we need to translate our documentation!
The statistics cover a period of 3 months, from 7 September to 7 December 2012.
Summary
Approximately 30% of our readers speak a language other than English. The most popular non-English language is German (approximately 7%), followed by French (approx 2.6%). Japanese is hard to quantify, because we have separate sites for Japanese content.
The pretty picture
This graph shows the results for the top 10 locales:

Top 10 locales via Google Analytics
The grey sector represents a number of smaller segments, each one below 1%. In Google Analytics, I can see them by requesting more than 10 lines of data.
The figures
Here are the figures that back the above graph:
Locale
Number of visits
Percentage of total
1.
 en-us
en-us1,951,818
66.75%
2.
 en-gb
en-gb163,897
5.60%
3.
 de
de105,526
3.61%
4.
 de-de
de-de102,578
3.51%
5.
 fr
fr77,666
2.66%
6.
 ru
ru66,342
2.27%
7.
 zh-cn
zh-cn38,850
1.33%
8.
 en
en38,826
1.33%
9.
 es
es37,129
1.27%
10.
 pl
pl30,064
1.03%
More Google Analytics?
Google Analytics is a useful tool. If you’re interested in a couple more posts about it, try the Google Analytics tag on this blog. I hope the posts are interesting. 


