
Studies of All Cause Mortality by Denis G Rancourt
 Denis G. Rancourt Studies of All Cause Mortality
Dr. Denis G. Rancourt PhD, a retired full professor of physics at the University of Toronto has been devoted to analyzing all cause mortality data during the C0\/lD pandemic era and \/A<

Above image: One of Dr. Rancourt’s early charts in 2020 showing all cause mortality data for the US. Notice waves of mortality peaking in winter and lowest in summer months. Note the sudden spike in mortality peak just after the vertical red line indicating the date the pandemic was declared simultaneously around the globe. Notice this sudden spike in mortality occurred after the winter peak and was offset slightly to the right. Courtesy of Dr. Denis Rancourt Figure 7. Rancourt, D. G. “All-cause mortality during COVID-19: No plague and a likely signature of mass homicide by government response.” Research Gate (2020).(1)
Header Image: Electron Microscopy of corona virus courtesy of CDC and Wikimedia Commons.Public Domain.
Harsh Treatments in Major Hospitals
Dr. Rancourt’s charts of all-cause mortality pick up an early feature of the pandemic showing that harsh treatments in major hospitals in large cities caused increased mortality in hospitalized patients, especially the elderly. This type of increased mortality was absent outside of the major cities. The harsh treatments included sedating patients and placing them on ventilators, and treating with remdesivir, a drug known as “run death is near” because of increased fatality in recipients, mostly from renal failure. See the video below for a 30 minute talk by Dr. Rancourt on this.
All Cause Mortality Data Can Not Be Manipulated
Mortality data is the “gold standard” because it can not be manipulated. The study of all-cause mortality data shows there was no spreading mortality during the pandemic from hot-spot urban areas to outlying counties. For example, the Bronx in New York saw highest mortality from hospital ventilator over-use. The increased mortality in Bronx hospitals from using ventilators and remdesivir did not spread out to outlying communities. This indicates that even though the virus was spreading to outlying communities, there was no increased mortality from the virus. This information was known since the beginning of the pandemic and I reported this in an early newsletter dated April 1, 2020, in which a study from Santa Clara California by Dr. Eran Bendavid (2020) reported the C0\/lD virus infection fatality rate was about the same as influenza virus, 0.12-0.2%. The infection fatality rate varies with age. For under age 10, fatality rate is near zero. For under age 40 the infection fatality rate is 0.2%, while for elderly age 70-80, the fatality rate is 8%. C0\/lD \/a<
In the April 2020 newletter, I wrote:
The Corona Virus has changed the world as we know it. However, armed with relevant knowledge, we can protect ourselves and loved ones from the virus, the deceptive news media hype about it, and the misguided containment policies of the government. The infection fatality rate is about the same as influenza, which means the draconian shutdown is a colossal mistake.
Here is the video presentation by Dr. Rancourt:
If you want to understand persistent excess mortality…It is not “long C0\/lD”, It is not “post-vaccination syndrome”, It is post-government-assault trauma and permanent institutional and societal changes following the 4-year assault see my recent presentation pic.twitter.com/wJHMtgJvd0
â Denis Rancourt (@denisrancourt) March 8, 2025
=============================================
This is a short clip of Dr. Rancourt discussing how the study of all-cause mortality data shows there was no spreading mortality during the pandemic from hot-spot urban areas to outlying counties.
there was no spread
i don’t know how else to say it
nothing was spreading
there was geostatic time evolution, not geotemporal pic.twitter.com/wialCMpfxZ
â Denis Rancourt (@denisrancourt) March 20, 2025
=====================================
All Cause Mortality Goes Up After \/a<
Although there was no increased mortality from the virus outside of major urban centers from hospitals using harsh treatments, there was increased mortality after the \/a<. In 2023, Dr. Denis Rancourt reviewed national data on all cause mortality for 17 countries in the Southern Hemisphere. The data shows a causal relationship between \/a<
The 17 countries studied (Argentina, Australia, Bolivia, Brazil, Chile, Colombia, Ecuador, Malaysia, New Zealand, Paraguay, Peru, Philippines, Singapore, South Africa, Suriname, Thailand, Uruguay) comprise 9.10 % of worldwide population, 10.3 % of worldwide COVID-19 injections (vaccination rate of 1.91 injections per person, all ages), virtually every COVID-19 vaccine type and manufacturer, and span 4 continents. The scientific tests for causality are amply satisfied, as extensively demonstrated in these sections of the present paper:
COVID-19 vaccines can cause deathAbsence of excess mortality until the COVID-19 vaccines are rolled outThe COVID-19 vaccines did not save lives and appear to be lethal toxic agentsStrong evidence for a causal association and vaccine lethal toxicityCausality in excess mortality is amply demonstrated. (END QUOTE) (4)Here is the all cause mortality chart for Australia, similar to the other 16 countries:
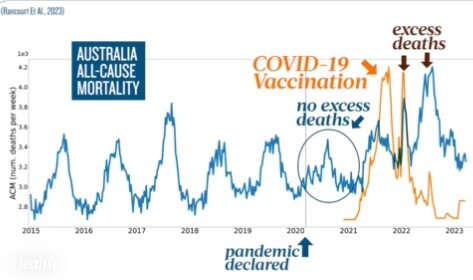
Notice all cause mortality (blue line) has sinusoidal wave appearance unchanged after pandemic declared (up arrows). However excess deaths (down arrows) coincide with vaccine rollout (yellow line). Courtesy of Rancourt, Denis G., et al. “COVID-19 vaccine-associated mortality in the Southern Hemisphere.” Correlation Research in the Public Interest, Ontario, Canada (2023).
Mortality Data and Childhood \/a<
A Baseless Fraud
What does the data say about mortality after rollout of childhood \/a<Evidence of increase in mortality after the introduction of diphtheriaâtetanusâpertussis vaccine to children aged 6â35 months in Guinea-Bissau: a time for reflection?.” Frontiers in public health 6 (2018): 79.
Here is a quote from Dr. Rancourt’s latest study dated January 2025 regarding infant mortality after rollout of childhood \/a<
There is no known example of a drop in measured infant or child mortality temporally associated with the rollout of a childhood \/a<I conclude, overall, that the longstanding industry of infant vaccination programmes is a baseless fraudulent enterprise of exploitation. end quote Dr. Rancourt.
Conclusion: Although I may not agree with all of Dr. Rancourt’s statements, I do value his work on all cause mortality. This is quite convincing and should be accepted at face value. Although it is obvious to any observer the C0\/lD \/irus spread freely via respiratory aerosol throughout the population, there was no spreading increased mortality from the virus outside of the urban areas. This indicates the increased mortality in urban areas was iatrogenic and not from the virus itself. The reason for this is the rather low C0\/lD virus infection fatality rate (IFR), similar to the IFR for influenza.
After the \/a<
However, all-cause mortality increased immediately after the C0\/lD \/a<
Articles with related Interest:
Florida Department of Health Advises Against C0\/lD B00STERS
Dr. Karina Whitehouse Presentation on mRNA \/axxines
Finding a Doctor and Pharmacy to Prescribe Early Treatment for Viral Disease
Strong Anti-Viral Effects of CBD
Lies My Government Told Me about the C0\/lD \/a<
Dr Peter Mcullough on Ivermectin and Covid Vaccines
Explaining Damar Hamlin Cardiac Arrest on Field
Covid Vaccines, a time for Re-Assessment
Director of CDC, Rochelle Walensky Warns of ADE, Antibody Dependent Enhancement From Israel Data.
Israel Should Stop á¹áºiáºá¸r and Start l\/á¸rmá¸ctin Distribution
The Covid Vaccine is Safe and Effective ?
Could the Covid Vaccine be the Next Vioxx ?
Ivermectin for Covid, The Failure of American Medicine
Ivermectin Antiparasitic Anticancer Antiviral Wonder Drug
Deceptive Drug Marketing from New York Times
Failed Pandemic Policy, Who is to Blame?
Covid Vaccine Failure and Ivermectin Success Story
Delta Variant Renders Current Vaccines Obsolete
Inventing the Covid Virus and Vaccine
Causalties of the C0\/lD War, When Wlll this End ?
Vaccinoffee, a Vaccine with Every Coffee
Jeffrey Dach MD
7450 Griffin Road, Suite 190
Davie, Fl 33314
954-792-4663
my blog: www.jeffreydachmd.comÂ
Natural Thyroid Toolkit by Jeffrey Dach MD
Cracking Cancer Toolkit by Jeffrey Dach MD
Heart Book by Jeffrey Dach MD
www.naturalmedicine101.com
www.bioidenticalhormones101.com
www.truemedmd.com
www.drdach.com
References and Links
1) All-cause mortality during COVID-19: No plague and a likely signature of mass homicide by government response. Technical Report · June 2020 D. G. Rancourt Ontario Civil Liberties Association Rancourt Ontario All Cause Mortality COVID-19 2020
Update: April 24, 2020: Fatality Rate for Covid-19 About the Same as Influenza: Estimated Covid-19 infection fatality rate of 0.12-0.2%
2) Bendavid, Eran, et al. âCOVID-19 Antibody Seroprevalence in Santa Clara County, California.â medRxiv (2020). Prevalence of coronavirus antibodies of 1.5 percent. Likely prevalence ranged from 2.49 to 4.16 percent.
âthese prevalence estimates represent a range between 48,000 and 81,000 people infected in Santa Clara County by early April, 50- 85-fold more than the number of confirmed cases.â
âUsing these data, the researchers calculated the infection fatality rate, that is, the percent of people infected with the disease who die: âA hundred deaths out of 48,000-81,000 infections corresponds to an infection fatality rate of 0.12-0.2%,â they report.* Thatâs about the same infection fatality rate the Centers for Disease Control and Prevention (CDC) estimates for seasonal influenza.â end quote
3) video and Chart by Dr Rancourt:
4 June 2020: Jim Larsen asks Denis Rancourt to explain his paper âAll-cause mortality during COVID-19: No plague and a likely signature of mass homicide by government responseâ.
4) Rancourt, Denis G., et al. “COVID-19 vaccine-associated mortality in the Southern Hemisphere.” Correlation Research in the Public Interest, Ontario, Canada (2023).
5)Â ALL You Tube Videos by Dr. Denis Rancourt
=====================================
Jeffrey Dach MD
7450 Griffin Road, Suite 190
Davie, Fl 33314
954-792-4663
my blog: www.jeffreydachmd.comÂ
Natural Thyroid Toolkit by Jeffrey Dach MD
Cracking Cancer Toolkit by Jeffrey Dach MD
Heart Book by Jeffrey Dach MD
www.naturalmedicine101.com
www.bioidenticalhormones101.com
www.truemedmd.com
www.drdach.com
Click Here for: Dr Dachâs Online Store for Pure Encapsulations Supplements
Click Here for: Dr Dachâs Online Store for Natureâs Sunshine Supplements
Web Site and Discussion Board Links:
jdach1.typepad.com/blog/
disc.yourwebapps.com/Indices/244066.html
disc.yourwebapps.com/Indices/244067.html
http://sci.med.narkive.com/covV2Qo2/jeffrey-dach-book-announcment-natural-medicine-101
The reader is advised to discuss the comments on these pages with his/her personal physicians and to only act upon the advice of his/her personal physician. Also note that concerning an answer which appears as an electronically posted question, I am NOT creating a physician â patient relationship. Although identities will remain confidential as much as possible, as I can not control the media, I can not take responsibility for any breaches of confidentiality that may occur.
Link to this Article
Copyright © 2025 Jeffrey Dach MD All Rights Reserved. This article may be reproduced on the internet without permission, provided there is a link to this page and proper credit is given. See Repost Guidelines.
FAIR USE NOTICE: This site contains copyrighted material the use of which has not always been specifically authorized by the copyright owner. We are making such material available in our efforts to advance understanding of issues of significance. We believe this constitutes a âfair useâ of any such copyrighted material as provided for in section 107 of the US Copyright Law. In accordance with Title 17 U.S.C. Section 107, the material on this site is distributed without profit to those who have expressed a prior interest in receiving the included information for research and educational purposes.
Serving Areas of: Hollywood, Aventura, Miami, Fort Lauderdale, Pembroke Pines, Miramar, Davie, Coral Springs, Cooper City, Sunshine Ranches, Hallandale, Surfside, Miami Beach, Sunny Isles, Normandy Isles, Coral Gables, Hialeah, Golden Beach ,Kendall,sunrise, coral springs, parkland,pompano, boca raton, palm beach, weston, dania beach, tamarac, oakland park, boynton beach, delray,lake worth,wellington,plantation
Last updated on March 28th, 2025 by Jeffrey Dach MD
The post Studies of All Cause Mortality by Denis G Rancourt appeared first on Jeffrey Dach MD.


Jeffrey Dach's Blog

- Jeffrey Dach's profile
- 3 followers

