A Visual Look at the Success of NBA Franchises
 Many Tableau articles and tips use the Superstore example. To be sure, it’s a robust dataset that allows for all sorts of comparisons, charts, calculations. At least for me, though, using a generic dataset is not nearly as much fun. Looking back over my career, that’s been a constant: I’ve tried to enjoy myself every time that I’ve decided to teach myself a new application or programming language.
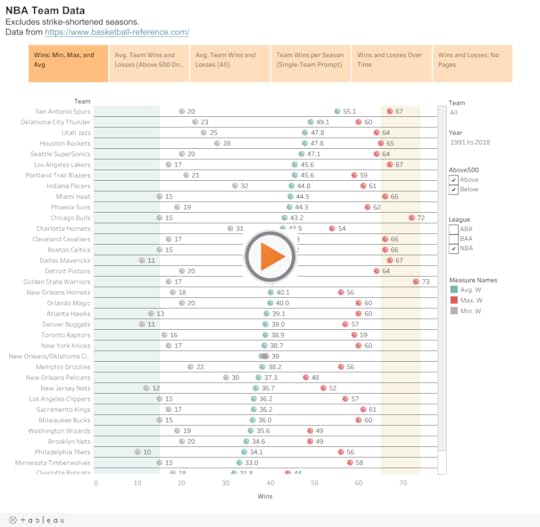
Along these lines, I grabbed some NBA data from Basketball Reference. It didn’t take long for me to discover the following:
The San Antonio Spurs have been crazy consistent over the past 27 years.1
The Knicks generally suck but saw some glimmers of hope throughout the team’s history.
The Vancouver Grizzlies were historically bad.
The best years from the Washington Bullets and Charlotte Bobcats really weren’t that great.
Go nuts in the following interactive Tableau dataviz:
Feedback
What approaches do you use when you’re learning a new tool?
The post A Visual Look at the Success of NBA Franchises appeared first on Phil Simon.


No comments have been added yet.