Christopher Lawson's Blog
October 7, 2022
Amazon Aurora: Using Materialized Views
Materialized Views are common in Oracle databases. They are especially useful when some set of data is repeatedly needed—such as in an oft-run report. These views can also be defined in Aurora, but there are important differences.
The sytax for creating the MV is the same as in Oracle.
Create Materialize View MVNEW as Select from ...Key Differences in AuroraAlthough the syntax to create the MV is like Oracle, there are important differences. Firstly, the command to refresh is different (and simpler)
REFRESH MATERIALIZED VIEW mvnew;A Crucial DifferenceIn Aurora, refresh will always be Complete. Some Aurora documentation recommends creating a trigger to automatically command a refresh after any update to the underlying table. This option will not be appropriate in many cases. You can see how running a complete refresh would be a disaster in many cases. Instead, one should schedule the refresh. This is accomplished using the database extension, pg_cron.
Pg_Cron SetupThere are some preliminary steps before this scheduler can be used. First, pg_cron needs to be added to the parameter, shared_preload_libraries. Then, administrator should restart the database instance. From a database account with superuser privilege, create the extension: CREATE EXTENSION pg_cron. All of the pg_cron objects run in the database called postgres. Users who need to use pg_cron can be granted privilege using command, GRANT USER ON SCHEMA cron to user; (That user also needs to have permission on the underlying tables.)
Scheduling a JobUse the function, cron.schedule to inititate a job in the default postgres database. The return value is the job_id. The syntax is:
cron.schedule (job_name, schedule, command);The schedule entry uses the same syntax as normally used in Unix. Note that job_name is option. For example:
postgres=> SELECT cron.schedule ('myjob','15 11 * * *', 'myprogram');Removing a scheduled job uses the function, cron.unschedule().
Other NotesThe status of run jobs can be found in the table, cron.job_run_details.
Key Parameters related to pg_croncron.host: The hostname to connect to PostgreSQL. cron.log_run: Log each job in job_run_details. cron.log_statement: Log all cron statements cron.max_running_jobs: Maximum number of concurrent jobs.cron.use_background_workers Use background workers instead of client sessions.Display current settings of above parameters using:
SELECT name, setting, short_desc FROM pg_settings WHERE name LIKE 'cron.%';

February 7, 2020
Find More Money by Art Rainer
FIND MORE MONEY includes some decent points, all presented from a Biblical perspective. If you find yourself in a tough financial situation, this could be a good place to start. Some of the ideas are similar to those in the famous "Dave Ramsey" seminars.
The author correctly notes that simply "cutting back" is often not enough. If you are already spending $1.19 per meal, you probably need to figure out how to get more cash.
This is a super-quick read, offering some simple ideas for picking up money via side gigs. The author presents points via discussions with friends who have financial trouble.
For a more meaty take on employment, I would consider the "What color is your Parachute" series.~
January 28, 2020
Oracle Sorting: In-Memory Versus Spill to Disk
We recently had a performance issue on a large production databbase, and I tracked the problem down to a monstrous sort. The sql required a big hash join, but even worse, it had to sort over a billion rows. Given the fields involved, I estimated the data being sorted at 100 GB.
I assumed that Oracle would need the same size—about 100 GB of PGA memory, to do this sort. This seemed impossible—how could this ever work? It seemed like our server would never have that much spare memory available.
Well, I was right, and also wrong. It’s true that our server never had that much memory available, but it didn’t matter, since it didn’t need that much.
Oracle’s Tricky MethodIt turns out that efficient sorts—even of huge data sets, only require a modest amount of memory. In my particular case, Oracle only needed 100 MB—about 1000x less than I thought. Oracle doesn’t need to put the entire data set in memory; rather, it uses a clever method to accomplish the sort in parts. There are dozens of different algorithms that allow efficient sorting of huge amounts of data. They accomplish this by working on small sets of data at a time, and putting the intermediate results into “buckets,” sort of like a hashing routine.
Oracle keeps track of how it handles big sorts. Look in the view, V$Sql_Workarea. It classifies the sorts as either Optimal, One Pass, or Multi Pass. Here’s the key: Optimal and One Pass will work fine; only the Multi-Pass ones will have big degradation. It’s called, “One Pass,” because Oracle has to do one more pass through the data.
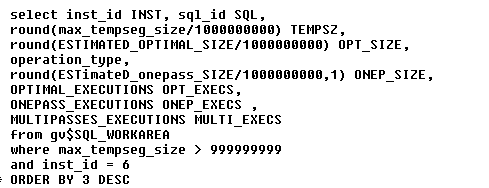
Here’s one way to display the current sorts. The output below has been slightly changed (sql_id’s modified).

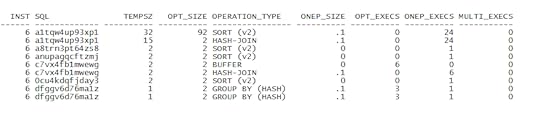
Recent Sorts
Memory versus DiskA key point is distinguishing between in-memory operations versus operations that have to spill to disk. Oracle uses a funny term, Optimal Execution, which means operation is done completely in memory.
The view V$Sql_Workarea has some great metrics, but this view can be confusing. Some of the fields refer to in-memory operations, and others refer to disk operations. Here are some of the key fields:
Works Surprisingly Well
MAX_TEMPSEG_SIZE: For operations that spill to disk, this is the largest number of bytes used in temp segment.
LAST_TEMPSEG_SIZE: Similar to above, size (bytes) of the most recent temp segment used when operation spills to disk.
ESTIMATED_OPTIMAL_SIZE: Estimated size (bytes) to perform operation completely in-memory. This is a theoretical number.
LAST_MEMORY_USED: Size of memory used (bytes) in last execution.
In this example shown above, only one sql potentially required a big sort area. Note that Oracle performed 24 One Pass executions, and zero “Multi” executions. In other words, performance will likely be fine.
I admit I was surprised by the sophistication of Oracle’s management of sorting operations. It’s important to understand which operations happen in-memory, and which spill to disk.
Oracle Sorting: Much Less Memory Required!
We recently had a performance issue on a large production databbase, and I tracked the problem down to a monstrous sort. The sql required a big hash join, but even worse, it had to sort over a billion rows. Given the fields involved, I estimated the data being sorted at 100 GB.
I assumed that Oracle would need the same size—about 100 GB of PGA memory, to do this sort. This seemed impossible—how could this ever work? It seemed like our server would never have that much spare memory available.
Well, I was right, and also wrong. It’s true that our server never had that much memory available, but it didn’t matter, since it didn’t need that much.
Oracle’s Tricky MethodIt turns out that efficient sorts—even of huge data sets, only require a modest amount of memory. In my particular case, Oracle only needed 100 MB—about 1000x less than I thought. Oracle doesn’t need to put the entire data set in memory; rather, it uses a clever method to accomplish the sort in parts. There are dozens of different algorithms that allow efficient sorting of huge amounts of data. They accomplish this by working on small sets of data at a time, and putting the intermediate results into “buckets,” sort of like a hashing routine.
Oracle keeps track of how it handles big sorts. Look in the view, V$Sql_Workarea. It classifies the sorts as either Optimal, One Pass, or Multi Pass. Here’s the key: Optimal and One Pass will work fine; only the Multi-Pass ones will have big degradation. It’s called, “One Pass,” because Oracle has to do one more pass through the data.
Here’s one way to display the current sorts. The output below has been slightly changed (sql_id’s modified).

Recent Sorts
Works Surprisingly Well
In this example shown above, only one sql potentially required a big sort area. Note that Oracle performed 24 One Pass executions, and zero “Multi” executions. In other words, performance will likely be fine.
I admit I was surprised by the sophistication of Oracle.
December 10, 2019
Nerves of Steel: How I Followed My Dreams, Earned My Wings, and Faced My Greatest Challenge by Tammie Jo Shults
“There’s a reason Southwest gives you two.”

So commented the author's son, Marshall, upon hearing his captain mom had had some sort of engine problem. Of course, he didn't realize then the "problem" his mom had survived was actually an engine blowing up, along with loss of key controls, tearing out a window, and cabin depressurization. The highpoint of the book is how Captain Shults coped with this onslaught of problems--and yet somehow, keeping cool the entire time.
The title of the book comes from the observation of an EMT after her safe landing. Noting her normal pulse rate, he complimented her on her "Nerves of Steel."

The author, ever modest, credits her flight crew for keeping the passengers safe, and turning a potential catastrophe into a safe landing. (One passenger, partially sucked out of the broken window, lost her life.)
NERVES OF STEEL tells the story of Captain Tammie Jo Shults, first as a young girl with dreams of flying, all the way to the captain's seat of a major airline. It was not an easy journey for her. She had to deal with the usual biases against a woman pilot, as well as flat-out nasty back-stabbing from those who just couldn't stand a woman in the cockpit.

No matter what the obstacle, the author pressed on, patiently dealing with, and eliminating each obstacle as it surfaced. The Captain credits her Christian faith with giving her hope, no matter what the circumstances. She likens her love of flying to the famed Olympic running Eric Liddell, of Chariots of Fire: "In the script, Eric says, 'God made me fast. And when I run, I feel His pleasure.' That's how I feel about flying"
NERVES OF STEEL is a sobering, yet inspiring message of perseverance, hope, and faith. There are a lot of life lessons in this book.
I fly a lot on Southwest. I will be on the lookout for Captain Shults. What a role model!
October 21, 2019
Oracle Performance: Showing Redo Generation for RAC
Sometimes I need to quantify the amount of redo being generated over a period of time. For example, if one uses replication, such as Golden Gate, it is important to know how much data is being replicated.
Here is a simple way to sum-up all redo for all RAC nodes. I only list periods where there has been substantial activity. I also show the begin time of the snapshot, for easy reference:
select s.snap_id,
to_char(begin_interval_time, 'dd-mon-yy-hh24:mi') BEG,
round(sum(average*3600/1000000000)) TOT_REDO_GB
from dba_hist_snapshot s, DBA_HIST_SYSMETRIC_SUMMARY M
where s.snap_id = m.snap_id
and s.snap_id between 1480 and 1650
and s.instance_number = m.instance_number
and metric_name like 'Redo Generated Per Sec%'
and Round(average/99999) > 100
group by s.snap_id, to_char(begin_interval_time, 'dd-mon-yy-hh24:mi');
--------- --------------- -----------
1491 08-oct-19-13:00 85
1492 08-oct-19-14:00 45
1493 08-oct-19-15:00 116
1495 08-oct-19-17:00 124
1496 08-oct-19-18:00 38
1502 09-oct-19-00:00 55
1523 09-oct-19-21:00 113
1526 10-oct-19-00:00 55
1533 10-oct-19-07:00 137
1549 10-oct-19-23:00 68
1550 11-oct-19-00:00 54
1559 11-oct-19-09:00 127
1565 11-oct-19-15:00 1207
1566 11-oct-19-16:00 1265
1567 11-oct-19-17:00 1433
1568 11-oct-19-18:00 542
1574 12-oct-19-00:00 55
1598 13-oct-19-00:00 55
1622 14-oct-19-00:00 43
1642 14-oct-19-20:00 136
1646 15-oct-19-00:00 43
Naturally, you can customize the script for the period of interest.
September 20, 2019
Fast 5K: 25 Crucial Keys and 4 Training Plans by Pete Magill
The first thing I noticed about FAST 5K by Pete Magill was the concise, easy-to-read format. Each chapter is actually a "Key," and focuses on a single point--e.g, "Slow Down Your Distance Runs," or, "Eat a Runner's Diet." This is really a smart way to write a non-fiction book. With this format, the reader can concentrate on just one important aspect of running, and not get overwhelmed with "fast-twitch," "slow-twitch," etc.

Do NOT just scan through this book quickly. Instead, take time to mull over these important keys. I am reading through them slowly, and pondering over them a little. I am learning a lot.
As most readers will already know, the author is not just an armchair theoretician--he is an accomplished, award-winning runner and coach. This experience shines through loud and clear. For example, Pete spends a fair amount of time discussing avoiding injuries. For example, he provides a plan for post-run stretches and other exercises that focus on the most injury-prone body parts.
Here is an example of a golden gem of advice: Use the "3-Week" improvement method, not the "10%" method. That is, give your body 3 weeks to adjust to a harder pace. Otherwise, you risk injury. Throughout the book, Pete emphasizes realistic training and goals. One sober chart illustrates the huge number of injuries to runners, and how they occur.

Here's another key that hits pretty close to home: "Key 20: Review non-Running Activities & Hobbies." Pete suggests looking at your non-running activity to see how it affects your running performance. That is, your other sports could be hurting your running. (I can confirm from personal experience that mountain biking can be dangerous to your running health.)
Pete Magill is a running genius. I found "FAST 5K" to be a superb, practical book. I am using it now--or I will be when I recover from my mountain-biking accident. (I forgot about Key #20.)

Special thanks for photos to 101 Degrees West and Diana Hernandez.
June 24, 2019
Latest YouTube Reviews
3.6v screwdriver https://www.youtube.com/watch?v=oxjnyThB8oY
Sharpen hedge trimmer https://www.youtube.com/watch?v=45vLWJR_H5o
Socket https://www.youtube.com/watch?v=MQRhFPJYpqc
Mpow bluetooth https://www.youtube.com/watch?v=7IeXfdetbIk
Change blade saw https://www.youtube.com/watch?v=T7ZwVrmNNSI
January 28, 2019
Oracle Performance: Why AWR Reports are Limited
Don’t get me wrong—I look at AWR reports all the time. I find them useful for getting a feel for how a database is running. They provide a lot of useful information. Keep in mind, however, that AWR numbers are actually roll-ups of the raw data. Be definition, AWR reports list the averages for the snapshot period (typically, one hour.) In many cases, the average is good enough.
Here’s the problem: What if you are looking for a specific problem that only occurred for a brief time? In this case, having an average is just not good enough.
When AWR is Not Enough
Only knew how to use AWR reports
Here’s an actual example I encountered recently: The in-house customer reported that his jobs were taking a long time—hours longer than he expected. Looking at the AWR report, the only Sql listed were very simple, efficient, and fast-running. One could easily be fooled into thinking that all the Sql was fine; however, that was not the case.
Looking carefully at the AWR report, in the section title, SQL ordered by Elapsed Time, I noticed one important note.
Captured SQL account for 16.4 % of Total DB Time (s).
In other words, the AWR report was missing the vast majority of Sql actually run over that period!
Find the Missing SqlBy using some queries on V$ActiveSession_history, I was able to spot some of the other Sql that I had missed. Here is one simple way
with p1 as (select /* parallel(a 8) */
distinct *
from v$active_session_history A
where wait_time = 0
and sample_time like '24-JAN-19 11.42%PM'
and sql_id is not null
) select module, sql_id, sql_exec_id, event, count(*) from p1
group by module, sql_id, sql_exec_id, event
order by 1
The reason that the AWR report had missed these other Sql, is that they didn’t use bind variables. So each of these other Sql was unique. Since AWR only show the top resource consumers, none of the “missing” Sql qualified as a big resource consumer. I find these type of omissions as the biggest problem with not using bind variables. Many DBAs are fooled by this.
Know How to use Active Session History
Clever DBA
As long as you have other ways to zero-in on problem Sql, you won’t be fooled anymore by “missing” Sql. I find the Active Session History views to be one of the most powerful tools in my toolbox.
October 2, 2018
Never Stop Learning: Stay Relevant, Reinvent Yourself, and Thrive by Bradley R. Staats
In NEVER STOP LEARNING, professor Bradley Staats explains why we often do just that. His research shows we fall into all kinds of traps, which impede our learning. I found it helpful to first skim through the book to get a feel for his points. Then, I went back and read in greater detail the points that seemed most relevant to me.
I found two chapters in particular to be especially valuable:
Chapter 2: "Why Don't We Learn from Failure?" and
Chapter 4: "Asking Questions."

Asks a lot of questions
Fear of Failure
Our society frowns on failure. When it happens, we think that "something has gone wrong." Therefore, we are hesitant to try new ideas that could fail. The problem is, to be a growing learner, we have to be willing to fail.
Our learning is also inhibited because we don't explore different avenues. And when we do, we choose answers that tend to confirm our presuppositions:
"We too quickly assume that we understand a situation given the information that surrounds us."

Willing to fail
Look at the Process
In Chapter 3, the professor suggests we change our focus a bit. We tend to focus too much on the actual end result. This is often unwarranted. Instead, we should look more at the process. We need to develop a "keen eye for where value is created."
So all in all, I found NEVER STOP LEARNING to be a fun, helpful read. Several of the chapters were quite beneficial to me, whereas other chapters not so much. Naturally, this will vary among the readers.