
Rahul Deodhar's Blog, page 17
July 31, 2012
Rant - Keynes is medicine - not food
I wish to restate that Keynesian recommendations are like medicine, to be taken only in dire circumstances when the economy is ill. It is not, I repeat NOT, a dietary recommendation for running a country in usual times.
Buy my books "Subverting Capitalism & Democracy" and "Understanding Firms".


Buy my books "Subverting Capitalism & Democracy" and "Understanding Firms".


July 30, 2012
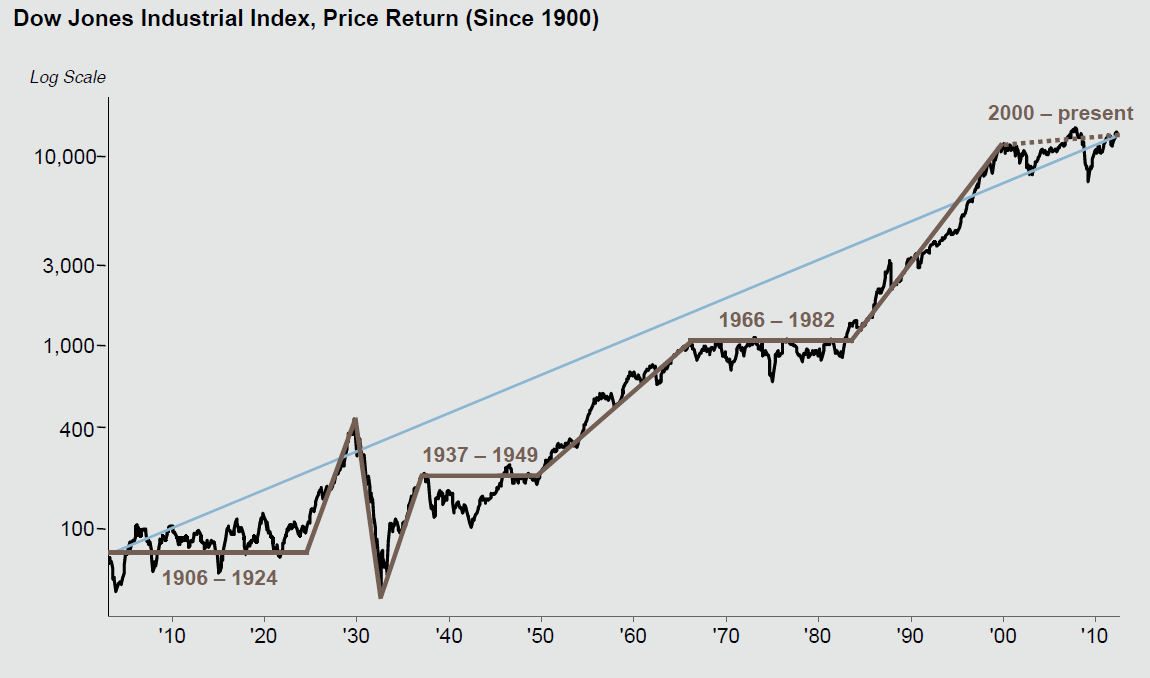
Dow Jones Industrial Average since 1900
Barry Ritholtz links to this awesome chart from J.P.Morgan. It tells us so many things when you look at real long term. Have a look and my comments are below this:

The graph tells us so many things:
Before anything else, I must highlight that the average line for 1937-49, 1966-82 and 2000- present are drawn wrong. They have a positive bias. 1906-24 seems to have a negative bias.
More importantly, we seem to have ~20 years of stability and ~20 years of secular bull runs . By that measure, somewhere after 2015 we will see the start of the next bull run.
But we must correlate these with actual developments. If you draw some key developments on the charts we will see better picture.
Periods of technology development
1930s and 1940s period signifies the development of US highways and railroad. This is phase where Americans were still exploring new frontiers within their country.
Similarly 1966-82 period was time when computing technology was taking shape.
Similarly, 2000- present internet technologies are taking root.
Productivity increase periods. These periods are different from technology development periods. Here known technologies are being exploited to create new thresholds for efficiency and productivity. Concurrently, new technologies are being incubated but those are not the dominant forces as yet.
1949 onwards was post war reconstruction. Here known things were required to be produced in ever increasing numbers to satisfy the demand in Europe and Americas itself.
1982 till 2000 was a period when IT came of age. Computing allowed wider management control, better designs, higher efficiency etc.
Overall quite an interesting chart. What do you think?
update: I made a appalling mistake of commenting on exponential line which I have deleted. The graph is in log scale.
Buy my books "Subverting Capitalism & Democracy" and "Understanding Firms".
July 29, 2012
Non-choice in next US presidential elections
First Matt Stoller has an amazing piece up at nakedcapitalism. He is highlighting how there is no debate on essentials in this election. His quote "the two candidates are speaking not to the voters, but to the big money". This is exactly what I wrote about in my book Subverting Capitalism and Democracy.
Big money in politics
If you want to know how much big money is influencing the process, here is another discussion about money in politics by Hacking Society where the numbers given are as below (about 1.50minutes to 3 minutes):
0.26% of Americans give more than $200 in election finance for congressional election.
0.05% give maximum amount to any congressional candidate.
0.01% give more than $10,000
0.000063% or 196 people finance 80% of the superpack money in Presidential election.
These figures are astounding! Just imagine what are these 196 people getting for all this money. In their normal day job they examine microscopically ever dollar they spend and yet they are spending all this money for superpacks?
What will be the policies of new President?
To understanding politicians and their actions, it is important to know who they put to work for them. If you have read or seen Harry Potter, you must have learnt how important house-elves are (Dobby and Kreacher). Many commentators cribbed how there was no change between the economic and financial advisors in Bush era and Obama era. Matt Stollers points out that "Obama appointed Erskine Bowles. - Clinton put Erskine Bowles, a conservative Democrat, in charge of the effort o work with Newt Gingrich to cut Social Security for recipients and pour some of the Social Security trust fund into the booming stock market".
So essentially, Americans are faced with nothing new in policy initiatives and at worst drastic cutbacks in social security and other benefits.
Buy my books "Subverting Capitalism & Democracy" and "Understanding Firms".
July 28, 2012
Global Public Debt
Economist has, as usual, a great interactive chart about public debt. Here are two snapshots from that showing marked increase in the debt as % of GDP across the last decade. The last picture is for 2011.
[image error]
[image error]
[image error]
Now it is interesting to note the following:
Some resource driven countries seemed to have reduced their debt. Some in Arabian peninsula and Russia come to mind.
Europe and US have increased their debts, as expected. Japan continues to have high debt over the entire decade. This could be because of two reasons - GDP falling and debt rising.
Britain has had it worse. It went from green to deep red. The reason again could be both GDP falling and Debt rising.
Now I want to have a corresponding chart of investment in drivers of GDP. I bet between 2007 and 2011 nothing has happened in this chart.
Debt is as good as the ability to pay
Debt is good if the ability to pay exists. The quantum of debt is immaterial so long as ability to pay is reasonably certain. When large amount of debt exists but ability to pay does not exist (usually it is merely broken), then creditors often offer more debt to strengthen the ability to pay. One can argue that in this case the answer to debt is more debt. More correctly, the answer to debt is a strong ability to pay.
If more debt is taken on without improving the ability to pay then it is sure a road to bankruptcy. A good way to start the process is to write down the debt acquired since 2007-08 crisis. I am sure ample data exists to understand how much was given to whom. It is no business of the tax payer to bear these costs. Corresponding treasury bills can be settled by raising equivalent debt liability on the firms receiving the money.
I am sure some will think this to be illegal. But it is not. It is just belated government action and can be ratified by respective parliaments.
Buy my books "Subverting Capitalism & Democracy" and "Understanding Firms".


[image error]
[image error]
[image error]
Now it is interesting to note the following:
Some resource driven countries seemed to have reduced their debt. Some in Arabian peninsula and Russia come to mind.
Europe and US have increased their debts, as expected. Japan continues to have high debt over the entire decade. This could be because of two reasons - GDP falling and debt rising.
Britain has had it worse. It went from green to deep red. The reason again could be both GDP falling and Debt rising.
Now I want to have a corresponding chart of investment in drivers of GDP. I bet between 2007 and 2011 nothing has happened in this chart.
Debt is as good as the ability to pay
Debt is good if the ability to pay exists. The quantum of debt is immaterial so long as ability to pay is reasonably certain. When large amount of debt exists but ability to pay does not exist (usually it is merely broken), then creditors often offer more debt to strengthen the ability to pay. One can argue that in this case the answer to debt is more debt. More correctly, the answer to debt is a strong ability to pay.
If more debt is taken on without improving the ability to pay then it is sure a road to bankruptcy. A good way to start the process is to write down the debt acquired since 2007-08 crisis. I am sure ample data exists to understand how much was given to whom. It is no business of the tax payer to bear these costs. Corresponding treasury bills can be settled by raising equivalent debt liability on the firms receiving the money.
I am sure some will think this to be illegal. But it is not. It is just belated government action and can be ratified by respective parliaments.
Buy my books "Subverting Capitalism & Democracy" and "Understanding Firms".
July 26, 2012
My second book Free on Kindle - Friday and Saturday only

Please subscribe to my blog on Firms.
Buy my books "Subverting Capitalism & Democracy" and "Understanding Firms".
[image error]

July 21, 2012
Free download: Subverting Capitalism and Democracy
My first book Subverting Capitalism and Democracy is available free (kindle edition) on Amazon. Click and download and tell me what do you think.
You can also buy my next book "Understanding Firms - A Manager's model of the Firm.
[image error]
You can also buy my next book "Understanding Firms - A Manager's model of the Firm.
[image error]
July 13, 2012
Keynes returning?
Yves Smith has guest post by Paul Davidson author of The Keynes Solution. I generally liked the post and recommend you read it too. Here are some points I would like to make:
Republicans abhor government but still want to get elected. Sounds like wanting the job you hate doing.
It is never about taxes it is always about demand, if demand exists taxes are affordable. Don't eliminate taxes make them affordable by getting demand.
Prudent regulation is good idea. Else it is like a football match without referees and ground markings.
At 2008, either solution Keynes or otherwise would have worked. Today only alternative is Keynes.
Buy my books "Subverting Capitalism & Democracy" and "Understanding Firms".
[image error]
July 12, 2012
Combining Managerial and Economic theory of the Firm
Understanding Firm - A Manager's model of the Firm presents a new model combining managerial and economic theory of the firm.

Buy my book "Understanding Firms - A Manager's Model of the firm".


Buy my book "Understanding Firms - A Manager's Model of the firm".
July 9, 2012
My book: Understanding Firms
My book Understanding Firms - A Manager's Model of the firm is now available.
The book presents a unique model at intersection economic and managerial theory. The model uses five elements - the concept of transaction chains, Coase transaction cost hypothesis, Porter’s bargaining power theory, a new way of profiling transaction and new types of roles undertaken by employees.
This model provides insights into which mergers will work, how to make them work, how to promote disruptive innovation, how to manage knowledge oriented teams etc. It explains why sometimes our strategy fails, why we are blind to competition and inefficiency. This model provides a new framework for thinking about firms. This framework will help us make firms better.
I say the book is essential read for managers, investors and everyone who works in organizations. The kindle version is available at $5 (£ 3.50 and € 4.00) and print at $8 (£ 5.50 and € 6.50)
Let me know what do you think about ideas presented in the book.
[image error]

July 7, 2012
LIBOR and US Dollar
The ongoing Libor scandal is interesting to watch for other reasons as well.
First, Libor is benchmark against all the debt-risk is priced. Ok, Us treasury yields are the main benchmark, but Libor performs quite similar function. What the scandal tells us is than since last so many years this benchmark was flawed. Therefore, real Libor must be something different and hence the risk linked to it must be adequately readjusted.
Second, how will you readjust the risk without knowing what the benchmark should be. In geometry a similar problem occurs when there is a change of origin. When axes or origin are/is changed the coordinates make no sense unless you know the coordinates of new origin as per the old axis. It creates a hell lot of confusion in the geometry class when this concept is taught. Same confusion can be caused in debt markets as well. Bankers will need to reprice the debt.
Same is true with US Dollar
We really don't know what is the real value of dollar but we know value of all other currencies relative to the dollar. So watch the Libor scandal unravel will point us to important lessons for dollar. So watch carefully!
My book "Subverting Capitalism & Democracy" is available on Amazon and Kindle.


![[image error]](http://4.bp.blogspot.com/-bGxq2oj7uKs/UBS4VsrUjEI/AAAAAAAAAhM/cIVYzBWIZ4Y/s1600/Picture%201.png)
![[image error]](http://1.bp.blogspot.com/-iQ1FcLzyRc8/UBS5x09W1jI/AAAAAAAAAhc/M_WCbiJu1JM/s1600/Picture%203.png)
![[image error]](http://2.bp.blogspot.com/-veB-wINNboU/UBS4YAwRWBI/AAAAAAAAAhU/Sh24zCZVcdM/s1600/Picture%202.png)