
Michael Roberts's Blog, page 36
August 1, 2021
The Austrian Business Cycle
The Austrian school of economics is outside the mainstream. The Austrians start from micro-assumptions. This is not the neoclassical view of rational, fully informed human agents, maximizing their utility and profits. On the contrary, human actions are speculative and there is no guarantee of success in investment. According to Karl Menger, the founder of this school of thought, the further out in time the results of any investment are, the more difficult it is to be sure of success. Thus it is easier to estimate the returns on investment for goods that are for immediate consumption than for those needed for capital goods. Saving rather than consumption is a speculative decision to gain extra returns down the road.
Austrians reckon that the cost of saving can be measured by the ‘market interest rate’, which prices the time involved in delivering future output from savings now. ‘Business cycles,’ as the Austrians call booms and slumps under capitalist production, are primarily caused by periodic credit expansion and contraction of central banks. Business cycles would not be a feature of a truly “free market” economy. As long as capitalists were free to make their own forecasts and investment allocations based on market prices, rather than by bureaucrats, there would be no business cycles. Cycles are due to the manipulation of credit by state institutions. This differs from the neoclassical/monetarist school, which sees recessions as minor interruptions from growth caused by imperfections in market information or markets—not busts caused by artificial credit booms.
The boom phase in the Austrian business cycle takes place because the central bank supplies more money than the public wishes to hold at the current rate of interest and thus the latter starts to fall. Loanable funds exceed demand and then start to be used in non-productive areas, as in the case of the boom 2002–2007 in the housing market. These mistakes during the boom are only revealed by the market in the bust.
The Great Recession was a product of the excessive money creation and artificially low interest rates caused by central banks that on that occasion went into housing. The recession was necessary to correct the mistakes and the malinvestment caused by interference with market interest rates. The recession is the economy attempting to shed capital and labour from where it is no longer profitable. No amount of government spending and interference will avoid that correction.
Crucial to the Austrian Business Cycle Theory (ABCT) is the notion of a “natural rate of interest” ie how much it would cost to borrow if it wasn’t for government interference. In ‘free markets’, the supply and demand for funds to invest will set a rate of interest that brings investment and savings into line, as long as the markets for funds are fully competitive and everybody has clear knowledge on all transactions.
Already, you can see that these assumptions are not realistic. Even if the assumption of perfect competition was realistic, there is no reason to think that there is one interest rate for an economy. Rather there is one rate for houses, another for cars, another hotel construction etc. This point was even accepted by the Austrian school guru, Fredrick Hayek, who acknowledged that there is no one ‘natural rate’ of interest.
But without one natural rate of interest, you can’t claim the government is forcing rates too low and therefore the theory crumbles. Yes, the central bank controls a component of the interest rate that helps determine the spread at which banks can lend, but the central bank does not determine the rates at which banks lend to customers. It merely influences the spread. Aiming at the Fed’s supposed “control” over interest rates misunderstands how banks actually create money and influence economic output.
The primary flaw in the Austrian view of the central bank has been most obvious since Quantitative Easing started in 2008. Austrian economists came out at the time saying that the increase in reserves in the banking system was the equivalent of “money printing” and that this would “devalue the dollar”, crash T-bonds and cause hyperinflation. None of this came about.
Marx denied the concept of a natural rate of interest. For him, the return on capital, whether exhibited in the interest earned on lending money, or dividends from holding shares, or rents from owning property, came from the surplus-value appropriated from the labour of the working class and appropriated by the productive sectors of capital. Interest was only a part of that surplus value. The rate of interest would thus fluctuate between zero and the average rate of profit from capitalist production in an economy. In boom times, it would move towards the average rate of profit and in slumps it would fall towards zero. But the decisive driver of investment would be profitability, not the interest rate. If profitability was low, then holders of money would increasingly hoard money or speculate in financial assets rather than invest in productive ones.
What matters is not whether the market rate of interest is above or below some ‘natural’ rate but whether it is so high that it is squeezing any profit for investment in productive assets. Actually, the main exponent of the ‘natural rate of interest’, Knut Wicksell conceded this point. According to Wicksell, the natural rate is “never high or low in itself, but only in relation to the profit which people can make with the money in their hands, and this, of course, varies. In good times, when trade is brisk, the rate of profit is high, and, what is of great consequence, is generally expected to remain high; in periods of depression it is low, and expected to remain low.”
The leading proponents of the Austrian School usually shy away from considering empirical evidence for their theory. For them, the logic is enough. But a reader of my blog recently sent me a bag of empirical studies that purport to prove that the Austrian school business cycle theory is correct: namely that when the market rate of interest is driven below the ‘natural rate’ there will be excessive credit expansion that will eventually lead to a bust and crisis.
In one of these studies, Austrian economist James Keeler proxies the market and ‘natural’ interest rates by using short- and long-term interest rates in yield curves. The natural rate of interest is proxied by the long-term bond yield, and if the short term rate remains well below the long term rate, credit will expand to the point when there is a bust. That happens when the short-term rate shoots up and exceeds the long or vice versa ie there is an inverse yield curve. This is what his empirical study shows. Indeed, JP Morgan reckons on this basis the current probability of a slump in the US economy within a year is about 40-60%.

But while it may be that an inverted yield curve correlates with recessions, all it really shows is that investors are ‘fearful’ of recession and act accordingly. The question is why at a certain point, investors fear a recession and and start buying long-term bonds driving down the yield below the short-term rate. Moreover, when you look at corporate bonds in the capitalist sector, there is no inverted curve. Longer-term corporate bonds generally have a much higher yield than short-term bonds.
Another Austrian study by Ismans & Mougeot (2009) examined four countries, France, Germany, Great Britain, and USA between 1980 and 2006. This found that “the maxima of the ratio of consumption expenditures to investment expenditures are often reached during the quarters of recession or during the quarters just after recessions. This observation corroborates the Austrian hypothesis of overinvestment liquidation marking crisis.” But again the study relies on short and long-term interest rates and argues that “the term spread inversions mark the turning points of the aggregate economic activity. When the term spread decreases, the structure of production becomes less roundabout as entrepreneurs reallocate resources away from production goods to consumption goods.” In other words, when short-term interest rates rise or long-term rates fall, investors stop investing in capital goods and business investment falls while consumption rises or stays the same. Again, why does the yield curve to start to invert? Which is the causal direction? Is it falling investment in productive goods and services that drives long-term yields down or vice versa?
Carilli & Dempster attempt to answer this query in another study by carrying out a Granger causality test on two chosen indices of the ‘natural interest rate’ : 1) the real growth rate in GDP 2) the personal savings-consumption ratio. But they find that there is a marked lack of correlation between interest rates and economic activity.
Indeed, there is little evidence that the rate of interest is the driving force of capitalist investment and the price signal that capitalists look for to make investment decisions. A recent study by Dartmouth College, found that:
“First, profits and stock returns both have strong predictive power for investment growth, persisting many quarters into the future. Second, interest rates and the default spread—our proxies for discount rates—are at best weakly correlated with current and future investment. In short, changes in profitability and stock prices appear to be much more important for investment than changes in interest rates and volatility.”
Similarly, the US Fed concluded in their own study that: “A fundamental tenet of investment theory and the traditional theory of monetary policy transmission is that investment expenditures by businesses are negatively affected by interest rates. Yet, a large body of empirical research offer mixed evidence, at best, for a substantial interest-rate effect on investment…., we find that most firms claim to be quite insensitive to decreases in interest rates, and only mildly more responsive to interest rate increases.”
Some economists in the Austrian school have tried to gauge when the tipping point into recession might be by measuring the divergence between the growth in credit and GDP growth (see Borio and White, Asset prices, financial and monetary stability, BIS 2002). Apparently, there is a point when credit loses its traction on economic growth and asset prices and then growth collapses. But why? The Austrians cannot answer this because they ignore the fundamental flaw in the capitalist process identified by Marx in his law of profitability.
What drives capitalist economies and capital accumulation are changes in profits and profitability. Economic growth in a capitalist economy is driven not by consumption as the Austrians claim, but by business investment. That is the swing factor causing booms and slumps in capitalist economies. And business investment is driven mainly by one thing: profits or profitability – not interest rates, not ‘confidence’ and not consumer demand. It is when the rate of profit starts to fall; and then more immediately, when the mass of profits turns down. Then the huge expansion of credit designed to keep profitability up can no longer deliver.


July 22, 2021
Global warming: planning not pricing
Carbon pricing and carbon taxes are now proposed by international institutions and mainstream economics as the main solutions to ending global warming and destructive climate change. For some time, the IMF has been pushing for carbon pricing as ‘a necessary if not sufficient’ part of a climate policy package that also includes investment in ‘green technology’ and redistribution of income to help the worst-off cope with the financial burden. The IMF is now proposing a global minimum carbon price — along the lines of the global minimum floor on corporate taxes which has recently secured agreement.
At the recent meeting of the G20 finance ministers, carbon pricing was endorsed as one of “a wide set of tools” to tackle climate change. Speaking at the Venice International Conference on Climate, Christine Lagarde, president of the European Central Bank, also underscored the need for carbon pricing, emphasising the importance of an “effective carbon price that reflects the true cost of carbon”. An agreed carbon price would then be a precursor to the establishment of a carbon border tax, which would serve as a tariff on imports from countries without carbon pricing. This would be an incentive for others to join the ‘coalition of the willing’.
The EU Commission announced what it calls ‘Fit for 55’ plan to achieve a carbon-neutral EU by 2050 and reduce carbon emissions by 55% below 1990s levels before the decade is out. Again, it looks to carbon pricing to achieve this, as well as carbon import taxes. The EU commission proposes gradually increasing minimum taxes on the most polluting fuels such as petrol, diesel and kerosene used as jet-fuel over a period of ten years. Zero-emissions fuels, green hydrogen and sustainable aviation fuels will face no levies for a decade under the proposed system. Paolo Gentiloni, Brussels economics commissioner, has called the reform a “now or never moment”.
It was no accident that the EU and G20 have turned to William Nordhaus, an American economist and Nobel laureate for economics advice on climate change. Nordhaus gave the keynote address at the Venice conference. He said that “It is a painful, painful realisation, but I think we need to face it: Our international climate policy, the approach we are taking, is at a dead end.” But what was Nordhaus’ answer to this dismal conclusion? He called for a “climate club” of countries willing to commit to a carbon price. “A key ingredient in reducing emissions is high carbon prices,” he said, adding that a “climate club” would have to impose a penalty tariff on countries that did not have carbon pricing in place. Nordhaus said such an approach would help solve the problem of ‘free riding’, which has plagued existing global climate agreements, all of which are voluntary.
Nordhaus has been a major advocate of a ‘market solution’ to climate change. Nordhaus has constructed so-called integrated assessment models (IAMs) to estimate the social cost of carbon (SCC) and evaluate alternative abatement policies. Nordhaus’ IAMs assume that the world economy will have a much larger GDP in 50 years so that even if carbon emissions rise as predicted, governments can defer the cost of mitigation to the future. In contrast, if you apply stringent carbon abatement measures eg ending all coal production, you might lower growth rates and incomes and so make it more difficult to mitigate in the future. Instead, according to Nordhaus, with carbon pricing and taxes we can control and reduce emissions without reducing fossil fuel production and consumption at source.
It is the tobacco/cigarette pricing and taxing solution. The higher the tax or price, the lower the consumption, without touching the tobacco industry. Leaving aside the question of whether smoking has really been eradicated globally by pricing adjustments, can global warming really be solved by market pricing? Market solutions to climate change are based on trying to correct “market failure” by incorporating the nefarious effects of carbon emissions via a tax or quota system. The argument goes that, as mainstream economic theory does not incorporate the social costs of carbon into prices, the price mechanism must be “corrected” through a tax or a new market. But as a recent essay pointed out, the problem is that climate change is not one market failure (like tobacco) but several: in capitalist transport, energy, technology, finance and employment.
Economists who have attempted to calculate what the ‘social price’ of carbon should be have found that there are so many factors involved and the pricing must be projected over a such a long time horizon that it is really impossible to place a monetary value on the ‘social damage’– estimates for the carbon price range from $14 per ton of CO2 to $386! “It is impossible to approximate the uncertainties in low-probability but high-damage, catastrophic or irreversible outcomes.” Indeed, where carbon pricing has been applied, it has been a miserable failure in reducing emissions, or in the case of Australia, dropped by the government under the pressure of energy and mining companies.
And while there is much talk about raising carbon emission prices, little or nothing is said about the huge subsidies that governments continue to make to fossil fuel industries. EU Commissioner Gentiloni admitted as such: “Paradoxically, [the current energy taxation directive] is incentivising fossil fuels and not environmentally friendly fuels. We have to change this.”
The G20 countries have provided more than $3.3tn (£2.4tn) in subsidies for fossil fuels since the Paris climate agreement was sealed in 2015, a report shows, despite many committing to tackle the crisis. The report says all 19 G20 member states continue to provide substantial financial support for fossil-fuel production and consumption – the EU bloc is the 20th member. Overall, subsidies fell by 2% a year from 2015 to reach $636bn in 2019, the latest data available.

But Australia increased its fossil fuel subsidies by 48% over the period, Canada’s support rose by 40% and that from the US by 37%. The UK’s subsidies fell by 18% over that time but still stood at $17bn in 2019, according to the report. The biggest subsidies came from China, Saudi Arabia, Russia and India, which together accounted for about half of all the subsidies.
The report found that 60% of the fossil fuel subsidies went to the companies producing fossil fuels and 40% to cutting prices for energy consumers. A recent report by the International Institute for Sustainable Development concluded that reforming fossil fuel subsidies aimed at consumers in 32 countries could reduce CO2 emissions by 5.5bn tonnes by 2030, equivalent to the annual emissions of about 1,000 coal-fired power plants. It said these changes would also save governments nearly $3tn by 2030. The International Energy Agency’s road map for net-zero emissions by 2050 calls for a 6 per cent decline in coal-fired generation annually. Yet coal will grow by almost 5 per cent this year, and another 3 per cent in 2022, hitting a new peak.
Nordhaus is right. Current climate change policies are at a dead end and the impact of climate change and environmental destruction is getting worse by the day. Earthquakes, storms, floods and droughts — the number of recorded loss events resulting from natural disasters – has been increasing for some years now.

The report also examined how G20 countries were putting a price on carbon pollution. It found that more than 80% of emissions were covered by such prices in France, Germany and South Africa. In the UK, 31% of emissions are covered but the UK has one of highest carbon prices at $58 per tonne of CO2. Just 8% of US emissions are covered and at the low price of $6 per tonne. Russia, Brazil, and India do not have any carbon prices. In his address to the G20, Nordhaus showed that the current average global carbon price is under $2 and 80% of global emissions have no carbon emissions pricing market at all!

So the carbon pricing and taxation solution, even if it worked to lower emissions, is a pipedream as it can never be implemented globally before global warming reaches dangerous ‘tipping points’. All the latest climate science suggests that the tipping points are approaching fast and allowing fossil fuel production to continue while trying to reduce its use by ‘market’ solutions’ like carbon pricing and taxes will not be enough. Even the IMF has admitted that market solutions have not worked.
Market solutions are not working because for capitalist companies it is just not profitable to invest in climate change mitigation: “Private investment in productive capital and infrastructure faces high upfront costs and significant uncertainties that cannot always be priced. Investments for the transition to a low-carbon economy are additionally exposed to important political risks, illiquidity and uncertain returns, depending on policy approaches to mitigation as well as unpredictable technological advances.” (IMF)
Indeed: “The large gap between the private and social returns on low-carbon investments is likely to persist into the future, as future paths for carbon taxation and carbon pricing are highly uncertain, not least for political economy reasons. This means that there is not only a missing market for current climate mitigation as carbon emissions are currently not priced, but also missing markets for future mitigation, which is relevant for the returns to private investment in future climate mitigation technology, infrastructure and capital.” In other words, it ain’t profitable to do anything significant.
What is the alternative? Mark Carney, former Bank of England governor and climate change envoy for the UN and many multi-nationals, reckons it is ‘regulation’. “We need clear, credible and predictable regulation from government,” he said. “Air quality rules, building codes, that type of strong regulation is needed. You can have strong regulation for the future, then the financial market will start investing today, for that future. Because that’s what markets do, they always look forward.”
Carney’s answer is really an excuse for continuing to expand fossil fuel production. Although the IEA recently said that the world was to stay within 1.5C Paris target increase in global heating, there could be no more exploration or development of fossil fuel resources, Carney argues that countries and companies could still carry on exploiting fossil fuels, if they use technology such as carbon capture and storage, or other ways of reducing emissions. “With the right regulation, with a rising carbon price, with a financial sector that is oriented this way, with public accountability of government, of financial institutions, of companies, yes, then we can, we certainly have the conditions in which to achieve [holding global heating to 1.5C“.
This is disingenous nonsense. Carbon pricing schemes just hide the reality that, as long as the fossil fuel industry and the other big multinational emitters of greenhouse gases are untouched and not brought into a plan for phasing them out, the tipping point for irreversible global warming will be passed. Instead of waiting for the market to speak, and for ‘regulation’, we need a global plan where fossil fuel industries, financial institutions and major emitting sectors are brought under public ownership and control.
Who are the biggest emitters or consumers of carbon apart from the fossil fuel industry? It is the richest wealth and income earners in the Global North who have excessive consumption and fly everywhere. It is the military (the biggest sector of carbon consumption). The waste of capitalist production and consumption in autos, aircraft and airlines, shipping, chemicals, bottled water, processed foods, unnecessary pharmaceuticals and so on is directly linked to carbon emissions. Harmful industrial processes like industrial agriculture, industrial fishing, logging, mining and so on are also major global heaters, while the banking industry operates to underwrite and promote all this carbon emission.
A global plan could steer investments into things society does need, like renewable energy, organic farming, public transportation, public water systems, ecological remediation, public health, quality schools and other currently unmet needs. And it could equalize development the world over by shifting resources out of useless and harmful production in the North and into developing the South, building basic infrastructure, sanitation systems, public schools, health care. At the same a global plan could aim to provide equivalent jobs for workers displaced by the retrenchment or closure of unnecessary or harmful industries. Planning not pricing.
July 11, 2021
Capitalism: has the leopard changed its spots?
“Let me be clear: capitalism without competition isn’t capitalism. It’s exploitation.”, US President Biden tweeted when signing an executive order to expand competition across the economy and crack down on monopolistic practices, describing a misguided 40-year “experiment” in letting US corporations consolidate with little regulation that he said has hurt ordinary Americans. “The heart of American capitalism is a simple idea: open and fair competition,” Biden said in a speech before signing the measure. He called himself a “proud capitalist” but said that he wants to “ensure our economy isn’t about people working for capitalism, it’s about capitalism working for people.”
Biden’s remarks supported the idea that: 1) capitalism is not a mode of production that is exploitive, as long as there is ‘free competition’ in trade, credit and the production of commodities (and presumably in wage labour too); and 2) it is monopoly and monopoly practices that are the cause of what could be called ‘exploitation’ because only then is there ‘unfair competition’ and blockages to the equitable process of production and distribution through ‘competitive’ markets, that is proper capitalism.
Here Biden echoes not only the view of the modern mainstream neo-classical economics but also the views of the early classical economists, like Adam Smith and David Ricardo. Smith reckoned that what was wrong with the society and economy of the late 18th century was monopoly and the lack of free competition and trade. He railed against monopoly control (including feudal state monopolies) in trade and agriculture. Ricardo also saw the problem in monopoly control of land ownership and agricultural production and trade by landlords. If that was broken, then industrial enterprise in competitive markets would lead to rising productivity and prosperity for all. As Biden said, then “capitalism would work for the people”.
But it is not just the apologists for capitalism that accept this analysis. Many modern-day Marxists and post-Keynesians focus on what they call ‘monopoly capitalism’, ‘monopoly finance capital’, or ‘state monopoly capitalism’ as the enemy of the people’s prosperity, not capitalism as such.
Take the view of Michael Hudson. He considers himself a classical’ economist like Smith and Ricardo (and Marx is also a classical economist, he says). Hudson argues that capitalism started as a progressive force in developing the productive forces because it was industrial capitalism. But since the 1980s, ‘financial capitalism’ had superseded industrial capitalism. This was really a return to ‘feudalism’ where the surplus in an economy was extracted by ‘monopoly’ landlords (rent) and financiers (interest and capital gains), not created by the exploitation of labour power (profits).
Grace Blakeley, British leftist economist and author, in her recent presentations, reckons that modern capitalism has morphed into ‘state monopoly capitalism’. She highlights similar points made by Biden in his case for ‘competition’: “by May 2020, the combined market capitalization of the four largest US tech companies reached one fifth of the entire S&P 500. Four companies – Microsoft, Apple, Amazon and Facebook – now account for 20 per cent of the combined value of the 500 largest US corporations – an unparalleled level of market concentration. Forty years ago, these corporate entities were either just beyond being plucky start-ups or did not even exist. Monopolistic tendencies are not limited to the tech sector. In 1975, the largest 100 US companies accounted for nearly half of the earnings of all publicly listed companies; by 2015, their share reached 84 per cent.”
Similarly, a Brookings Institution study found that the top 50 companies globally by value added $4.5 trillion of stock market capitalization in 2020, taking their combined worth to about 28% of global gross domestic product. Three decades ago, the equivalent figure was less than 5%.

But is this state monopoly ‘feudal’ financial capitalism now the enemy of labour while freely competitive industrial capitalism is an ally? Is there no exploitation of labour under competitive capitalism, as Biden argues? The whole point of Marx and Engels’ critique of capitalism was that it was a system of exploitation of labour power to extract surplus value in production, whether there were monopolies or not. Indeed, Marx’s Capital has a subtitle, ‘A critique of political economy’, precisely to attack the idea that, once monopolies were curbed or removed, that ‘competitive capitalism’ does not exploit labour and instead workers get a fair day’s pay for a fair day’s work and capitalists are thus rewarded for their competitive ‘animal spirits’ with profits.
It is certainly true that the concentration and centralisation of capital in the major economies has intensified in recent decades. The rise of the mega social media and tech companies in the last two decades confirms Marx’s view over 150 years ago that capitalist accumulation leads to increased concentration and centralisation of capital, as corporate operations increase in scale and large firms eat up the small. And it is clear that in recent decades, this process has been encouraged and helped by state injections of easy credit and the de-regulation of corporate activities and governance.
The Brookings Institution found that multinationals are major contributors to the US economy. US-headquartered MNCs accounted for 20.1 percent of all US private sector employment in 2017 and foreign-headquartered firms accounted for another 6.4 percent. Multinationals play a particularly large role in manufacturing: more than 70% of all US manufacturing employment is in MNCs. Multinational firms accounted for more than half of all non-residential capital expenditures in 2017 and more than 80 percent of all industrial R&D done in the US. And multinationals account for more than half of US exports and imports of goods and services.

As Hadas Thier in her book, A People’s Guide to Capitalism, points out: “The state plays its part, too, in shielding monopolistic companies deemed “too big to fail” from the ravages of a competitive “free” market. After the 2008 economic crisis, megabanks in the United States, each holding billions of dollars’ worth of assets, were rescued with an enormous taxpayer-funded bailout. As Petrino DiLeo explained: “The Treasury Department and Federal Reserve Bank have doled out an incredible $16 trillion in assistance to financial institutions and corporations in the US and around the world . . . Through the various mechanisms, Citigroup borrowed $2.5 trillion, Morgan Stanley took $2 trillion, Merrill Lynch received $1.9 trillion, and Bank of America got $1.3 trillion.” (p134).
Thier continues “centralization supplements the work of accumulation by enabling industrial capitalists to extend the scale of their operations. Whether this latter result is the consequence of accumulation or centralization, whether centralization is accomplished by the violent method of annexation—where certain capitals become such preponderant centres of attraction for others that they shatter the individual cohesion of the latter and then draw the separate fragments to themselves—or whether the fusion of a number of capitals already formed or in process of formation takes place by the smoother process of organizing joint-stock companies—the economic effect remains the same.”
“The battle of competition is fought by the cheapening of commodities . . . and this depends in turn on the scale of production. Therefore, the larger capitals beat the smaller. It will further be remembered that, with the development of the capitalist mode of production, there is an increase in the minimum amount of individual capital necessary to carry on a business under its normal conditions. . . [Competition] ends in the ruin of many small capitalists, whose capitals partly pass into the hands of their conquerors, and partly vanish completely.”
But do these long-term developments in capitalist accumulation mean that ‘competitive capitalism’ has now been replaced by ‘state monopoly capitalism’? So the latter now operates not through the competitive struggle for profits out of the exploitation of labour, as in the law of value, and instead operates through the power to mark up prices over costs at will, backed by the state.
This is the basis of the ‘monopoly capital school’ originally developed by Paul Sweezy and Paul Baran in the late 1960s. This monopoly capital theory argued that large companies had abolished price competition and instead given rise to excess productive capacity and stagnation. Crises were no longer caused by falling profitability (if they ever were) as a result of a struggle between capitals for a share of the profit exploited from labour, but now were caused by the expansion of capacity without sufficient ‘effective demand’.
In their book, Monopoly Capital, Baran and Sweezy put it this way: “we cannot be content with patching up and amending the competitive model which underlies his [Marx’s] economic theory. We must recognize that competition, which was the predominant form of market relations in nineteenth-century Britain, has ceased to occupy that position, not only in Britain but everywhere else in the capitalist world. Today the typical economic unit in the capitalist world is not the small firm producing a negligible fraction of a homogeneous output for an anonymous market but a large-scale enterprise producing a significant share of the output of an industry, or even several industries, and able to control its prices, the volume of its production, and the types and amounts of investments. The typical economic unit, in other words, has the attributes which were once thought to be possessed only by monopolies. It is therefore impermissible to ignore monopoly in constructing our model of the economy and to go on treating competition as the general case. (Baran & Sweezy 1968, 5–6)
Baran and Sweezy conclude: “The whole motivation of cost reduction is to increase profits, and the monopolistic structure of markets enables the corporations to appropriate the lion’s share of the fruits of increasing productivity directly in the form of higher profits. This means that under monopoly capitalism, declining costs imply continuously widening profit margins. And continuously widening profit margins in turn imply aggregate profits which rise not only absolutely but as a share of national product. If we provisionally equate aggregate profits with society’s economic surplus, we can formulate as a law of monopoly capitalism that the surplus tends to rise both absolutely and relatively as the system develops.” (Baran & Sweezy 1968, 71–72)
By substituting the law of rising surplus for the law of falling profit, we are therefore not rejecting or revising a time-honoured theorem of political economy: we are simply taking account of the undoubted fact that the structure of the capitalist economy has undergone a fundamental change (my emphasis) since that theorem was formulated. What is most essential about the structural change from competitive to monopoly capitalism finds its theoretical expression in this substitution. (Baran & Sweezy 1968, 72)
But does the increased centralisation and concentration of capital mean that there has been ‘a fundamental change’ in the nature of capitalism from a competitive battle for profit share to one of monopoly power; and from value production and distribution of profit to a monopoly mark-up over costs?
Anwar Shaikh thinks not. “If you believe that the system is founded on monopoly — which has become a sacred nostrum of Marxian economics — then it’s all about the power of the state and the power of capital against labor.” But “From my point of view, nothing — not even the capitalists themselves — has that sort of power, because the rules imposed on labor and capital stem from the creation of profit and the competition of capitals, which Marx specifically links to each other. A state can intervene to redistribute income and oppose both capital and labor. Pushed by the struggles of workers, it can also intervene to construct a welfare system. But these interventions are still fundamentally constrained by their impact on the profitability of firms.”
Shaikh argues that the monopoly capital school base their view of ‘fundamental change’ on a false reality that back in the mid-19th century when Marx wrote Capital, that capitalism worked in ‘perfect competitive markets’ which now longer exist and have been replaced by monopolies backed by the state. But this was never the case. As Shaikh puts it: “the capitalist economy should not be viewed as a “perfect” market economy with accompanying “imperfections”, but as individual capitals in competition to gain profit and market share. Monopoly should not be counterposed to competition, as neoclassical, orthodox, and even some Marxist economists do. Real competition is a struggle to lower costs per unit of output in order to gain more profit and market share. In the real world, there are capitals with varying degrees of monopoly power competing and continually changing as monopoly power is lost with new entrants to the market and new technology that cuts costs. Real competition is an unending struggle for monopoly power (dominant market share) that never succeeds in total or forever: “each individual capital operates under this imperative…this is real competition, antagonistic by nature and turbulent in operation. It is as different from so-called perfect competition as war is from ballet”. So capitalism may have changed its spots; but is still the same leopard.
As Thier points out “capitalism still maintains its dynamism through the constant jostling for market positioning by large and small companies. In some cases, a newer business, not so deeply entrenched in outmoded methods, could come out ahead. Thus a dozen years ago Bill Ford (of that “family-owned business,” Ford Motor Company) could say of the new auto company, Tesla, that it had little chance of staying alive. As the Financial Times explained, Ford assumed that “the complexity of the global supply chain and international regulation requirements made it all but impossible to launch an important new carmaker from scratch.”
A decade later, the “Big Three” American automakers are mired in over-supplied markets and old technologies. It is yet to be determined what kind of long-term success Tesla will fare, but no doubt, the established auto industry is nervous. Other “disruptive” companies exist in every field, from Uber and Airbnb, to internet-based homecare agencies and furniture stores that challenge the dominance of conventional brick and mortar enterprises. If this were not the case, we would see the economy increasingly dominated by fewer and fewer companies, until one day we found ourselves with a single McGoogleAzon Corporation that ran everything from our dishwashers to our morning commutes. Instead, competition continues, but within a context of ever-greater economic players, which make the shifts, rivalries, and bankruptcies all the more volatile.”
Lenin was supposed to be one of the great supporters of the view that capitalism had become ‘state monopoly capitalism’, regularly quoted by the leaders of Stalinist Russia as the 20th century model for capitalism. But Lenin actually had a more accurate view: “At the same time monopoly, which has grown out of free competition, does not abolish the latter, but exists over it and alongside of it, and thereby gives rise to a number of very acute, intense antagonisms, friction and conflicts.”
And when we look at the empirical evidence, the surface appearance of ‘monopoly power’ looks less convincing. Mainstream economists, Jan De Loecker and Jan Eeckhout argue that the markup of price over marginal cost charged by public US firms has been rising steadily since 1960 and in particular after 1980. The paper suggests that that the decline of both the labor and capital shares, as well as the decline in low-skilled wages and other economic trends, have been aided by a significant increase in markups and market power – in other words the rise of monopoly capital in the form of ‘super-star’ companies like Apple, Amazon, Google etc that now dominate sales, profits and production and where the utilisation of labour is low compared to other companies and industries. These monopolies won’t invest because they don’t need to compete, and so productivity growth slows.
However, there are two things against this ‘market power’ argument, at least as the sole or main explanation of the rise in profits share and profit per unit of production. First, as De Loecker and Eeckhout find, economy-wide, it is mainly smaller firms that have the higher markups – hardly an indicator of monopoly power. And as Shaikh points out, rising mark-ups may not be due to monopoly power but simply due to higher profits from cost savings by large companies. Indeed, when the factor of concentration is isolated in the data, “in the vast body of literature generated by the investigation of such claims, difference between accounting rates of return are too small to justify claims of monopoly power”. (Shaikh).
Moreover, although US multi-nationals have gained greater market share in the last 40 years, that has not meant a reduction in their share of capital spending – contrary to the ‘stagnationist’ conclusions of the monopoly school. US multinational parent companies employed 24 percent of the U.S. private sector workforce in 1982 and 22 percent in 2017. Their share of investment stayed at about 30-35% throughout.

And they still do the bulk of R&D spending.

Anyway, there are very few real monopolies. What concentration and centralisation of capital has generated are oligopolies, not monopolies, in different sectors of the capitalist economy – and that makes a big difference. Indeed, monopolies have often turned into oligopolies. In 1911, Standard Oil was broken up into 34 companies by the US Congress. In the 1984, AT&T was the main ‘monopoly’ telecoms provider and was broken up into seven regional companies.
By its very nature, capitalism, based on ‘many capitals’ in competition, cannot tolerate any ‘eternal’ monopoly, a ‘permanent’ surplus profit deducted from the sum total of profits which is divided among the capitalist class as a whole. The endless battle to increase profit and the share of the market means monopolies are continually under threat from new rivals, new technologies and international competitors. Profits are not the result of the degree of monopoly or rent seeking, as neo-classical and Keynesian/Kalecki theories argue, but the result of the exploitation of labour. Marx’s law of profitability is still central to a capitalist economy.
Just before the COVID-19 pandemic hit the world economy, the major capitalist economies were already heading into a new recession, the first since the Great Recession of the 2008-9. The profitability of capital was near all-time lows; up to 20% of US and European companies were making only enough profit to cover the interest on their debt, with none to spare for new investment. Real GDP growth rates had dropped to their lowest rates since 2009 and business investment was stagnating. A global recession was coming; and it had little to do with the ‘market power’ of the FAANGs sucking up all the profits; much more to do with the inability of capital to exploit labour enough to stop profitability across all sectors from falling..
The history of capitalism is one where the concentration and centralisation of capital increases, but competition continues to bring about the movement of surplus value between capitals (within a national economy and globally). The substitution of new products for old ones will in the long run reduce or eliminate monopoly advantage. The monopolistic world of GE and the motor manufacturers in the post-war period did not last once new technology bred new sectors for capital accumulation. The oil giants are also now under threat from new technology. The world of Apple will not last forever.
July 6, 2021
Marx’s reproduction schema
Recently, I made a short presentation to a discussion group of the Communist Party of India (M) youth on Marx’s reproduction schema. I thought the subject might also be worth a post on my blog.
Marx’s reproduction schema are to be found in Capital Volume Two Part 3 chapters 18 to 21. What are these reproduction schema? It is, as Marx put it, about: “the process of circulation (which in its entirety is a form of the process of reproduction) …. of aggregate social capital.” In other words, how capital (money and commodities) circulates at the macro level of an economy, in order to reproduce itself so that a new period of production and accumulation of capital can recommence.
Marx shows this process of circulation and reproduction by dividing aggregate social capital into two departments: one that reproduces capital goods or means of production and one that reproduces consumer goods or means of consumption. There could be more departments, but Marx’s division is not arbitrary because he wants to show the class nature of capitalist accumulation and reproduction; with one department that produces capital’s means of production and one that produces labour’s necessary consumer goods. The latter can be divided further into a ‘luxury goods’ department for capitalists’ own consumption, but this sub-department is not analytically essential in Marx’s reproduction schema (contrary to the views of many neo-Ricardians and some Marxists).
What does Marx want to show with the reproduction schema? He wants to show: first, how capital reproduces itself in these two departments; and second, he wants to compare the reproduction of capital without any extra accumulation (called simple reproduction) and the reproduction of capital when it accumulates (grows), which he calls expanded or extended reproduction.
The schemes assume that there is no technological progress, so growth (expanded reproduction) can occur only if a greater amount of means of production is obtained. Marx’s schemes also assume a closed economy. So additional means of production cannot be had from any reserves held in warehouses etc.
In simple reproduction, Department I (means of production) and Department II (means of consumption) grow at the same (zero) rate. Below is a table taken from the excellent paper on the schema by Andrew Kliman, drawing on the work of Dunayevskaya.

In this example of simple reproduction, both departments are the same size. But where does Department II (consumer goods) get its means of production in order to produce consumer goods equivalent to 500 in value? The consumer goods capitalists in Department II need 250c in value of means of production. The answer is that the consumer goods capitalists buy their 250c means of production from the capital goods capitalists in Department I. And that is possible because it is the amount of new value produced by the capital goods capitalists in Department I (v100+s150). Thus we have the formula for simple reproduction: c2 = v1+ s1. This shows how capital circulates between the two departments in a zero-growth economy.
But what about a growing economy, what Marx called extended or expanded reproduction? Growth in a closed economy is only possible if extra value is added to investment in means of production. So Department I must be larger. That can happen if some of the newly produced means of production that Department II would have obtained are instead diverted to Department I. This gives Department I the additional means of production it needs.
In Kliman’s example, Department I gets an extra 50c in means of production and Department II’s investment in means of production is reduced by that amount. As a result, given the same ratios for c/v and s/v, production rises in Department I to 600 and falls in Department II to 400. See Year 2 below.

In the following Year 3, the 600 previously produced in means of production is distributed in the same ratio between Departments I and II as in Year 2. Now both departments have more invested in means of production and so both can grow (in total from 1000 in value in Year 2 to 1200 in Year 3.
The transition from simple to expanded reproduction requires unbalanced growth. Department I must grow relative to Department II. That does not mean that the consumer goods sector must decline absolutely, except maybe when ‘starting from scratch’ with zero growth. Subsequently, Department II can grow. Indeed, the two departments could then grow at the same rate, as they do in Marx’s own examples of expanded reproduction. But the relative imbalance will persist. Department I will remain relatively larger than Department II under expanded reproduction than under simple reproduction. Thus Marx’s schema show that the departments are never in ‘equilibrium’ if we mean by that that they are both the same size and must grow together at the same pace.
Marx developed the reproduction schema not to show that the capitalism can accumulate harmoniously or in equilibrium. This idea was the view adopted by Marxists after Marx, such as Bauer and Kautsky, who took the reproduction schemas to show that undisturbed accumulation can take place under capitalism and crises could be avoided. Hilferding concluded that crises were due to disproportionalities between Departments 1 and 2 but these could be avoided by thorough planning: “in capitalist production both reproduction on a simple as well as on an extended scale can proceed undisturbed if only these proportions are maintained’. Then capitalism could grow without crises.
Rosa Luxemburg also misunderstood Marx’s schema but from the opposite view. She thought the imbalance between the size of Department I and Department II over time was the cause of crises because consumption would be insufficient to realise all the production of capital goods. She thought here was a chronic imbalance of investment over consumption that Marx did not recognise and this was key to crises.
But Marx’s reproduction schema were not designed to show that capital can either accumulate harmoniously, or alternatively generate chronic crises of under-consumption. Yes, capital does not accumulate in a harmonious way. As Marx says, “demand and supply never coincide or if they do, only by chance and thus not to be taken into account or for scientific purpose, it should be considered as not having happened.” That means that are “so many possibilities of crises, since a balance is itself an accident owing to the spontaneous nature of this production”. But if supply grows faster in Department I than in Department II, that does not imply a chronic, secular shortfall in effective demand, as Luxemburg thought. Investment demand can grow faster than consumer demand without crises.
Marx’s simple reproduction requires a “balance” (an equality) between the new value generated in Department I (vI + sI) and Department II’s demand for constant capital (c2). But expanded reproduction requires that the new value generated in Department I exceeds Department II’s demand for constant capital. As Lenin put it: “Marx demonstrated clearly in his schemes, the production of the means of production can and must outstrip the production of articles of consumption.” Contrary to Luxemburg’s conclusion of crises flowing from the imbalance, Marx took the opposite view that the imbalance was necessary for growth, otherwise, “there would be no capitalist production at all if it had to develop simultaneously and evenly in all spheres.”
Indeed, an expanding capitalist economy with a larger Department I than Department II expresses the general law of capitalist accumulation, namely a faster rise in constant capital over variable capital, or a rising organic composition of capital. “Accumulate, accumulate! That is Moses and the prophets! … Accumulation for the sake of accumulation, production for the sake of production: this was the formula in which classical economics expressed the historical mission of the bourgeoisie in the period of its domination. Thus the capitalist economy increasingly becomes a system of production for production’s sake.” As Marx says: “It will never do, therefore, to represent capitalist production as something which it is not, namely as production having for its immediate purpose the consumption of goods or the production of means of enjoyment, for capitalists. This would be overlooking the specific character of capitalist production.”
Actually, Luxemburg herself saw the relation between the imbalance in the reproduction schema and the rising organic composition of capital and thus Marx’s law of profitability: “The quicker growth of Department I as against Department II is beyond dispute …. It is the foundation also of Marx’s fundamental law that the rate of profit tends to fall.” Exactly! But she failed to recognise was that this meant the cause of crises lay in the profitability of capital, not in the imbalance between the departments of reproduction of capital. The reproduction schema abstract from the cause of crises as such, which, in Marx’s theory, is to be found in the factors driving falling profitability, namely labour-saving technological changes and the concomitant increases in productivity.
Indeed, when you think about it, the reproduction schema show the very nature of economic growth namely, using more of the value produced in the previous period to invest in extra means of production and labour to increase total value in the new period. That’s the logic of the schema and empirically it’s the reality. Kliman provides evidence that in the US, investment demand was 72 times as large as in 1933, while GDP was only 18 times as large and personal consumption demand was only 15 times as large (see graph below).

Indeed, as Kliman says, the reproduction schemes provide a model for the so-called “take-off” process in industrialisation as experienced in early 19th century Britain, late 19th century Japan and early 20th century Russia. In each case the immediate result is that the benefits of rising production do not mostly go to the classes that would consume, ie peasants or wage earners, but instead into the profits of capitalists (Britain) or into a state surplus (Soviet Union), where the proceeds are used for further capital formation. So the reproduction schema can be applied to understanding the process of growth in both capitalist and planned economies (‘primitive socialist accumulation’).
You would expect a fast-growing economy to have faster growth in investment than consumption. But that does not mean consumption will not rise also. On the contrary, as investment delivers more value, consumption can also expand more quickly than in economies with low investment and GDP growth. A good example of this is China’s ‘take-off’. China has had a very high investment to GDP ratio (graph below).

Mainstream economists, especially Keynesians, reckon that this is bad news for workers’ consumption and needs to be reversed. They base their case on China’s supposedly low personal consumption to GDP ratio compared to the advanced capitalist economies. But that’s not really true. If you strip out private health spending from the US consumption ratio to GDP (see graph below) and on the other hand add various social consumption spending (health, education, transport, etc) to China’s personal consumption ratio, the supposed gap to the US and other G7 countries is narrowed considerably.

Moreover, contrary to the Keynesian argument, personal consumption growth in China has been way faster than in any advanced capitalist economy in the last ten years. Why? Because investment and GDP growth has been much faster.

China’s huge ‘imbalance’ of investment in capital goods compared to consumption may have restricted wage growth, but not compared to countries that have not invested and grown as fast. In the 2010s, wage growth in China rose 73%, compared to India at 43%, the US at 11% and the UK at just 3%.

Indeed, even mainstream growth models reach the same conclusion as in Marx’s reproduction schema. In the Keynesian-style Harrod-Domar growth model, full employment and maximum growth potential require that investment in each period be greater than savings in the previous year. Domar comments that the model shows “that it is not sufficient, in Keynesian terms, that savings of yesterday be invested today, or . . . that investment offset saving. Investment of today must always exceed savings of yesterday.”
The Keynesian growth model talks of the ‘savings function’; for Marx, savings are profits because workers do not save, so there is a class aspect to his reproduction model. For Marx, the rate of growth of the economy depends on the proportion of surplus value that is accumulated rather than spent on capitalists’ consumption; on the rate of exploitation of labour producing the surplus value and on the organic composition of capital, setting the relative investment of profits into technology or labour. The Keynesian Harrod-Domar model is similar. Here the growth rate depends on the “marginal propensity to save” (in Marxist terms, the amount of profits reinvested) and the productivity of that investment (in Marxist terms, the rate of profit). Most important, in both models it is the previous period’s savings (profits) that sets the level of investment in the next period.
But there is an important difference between the Keynesian growth model and that of Marx. In both models, for growth, investment must outstrip consumption; but for Marx, under capitalism, that investment growth depends on profitability, while in a post-capitalist economy, investment depends on state planning decisions. Keynes makes no such distinction and thus ignores the real cause of crises in capitalism.
July 1, 2021
Chinese Communist Party: a party of workers or capitalists?

It’s 100 years today since the Chinese Communist Party (CCP) was first formed by just 50 members, mostly intellectuals, but including railway and mine workers. 100 years later to the day, the official membership figure is 95m and there are 4.8m party branches. This is surely the largest political party the world has ever seen. A quarter of the membership is under 35 years; 29% are female, up from 12% in 1949 and over half of members have college degrees (that means half don’t!).
In 2021, is the CCP a party of and for capitalists or of and for workers? The short answer is that it is neither. But the long answer is more complex.
The CCP was led at first by two intellectuals, Chen Duxiu and Li Dazhao, with the help of the Communist International (Comintern). These leaders saw the CCP as the party for the Chinese working-class (tiny as that was), modelled on the Bolshevik party in the Soviet Union. For them, the working-class was the agent of change and revolution in China, not the peasantry that constituted 90% of the population. Nevertheless, the CCP did lead various peasant movements in 1925-27 period.
But the Comintern ordered the CCP leaders to work with the nationalist bourgeois forces including Chiang Kai-Shek, who defeated various regional warlords. In 1927, the CCP through workers uprisings seized control of Shanghai, China’s most industrialised city. Chiang entered the city and massacred the CCP activists. Chiang then ordered the murders of CCP leaders in Beijing including Li. The CCP leaders fled to Wuhan where there was a supposedly ‘left nationalist’ government. But the Wuhan government declared support for Chiang and massacred more CP members.
The CCP was forced into the countryside and opted to build a peasant-based guerrilla army in the countryside (it really had no choice). Chen went into opposition for which he was expelled from the CCP by the Comintern and ended his life in obscurity. Mao’s CCP then fought a long and hard struggle against the Japanese invasion, Chang Kai-Shek’s forces and foreign intervention, before triumphing in 1949 and occupying the cities, ruthlessly brooking no opposition from outside or within the party or from independent workers organisations in the cities.
Even from this short, potted history, it is clear that the CCP lost its base in the working class after the defeats of the 1920s and became bureaucratised in the long guerrilla struggle. Although its members were mainly peasants, its leadership were intellectuals, on the whole. But neither was the CCP ever a party of the bourgeois, who on the contrary fled in numbers to Taiwan (Formosa).
But what is the composition of the CCP now? There is an excellent new study of the social composition of the party membership, recently published on the World Inequality Database by Li Yang, Filip Novokmet and Branko Milanovic. It’s entitled “From workers to capitalists in less than two generations: a study of Chinese urban elite transformation between 1988 and 2013”.
Actually, the empirical evidence offered does not confirm the title of this paper. The CCP after 100 years may not be mainly composed of workers (or at least industrial workers and farm labourers), but neither it is composed of owners of businesses.
Using household surveys covering the period 1988-2013, the authors study the changes in the characteristics of the richest 5% of China’s urban population. This top 5% of income earners the authors define as the ‘elite’ in China (“Elites can be defined as individuals and small, relatively cohesive and stable groups with major decisional power.”)
The CPP has lost its majority peasant base that it had before major urbanisation began in the 1980s. But the study shows that the CCP is still not dominated by business owners, large or small, but increasingly by ‘professionals’ and even this layer is still a minority. Professionals are defined as “all the professional and technical personnel working in science-related sectors (e.g., science, engineering, agriculture, medical care) and social science-related sector (e.g., economics, finance, law, education, press and publication, religion)”.
Actually, these are workers – at least when related to the means of production. Indeed, they are better designated as ‘professional workers’. This professional layer constituted 25% of the overall CCP membership in 2013 (little changed since 1988). The official 2021 figure is now 27%. But that ratio is much higher among the party ‘elite’ (the top 5% of earners who are CCP members): the professional layer is 38% of the ‘elite’ party members, up from 28% in 1988.

Actually, on the data, the social composition of the overall party membership is little changed in 2013 from 1988. Workers were 16% of membership in 1988, but constituted 30% in 2013 (the official 2021 figure is now 34%), thanks to urbanisation and industrialisation. Adding in clerical workers and government officials, then these three groups were 75% of the members in 1988 and were still 70% in 2013. What is also noticeable is that the share of outright capitalists (owners of businesses etc) was tiny in 1988 and was still only 3% of CCP members in 2013.
What is different is the social composition of the ‘elite’ party members. Workers and government officials were 72% of this layer of members in 1988, little different from their share of the overall membership. But in 2013, that share had fallen to 57%, as the share of professionals and the bourgeois had risen to 43%. The ‘elite’ CCP members are generally university educated professionals and executives in companies, both state and private. In effect, there is an increasing divergence between the social composition of the party rank and file and the better-off members of the party.

The authors sum this up: “while the Party overall has still a majority membership of the “old” social groups, its top is increasingly dominated by the “new” social groups.” The CCP is over-represented by the professional layer (26%) compared to the Chinese population (18%). Workers constitute 50% of the Chinese urban population now, but only 30% of CCP members and just 15% of the ‘elite’ party members.

But is this some form of ‘political capitalism’ (whatever that means) as the authors (led by Milanovic) claim? It is not proven by the data. First, the bourgeois are still a tiny layer of CCP members (just 3% of the overall membership). You might argue that is the case in any capitalist party. The majority of members in the US Republican party or the British Conservative party are not capitalists, small or large. But I bet the ratio of such bourgeois and petty-bourgeois layers is much higher than in the CCP. And that would especially be the case among the ‘elite’ members. In the CCP, only 5% of even the party elite are outright capitalists. Second, the study is of the social composition of the CCP, not of the economic and social foundations of the Chinese economy, which surely is the place to decide on whether China is capitalist or not.
China’s Communist Party never started as a party composed of workers in its majority (because the working class was so small in 1921). And it is no democratic party, with all policies decided at the very top and followed without (at least open) dissent by the rank and file. The top leaders decide all. That is not definition of a democratic workers party. But neither is the CCP 100 years later a party of capitalists. In its social composition, it is a party of workers, technocrats and government officials; and that includes its ‘elite’.
In effect, with 95 million members, the CCP, the state machine and state enterprises are completely integrated and are in control of China. The CCP is not controlled by any capitalist class. The majority of CCP members are workers (manual, white collar and professional), although its ‘elite’ leaders have a nationalist not an international socialist ideology, and have connections to the capitalist sector.
June 27, 2021
Inflation, interest rates and debt
Inflation of the prices of goods and services is good or bad news depending on your relation to the means of production. For labour, with no ownership of the means of production and only making a living from selling its power to work, inflation is not good news, because it eats into real incomes by increasing the prices of necessaries.
Currently, as the major economies come out of the pandemic slump, employers are increasingly complaining that they cannot get staff to return to their low-paid jobs in the leisure, hospitality and other service industries. They are being forced to bid up wage rates to attract people back into jobs with little satisfaction, poor conditions, no unions, no sick pay, no holiday pay etc.
The prospect of higher wages sounds like good news for layers of workers previously on minimum wage levels or even below. But higher wages are a monetary or prices illusion if at the same time prices for food and other necessaries start to rise sharply. And they are. The official US inflation rate hit 5% yoy in May. This was the highest reading since August 2008. It’s the same story in the UK and Europe, even though the level of inflation is only about 2% a year there, that rate is the highest for over seven years.
The rate is partly the result of ‘base effects’ ie the rate dropped sharply during the pandemic slump and prices have just bounced back in the last few months. But it is also the result of sharp rises in commodity prices (agricultural products, metals and energy) driven by a slow return to production of these goods globally and also a partial breakdown in the international ‘supply chain’ of trade caused by lockdowns and restrictions on movement. In effect, there are ‘bottlenecks’ in supply that make it difficult to meet rising consumer and producer demand. That’s driving up the rate of inflation in prices.
Inflation may be bad news for labour, but ‘moderate’ inflation is not bad news for capital. Companies like a little inflation because it gives them some leeway to raise prices to sustain profitability in competition with others. But what capital does not like is accelerating inflation. That delivers a host of problems. Raw material prices become uncontrollable, employees start demanding higher wages and there a is a serious risk that interest rates start to rise, making borrowing more expensive. So inflation of prices as such is not an issue for capitalists: what they hate are two things that might arise from accelerating inflation: rising wages and rising interest rates. The former eats directly into profits at the bottom and the latter drives up borrowing costs and so clips profits off from the top.
Now Keynesians argue that wage rises are good news for all, workers and capitalists, as higher wages will boost ‘effective demand’ and get economies going. But they also hint that capitalists need not worry about higher wages because if ‘wage-push’ inflation follows (ie capitalist raise their prices in response to wage increases), workers will eventually lose with one hand in real terms what they gain with the other – and profitability for capital will be preserved. This circuitous argument allows Keynesian theory to claim that wage rises are good and won’t hurt capitalists – but at the end of circuit of argument, we find that it is labour that loses or at least gains nothing.
However, as Marx explained in his famous debate with trade unionist Thomas Weston on whether wages will cause price rises, that this argument is really anti-labour and workers should not fall for it. Moreover, wage rises mean lower profits, other things being equal, not higher prices.
That is why capitalists oppose wage rises to the bitter end, despite the Keynesian calls. You see, it’s profitability that decides investment and production, not ‘effective demand’. As Marx said, wages are the dependent variable not the determining factor in capitalist production: “the rate of accumulation is the independent, not the dependent, variable; the rate of wages the dependent, not the independent variable”, and “(t)he rise of wages (…) is confined within limits that not only leave intact the foundations of the capitalistic system, but also secure its reproduction on a progressive scale”. In other words, wage rises cannot rise to the point that they seriously threaten profits. If they do, governments will intervene with so-called ‘incomes policies’ to control wages and impose taxes to reduce income gains – by the way, policies in the past supported by Keynesians to control wage-push inflation.
The current data on wages in the US are distorted because those who have been made unemployed during the pandemic were generally the lower-paid and the professional and manufacturing sectors were able to boost wages somewhat. The current figures reflect this narrow base for wage increases. But overall, so far, employee costs for capitalists are not rising at any faster a rate than before the pandemic (in the US at about 3% a year). Given that inflation is now 4-5% in the US, average real wages are actually falling (even though the higher-paid are doing okay)!
So far, financial markets are not too worried about rising inflation. What matters to them is whether central banks will start to raise the short-term ‘policy’ interest rate that sets the floor for all interest rates charged for borrowing money to invest, produce and speculate. So far, financial markets have been reassured by the likes of the Federal Reserve, the ECB and the Bank of England that there will be no move to hike interest rates.

Thus, the US stock market hit yet another all-time high last week and long-term bond yields (the main interest rate for corporations), after jumping a little on the latest inflation rate figure, fell back again after the Fed claimed that the current inflation shift was ‘transitory’ and inflation would eventually settle back to pre-pandemic levels near the Fed’s own target of 2% a year.
However, it seems that the Fed is not so sure of this ‘transitory’ future. At its latest interest rate meeting, Fed officials were divided on their forecasts for inflation over the next few years. The consensus view was that the ‘core inflation’ rate (that’s after discounting food and energy – hardly unimportant items for workers!) would jump to 3% this year, but then fall back to 2.1% in 2022 and 2023 even as the economy reached ‘full employment’ and maximum capacity. So the consensus, as expressed by Fed chair, Jay Powell, was that there would be no need to raise the Fed’s policy rate until well into 2023.
However, several Fed regional presidents seemed less sure that inflation rates would drop back and given the supply ‘bottlenecks’ and the ‘sugar-rush’ in consumer demand, they have talked of an earlier move on rates.
And this is the point. As I have argued above, capitalists, whether in productive or speculative sectors, are not really worried by inflation as it affects them little. What worries them and their decisions on investment in productive sectors or continued speculation in financial assets is interest rates which affect the cost of borrowing relative to profitability in the ‘real’ economy and to prices in stocks and bonds.
Indeed, as I have argued before, inflation in goods and services actually tends to slow or even disappear in capitalist economies where the production of new value added slows in growth and leads to slowing in demand from capitalists and workers. That is the tendency of the last 40 years, for example, in the major economies as the growth in the productivity of labour has declined and average profitability of capital has fallen. The inflation rate has fallen and efforts by central banks to achieve ‘moderate’ inflation of, say 2% a year, have failed in the US, Europe and Japan. Short-term interest rates, generally influenced by central banks, have dropped towards zero while long-term rates, more endogenously determined by market forces, have also dropped to historic lows not seen since the 1930s.
 The decline in nominal interest rates
It’s interest rates that matter because corporate debt is at record highs in most major economies, while stock markets ride on a flow of borrowed money. So any jump in the cost of borrowing could be devastating to many companies and trigger a stock and bond market collapse.
 Source: BIS, author’s calculations
I have discussed before the fact that between 15-20% of companies in the major economies are barely covering the debt servicing costs with the profits they are making. According to Bloomberg, In the US, almost 200 big corporations have joined the ranks of so-called zombie firms since the onset of the pandemic and now account for 20% of top 3000 largest publicly-traded companies. With debts of $1.36 trillion. That’s 527 of the 3000 companies didn’t earn enough to meet their interest payments!
Debt servicing costs have been falling on average even though debt is piling up. That’s because of the sharply falling cost of borrowing. If that scenario should start to reverse, then the possibility of corporate bankruptcies and a financial crash becomes a probability. And the US corporate debt servicing ratio (debt costs to corporate income) has jumped to a 20-year high in the pandemic. And if corporate bankruptcies (currently very low) start to emerge, the banking system may come under pressure.
 Source: BIS, author’s calculations
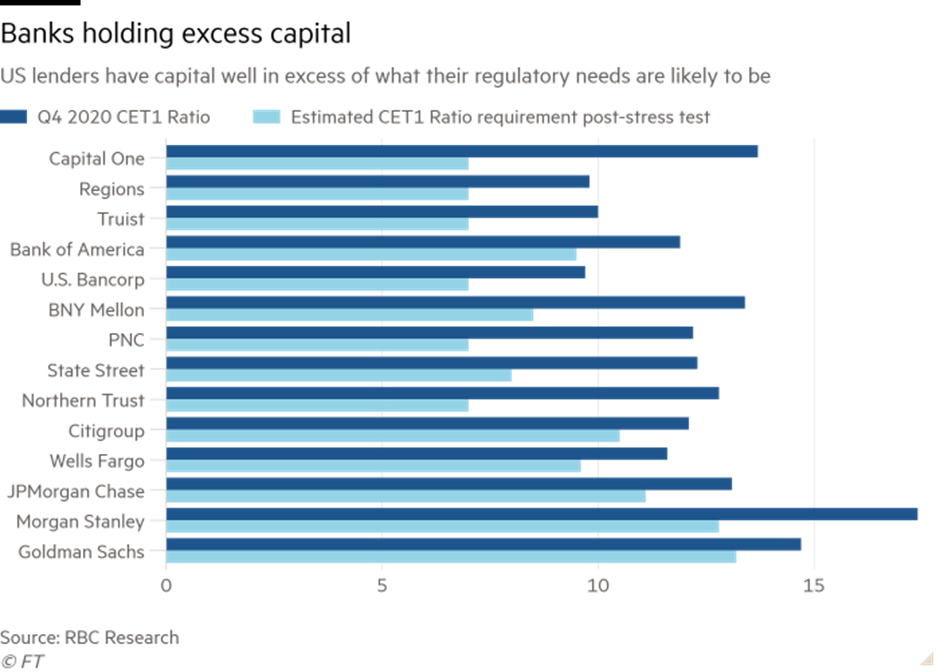
Recently, the Federal Reserve conducted a ‘financial stress test’ on US banks. It found that nearly all were in good shape with plenty of spare capital cover any loan losses, certainly compared to before the global financial crash of 2008-9. They were in such good shape, that they could plan to pay shareholders increased dividends and buy back shares to boost prices. However, while the large ‘retail’ banks seemed in good shape, it was less so for the huge investment banks which provide funds for speculation in financial assets and speculate themselves. They are required to have higher capital ratios (capital relative to loans and financial assets) and the gap between the minimum requirement and their ratios is much less.
Accelerating inflation may be an issue right now in the US and other recovering capitalist economies, and it certainly bites into any recovery in labour incomes; but for capitalism, profitability is the real benchmark and that can be hit by wage rises on the one hand and interest rises on the other. If it is, that is the basis for a new slump.
June 24, 2021
1% own 45% of the world’s personal wealth while nearly 3bn people have little or no wealth at all
Just 56m or 1% of adults out of 5.3bn globally are millionaires in net wealth terms. And they own 45% of all global personal wealth. The other 99% own the rest and there are nearly 3bn people in the world that have little or no wealth at all (after debts are deducted).
Every year I report on the results of the annual Credit Suisse Global Wealth Report. Produced by economists Anthony Shorrocks (with whom I graduated at university), James Davies and Rodrigo Lluberas, this is the most comprehensive study of global personal wealth and inequality between adults around the world.
In the 2021 report, the economists find that the global wealth gap widened during the Covid pandemic, swelling the ranks of the world’s millionaires by 5.2 million as the rich cashed in on surging stock and house prices. I quote “During the pandemic, emergency interest rate cuts and government stimulus measures often benefited those least in need of state support, helping their assets grow in value despite the economic downturn.”
The report finds that dollar millionaires now account for more than 1% of the global population for the first time in history: 56.1 million individuals had assets worth more than $1m (£720m) in 2020. That compares with the mean average wealth per adult in the world of just under $80,000.

In total, global wealth grew by 7.4% in 2020 to $418.3tn in 2020, with gains largely attributed to growth in the US, Europe and China, while overall wealth in Latin America and India declined.
Global wealth is expected to rise a further 39% over the next five years to reach $583tn by 2025, while the number of millionaires is forecast to jump by nearly 50% to 84 million individuals. The group rich enough to be counted as ultra-high net worth is also expected to expand by nearly 60% to reach 344,000 people.
Total global wealth grew by 7.4% and wealth per adult rose by 6% to reach another record high of $79,952. The report finds that “overall, the countries most affected by the pandemic have not fared worse in terms of wealth creation. In short, there is nothing in the chart to suggest that the economic upheaval in 2020 bore any resemblance to that experienced in 2008. Household wealth appears to have simply continued on its way, paying little or no attention to the economic turmoil that should have hampered progress.”
Aggregate global wealth rose by $28.7 trillion to reach $418.3 trillion at the end of the year. That compares with annual global GDP of about $100trn, so some four times larger. In terms of current US dollars, total wealth grew by 7.4% and wealth per adult was up 6.0%. However, widespread depreciation of the US dollar accounted for 3.3 percentage points of the growth. If exchange rates had remained the same as in 2019, total wealth would have grown by 4.1% and wealth per adult by 2.7%.
Global average wealth per adult in the year 2000 was $31,378. So, without making allowance for inflation, average wealth is now 2.5 times its value at the start of the century. Where is this extra wealth being accrued? North America and Europe accounted for the bulk of the wealth gains in 2020. Total wealth scarcely changed in Africa, and exchange rate appreciation accounted for what little change there was. India and Latin America both recorded losses in 2020. Total wealth fell in India by 4.4%. Latin America appears to have been the worst-performing region, with total wealth dropping by 11.4% or $1.2 trillion. With these regions being stricken most by the pandemic, this is no surprise.

The change in wealth per adult is a better guide to the comparative performances of different countries. On this measure average wealth per adult rose most in Switzerland and Australia. Asset price rises played a role in some of these countries, most notably the United States. But currency appreciation is the main explanation for most of these increases in average wealth. That means national currencies appreciated against the US dollar to raise dollar wealth.
A key figure in the report which I always show is the wealth pyramid. It summarizes the distribution of wealth among all global adults. The report reckons that that 2.9 billion individuals – 55% of all adults in the world – had wealth below $10,000 in 2020. The next segment, covering those with wealth in the range of $10,000–100,000, has seen the biggest rise in numbers this century, more than trebling in size from 507 million in 2000 to 1.7 billion in mid-2020. This reflects the growing prosperity of emerging economies, especially China.

In 2020, if you have personal wealth (financial assets plus property less debt) of over $129,000, you are in the top 10% of global wealth holders and if you had over $1m in wealth, you are in the top 1% in the globe. What that tells you is that there are billions of people with little or no wealth (financial and property) in the world. Inequality of wealth is extreme.

The US has by far the greatest number of millionaires: 22.0 million, or 39.1% of the world, far ahead of China, which is in second place with 9.4% of all global millionaires.
What about the super-rich, the uber rich with over $50m in wealth? There are over 215,000 people in this bracket – the rulers of the rest of us 7.9bn people. They saw the biggest rise in their wealth during the pandemic. As the report’s authors say: “it is particularly striking in a year experiencing social and economic turmoil. The nature of the policy response to the pandemic has of course been a major influence here.”
As I have argued in various posts before, not enough attention is paid to inequality of wealth compared to inequality of incomes, either within a country or globally. https://thenextrecession.wordpress.com/2020/07/15/wealth-or-income/
As the CS report says, wealth inequality is much more unequal. “By any standard, wealth inequality is high in all countries and exceptionally high in some. As a rough guide, typical values would be 35% for the share of the top 1% and 65% for the share of the top 10%.” The gini inequality measure is used to measure overall inequality in incomes and wealth. In wealth, gini values are much higher than the corresponding values for income inequality or any other standard welfare indicator. As I have shown before, Brazil, South Africa and Russia lead the world in wealth inequality and among the advanced economies, the US is the most unequal of all.

If we look at those at the bottom of the wealth league, the CS economists estimate that the bottom 50% of adults in the global wealth distribution together accounted for less than 1% of total global wealth at the end of 2020. In contrast, the richest decile (top 10% of adults) owns 82% of global wealth and the top percentile alone has nearly half (45%) of all household assets. These ratios have hardly changed in 20 years.

China has made by far the biggest contribution to the growth in wealth this century. The CS economists reckon that “between now and 2025, we envisage that China will account for more than a quarter of the rise in household wealth recorded for the whole world.” And that will mean that “China’s wealth per adult in 2025 will qualify it as a “high-wealth” country in our classification scheme. China began this century with wealth averaging $4,250 per adult, placing them in the lowest of our country wealth categories. Transiting to the highest of our wealth categories within a 25-year timespan would be an extraordinary achievement by any standard.”
Global financial wealth has exceeded non-financial wealth in every year this century except 2008. It’s speculation in financial markets that has made the super-rich even richer. For example, the latest figure for the US for financial wealth inequality is truly staggering. The richest 1% of US households now own 53% of all equities and mutual funds held by American households. The richest 10% own 87%!
Indeed, as another study shows, the super-rich 1% in the globe have increased their wealth hugely during the pandemic, particularly in places where households have suffered most from the impact of the pandemic, like Russia, Sweden, Brazil, India and the US.

It’s the same the whole world over, It’s the rich what gets the pleasure, It’s the poor what gets the blame.
June 20, 2021
Marx’s law of profitability after Capital
The Global Marxism series organized by SSK in Korea has delivered a number of important presentations and papers on aspects of Marxist economics. I participated in the second round with a paper on the Economics of Modern Imperialism. Recently Hideto Akashi of Komazawa University, Tokyo returned to the fray with a presentation on Marx’s law of the tendency of the rate of profit to fall.
As is well known in the small circles of Marxian economics, leading Marxist scholar, Michael Heinrich, the author of a detailed account of Marx’s Capital, has argued in the past that Marx’s law of profitability is logically faulty: in particular, it is ‘indeterminate’ in that its key categories do not show that profitability of capital must fall. According to Heinrich, “an increasing organic composition as such is not enough to prove a falling rate of profit”.
Moreover, Heinrich argues that, in the last decade of his life, Marx ‘probably’ recognized this and so dropped the law as part of his theoretical arsenal and as providing any basis for a theory of crises under capitalism, instead searching for a theory based on the excess of credit. Marx doubted his own law and instead in the 1870s switched to studying the credit system as a possible cause of crises. Heinrich: “These doubts were probably amplified in the course of the 1870s. In 1875, a comprehensive manuscript emerges which was first published under the title Mathematical Treatment of the Rate of Surplus-Value and Profit Rate. […] it quickly becomes apparent that in principle all sorts of movement are possible. Several times, Marx makes note of possibilities for the rate of profit to increase, although the value-composition of capital was increasing. In the case of a renewed composition of book III, all of these considerations would have had to find their way into a revision of the chapter on the “Law of the Tendency of the Rate of Profit to Fall”. A consistent regard for them should have led to the abandonment of the “law”. (Heinrich).
When Heinrich first proposed this critique, several authors including myself responded with firm rebuttals, which, in my view, were compelling in refuting Heinrich on both his points: the indeterminacy and Marx’s dispensing with the law. Indeed, I offer a detailed rebuttal of Heinrich’s claim that Marx dropped the law in my recent short book, Engels 200 (see pages 106-111).
But Heinrich’s claims were raised again in questions in the Global Marxism series and Akashi took them up again in his latest presentation. Akashi points out that the most important factor of the law of tendential fall of the general rate of profit is that the rate of profit falls and the quantity of profit increases while, at the same time, the organic composition of capital (ie more investment in means of production relative to employment) is rising. There are some counteracting factors, but these cannot diminish the former sufficiently to cause a secular rise in profitability.
Akashi also argues against Heinrich that after the publication of Capital, Marx did not abandon the law. Akashi cites Marxist scholar Kohei Saito who rejects Heinrich’s interpretation and points out that as late as 1878, Marx was still considering mathematically how the law of profitability would operate. Indeed, Marx tried to integrate the effect of turnover of capital into his argument for the rate of profit: Marx wrote a short manuscript in 1878 entitled “On the rate of profit, Turnover of Capital, Interest and Discount” by editors of MEGA. (MEGA II/14, Apparat p. 697).
Actually, in writing Capital, Marx had considered earlier the role of the turnover of capital. He discussed this with Engels in 1873 (after the publication of Capital), to ascertain the length of the turnover of fixed capital (see my book, Marx 200, pp56-8).
However, in Akashi’s view, Marx’s attempts in 1878 to show the impact of the turnover of capital on the rate of profit did not work. (MEGA II/4.2, p. 252, S. 216), which is why Marx abandoned the attempt. In Akashi’s view, Marx should have adopted a method of consideration based on first equalizing rates of profit to a general one and then applying turnover rates to that. “I supposed Marx should have dealt with capital transfer from industries with a higher organic composition and a slower speed of turnover to those with a lower organic composition and a higher speed of turnover, and then he should have taken the general rate of profit as given.” Once he had a general rate of profit, if he had simulated the equalization of turnover’s effect on the general rate of profit, he would have seen the capital transfer from the industry with lower speed turnover to the industry with higher speed turnover.
Actually, there has been further work by Marxist economists to bring the turnover of capital into the coordinates of the law of profitability. Engels himself began that work with his addition in Volume 3 of Capital – see my Engels 200, pp99-101). Modern accounts can be found from Brian Green, Peter Jones and others. Maito, for example, concludes that “while it (turnover rate) does not affect the sense of the trend (the fall in the rate of profit), it softens the slope” in referring to his calculation of the rate of profit in Japan.
But the main point here is that, as late as 1878, Marx was tinkering with the law of tendency of the rate of profit to fall and trying to integrate turnover rates into the equalization of profit rates in different sectors to produce a general ‘social’ average rate of profit. This confirms the view of many of us that Heinrich is wrong, namely that a) that Marx’s law is ‘indeterminate’ and b) that Marx had dropped the law in the period after Capital Volume One was published and Engels should never have included the law in Volume Three of Capital when he edited it.
June 17, 2021
Profits call the tune
I have argued in many posts that ‘profits call the tune’ in capitalist accumulation. What I mean by that is that any change in business profits (and profitability) will lead to changes in business investment – and not vice versa over time.
Profits are key to capitalist investment, not ‘effective demand’ as Keynesians argue, or changes in interest rates or money supply as Monetarists and the Austrian school argue. I differ strongly from the post-Keynesian view that profits are a ‘residual’ generated by investment; or as Keynesian-Marxist Michal Kalecki put it: ‘capitalists earn what they invest, while workers spend what they earn’.
Yes, workers spend what they earn from wage labour ie (consume and save little); but capitalists do not ‘earn’ profits from their investment in capital (means of production and labour). This theory denies Marx’s law of value that only labour produces value and surplus value (profit) for the capitalist. It turns profit into the ‘gift of capital’; ie there is no profit without capitalists investing. Yet profits can be generated out of the exploitation of labour power and capitalists may not invest. Indeed, that is what we can see now in the expansion of ‘fictitious capital’ at the expense of productive investment.
And it’s not just the theory; the empirical evidence is overwhelming that profits lead investment. In several posts and papers, I have cited empirical work done by Marxist economists like Alan Freeman, Andrew Kliman, Peter Jones, Jose Tapia, Guglielmo Carchedi and others including myself that show this. Moreover, there are also many mainstream economic studies from prestigious sources that deliver the same story.
Recently, in an article for the Financial Times, more evidence that profits call the tune has been presented. Ian Harnett, co-founder and chief investment strategist at Absolute Strategy Research, a macro financial research company, finds that global business investment in the ‘means of production’ tends to follow global profits growth. Harnett’s study is global and not just the US, where most empirical work has been done up to now.
In the graph below, he measures the year-on-year change in global non-financial sector investment after depreciation. In effect, this means new investment over and above that needed to replace worn out equipment and structures. The graph shows that earnings (profits) growth in the non-financial sector from the 1990s leads changes in new non-financial investment: profits call the tune. When earnings growth rises as in the 1990s, investment follows it upwards and then down in the later 1990s. Earnings growth started slowing as early as 2005, leading to a decline in investment, and eventually to the Great Recession.

Several studies (including my own) show that the global rate of profit (profitability not profits) has been in secular decline over the last 70 years and in particular since the late 1990s.
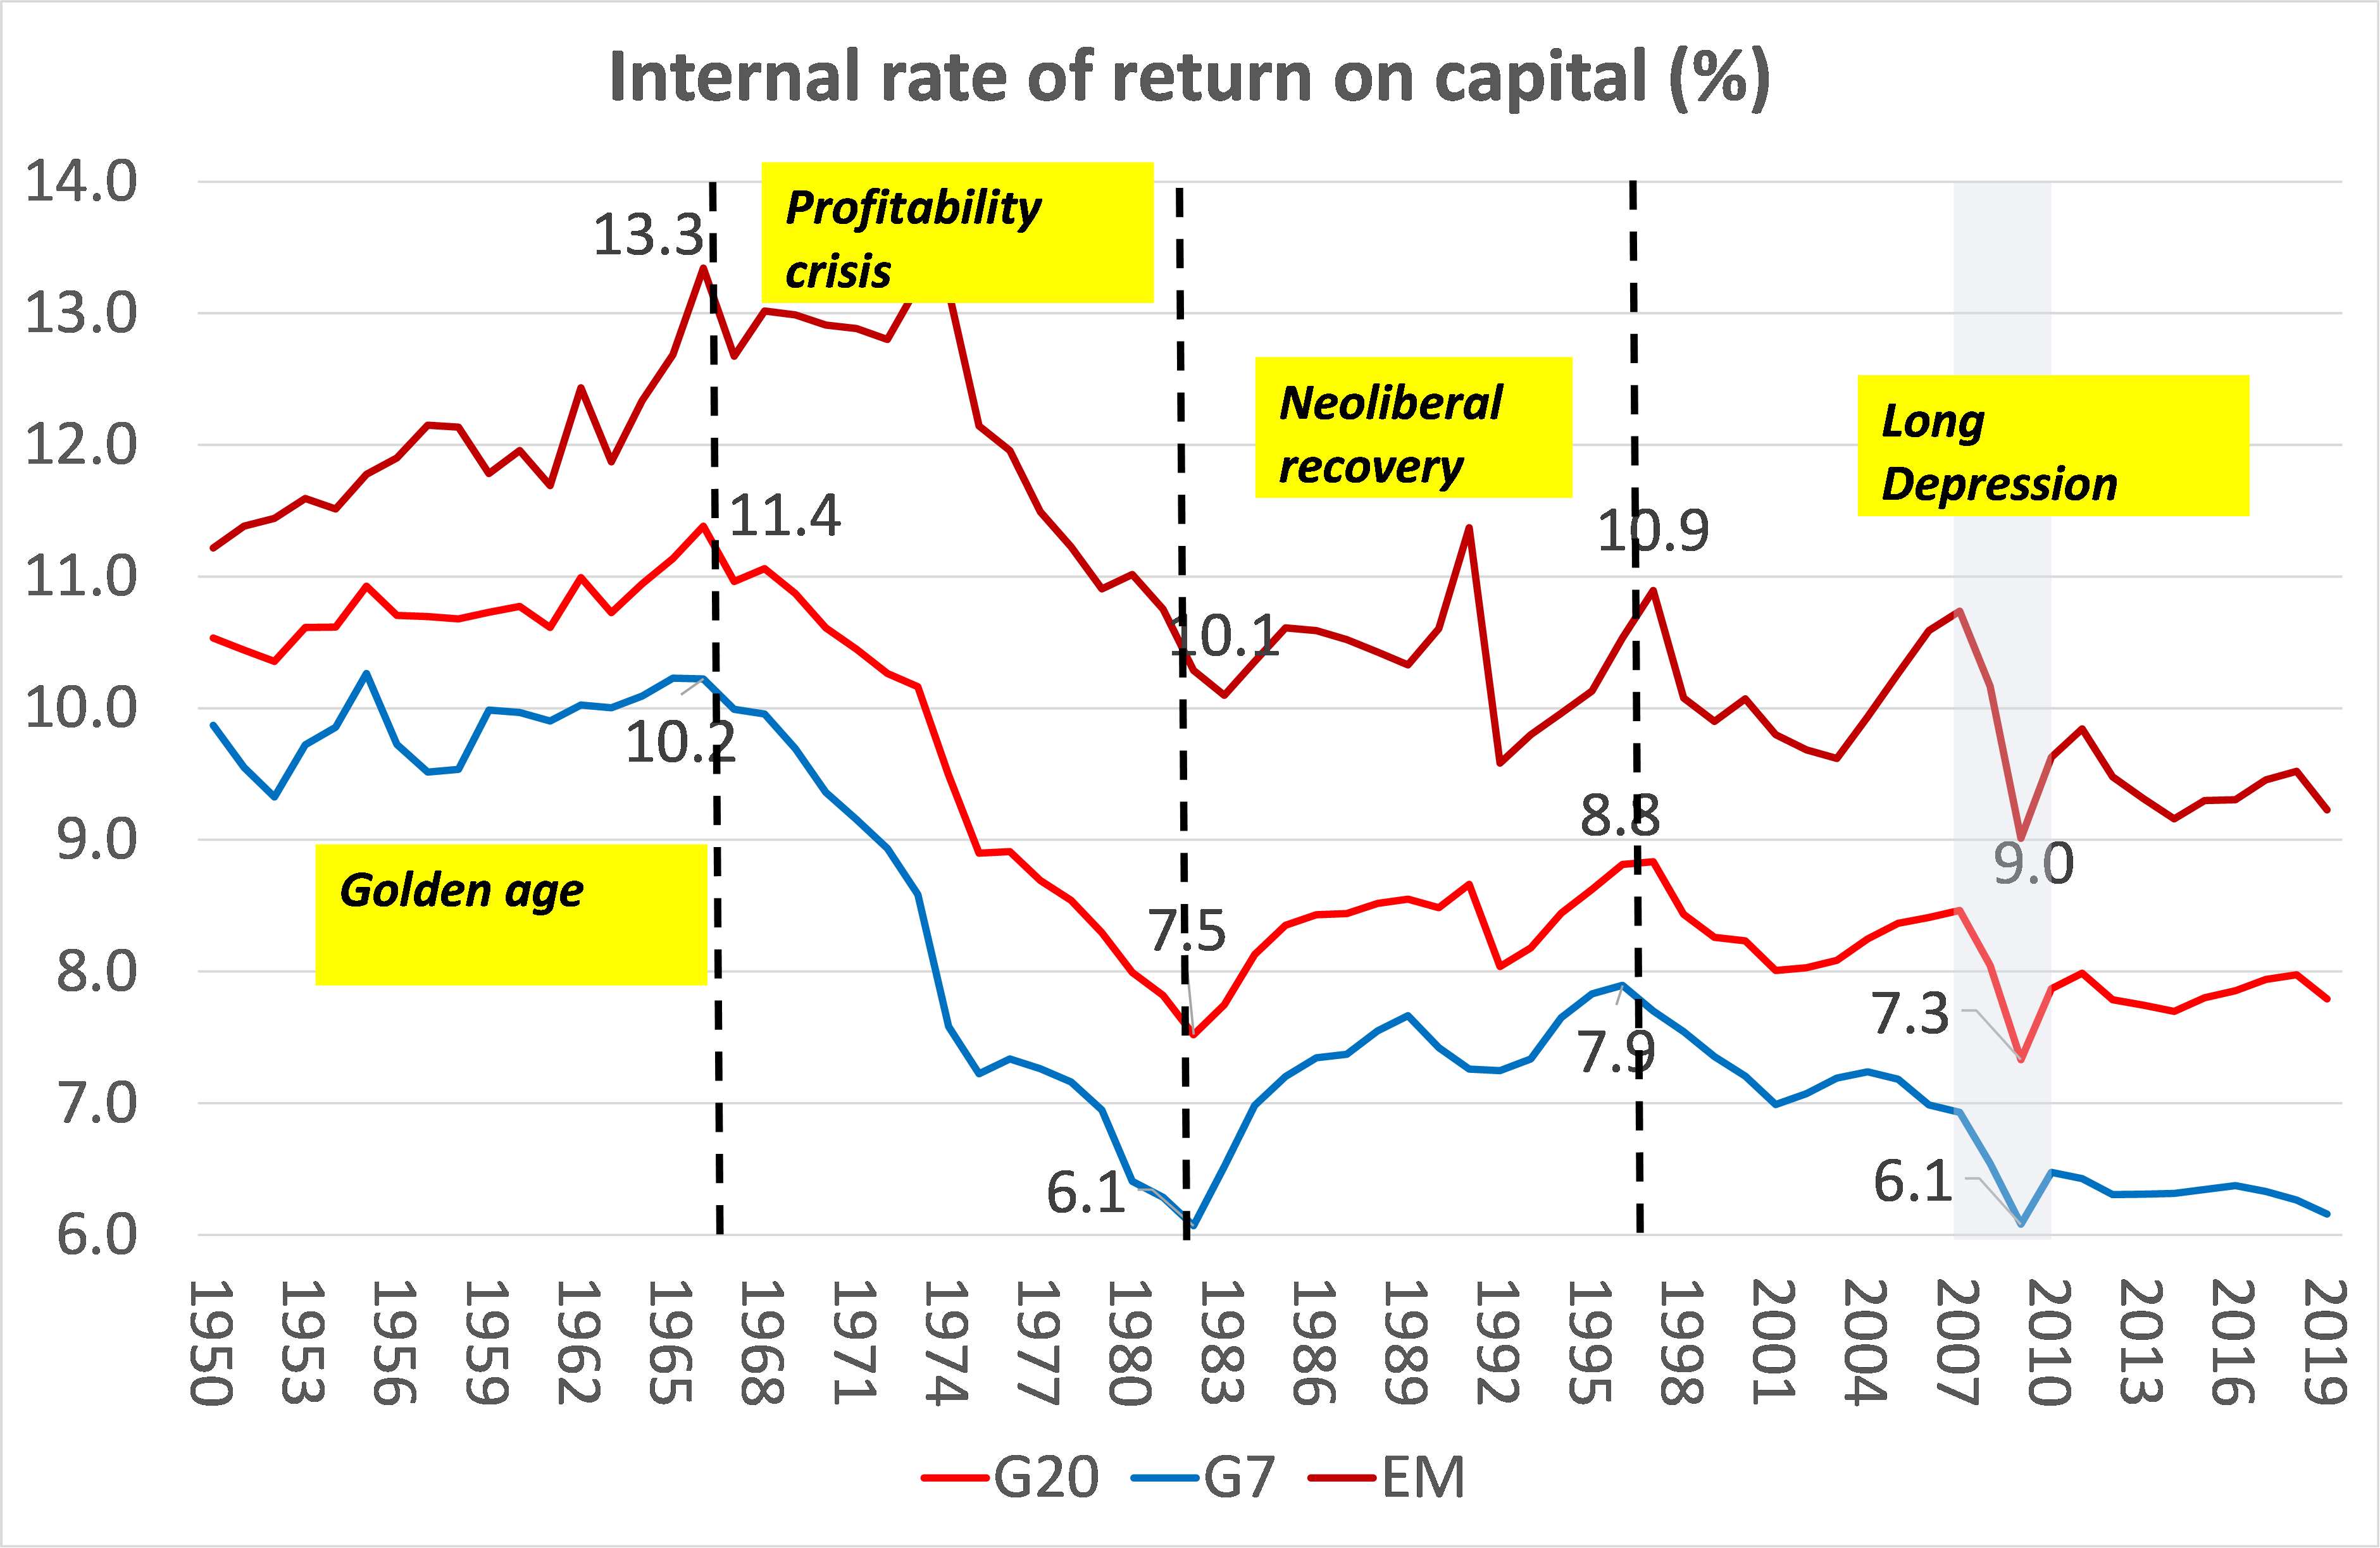
Source: Penn World Tables 10.0 IRR series
If the theory is right, then falling profitabilty long term should lead to a secular fall in business investment; and Harnett’s global data confirm that. Harnett’s data show that new investment relative to depreciation has declined globally from a multiple of 2 in the 1990s to less than one now. In other words, annual global investment is now less than that needed to replace worn out fixed assets!

‘Non-financial investment’ includes public sector investment, so it could be that the decline is partly due to fall in public investment as a share of GDP in the last 30 years and not due to a fall in business investment. But while the reduction in public spending in infrastructure etc is a factor, it is clear from the first graph that investment has been falling in line with profitability and not mainly because of ‘austerity’.
If we look at investment rates (as measured by total investment to GDP in an economy), we find that in the last ten years, total investment to GDP in the major economies has been weak; indeed in 2019, total investment (government, housing and business) to GDP is still lower than in 2007. In other words, even the low real GDP growth rate in the major economies in the last ten years has not been matched by total investment growth. And if you strip out housing, business investment has performed even worse.
In his FT piece, Harnett wants to argue that post-COVID things are about to change. There will now be a focus of investing productively by ‘capital-heavy’ businesses through ‘reshoring’; spending on infrastructure especially on environmental targets; and on global protectionist measures to avoid reliance on China’s production etc. Harnett reckons this rise in investment will be driven by a new political will to keep interest rates low and a reversal of neoliberal austerity through extra government spending. But this conclusion runs against his own evidence that investment is driven by profits, not by government spending or ‘effective demand’.
June 10, 2021
Imperialism meets in Cornwall
This weekend, the leaders of the ‘free world’ are flying (and helicoptering) into Cornwall, at the tiny end of England, for the first physical meeting of the G7 nations. As they increase the carbon footprint sharply through extensive fossil fuel activity, the G7 agenda will include dealing with climate change, global ‘action’ on the COVID pandemic and the state of the world economy.

Crowding into the holiday resort of Carbis Bay, the G7 leaders will not be joined by the likes of China or Russia, who are excluded from the deliberations but as hosts to this jamboree, the UK has invited like-minded leaders from Australia, India, South Africa, and South Korea.
The leaders arrive as all the talk is of a fast-growing recovery in the major economies as they come out of the COVID lockdowns and vaccination rates rise. – According to investment bank JPM Morgan economists, “The global economy is on track for a boom in the current quarter, with the all-industry output activity index jumping to a new high and with continued robust gains in manufacturing joined by a stunning surge in services sector activity.” JPM reckons this points to near 5% annual growth in global GDP this year.
In its half-yearly outlook report, the World Bank forecast the world economy to grow at 5.6% this year, in a sharp upgrade from previous estimates it made in January of 4.1%. It said this would mark the fastest post-recession recovery in 80 years, with growth forecasts of 6.8% in the U.S. and 8.5% in China.

But these headlines hide the details. The World Bank is only projecting 2.9% growth among low-income countries, the slowest in the past 20 years (when setting aside the steep fallout of 2020). So the recovery is fuelled by growth in just a few major economies where rapid progress with the Covid-19 vaccine has enabled a faster return to relative normality. However, most ‘developing nations’ will continue struggling with the virus and its aftermath for longer, worsening divisions between rich and poor nations. Sounding the alarm over the uneven recovery, the World Bank said about 90% of rich nations were expected to regain their pre-pandemic levels of GDP a head by 2022, compared with only about one-third of low-income countries. This recovery is unusually narrow in per capita terms, with only 50 percent of countries expected to exceed their pre-recession peaks in 2022.

David Malpass, the bank’s president appointed under Trump’s presidency, said: “Globally coordinated efforts are essential to accelerate vaccine distribution and debt relief, particularly for low-income countries. As the health crisis eases, policymakers will need to address the pandemic’s lasting effects and take steps to spur green, resilient, and inclusive growth while safeguarding macroeconomic stability.”
But the Bank and the G7 leaders make no demand for the suspension of intellectual property rights by pharmaceutical companies to deal with supply shortages. Last month, the US backed a temporary suspension of such rights for Covid-19 vaccines, leaving the UK and the EU as the main opposition to such a move. Malpass said the World Bank did not support the lifting of IP rights because to do so could jeopardise spending on research and development. “The World Bank supports the licensing and transfer of technology to developing countries to bolster global supply,” he said. “A very critical part of the supply chain is the invention and creation of manufacturing techniques. Above all, as we go into the booster stage, it will be vital that [research and development] flows continue to increase so that we can create vaccines that apply to new variants.” Similarly, G7 host nation Britain is refusing to waive Covid vaccine patents. In other words, vaccines cannot be made and supplied unless big pharma makes a profit from it – no ‘people’s vaccines’ from the G7, even though much of research and development was funded by public money.
And what about global inequality? While hundreds of millions have been driven into poverty during the COVID pandemic slump, the extreme rich have got even richer.

And they continue to pay very little tax on their wealth. The richest 25 Americans reportedly paid a ‘true tax rate’ of 3.4% between 2014 and 2018, according to an investigation by ProPublica, despite their collective net worth rising by more than $400bn in the same period. It found that in 2007 Bezos, the founder of Amazon and already a billionaire, paid no federal taxes. In 2011, when he had a net worth of $18bn, he was again able to pay no federal taxes – and even received a $4,000 tax credit for his children. Last year, Bezos’s net worth topped $200bn. By contrast, the median American household paid 14% in federal taxes, ProPublica reported. The top income tax rate is 37% on incomes over $523,600 for single filers, having been reduced from 39.6% under Donald Trump.
ProPublica found that Buffett, founder of the investment firm Berkshire Hathaway, paid $23.7m in taxes from 2014 to 2018, on a total reported income of $125m. But Buffett’s wealth grew by $24.3bn, meaning he had a “true tax rate” of 0.1%. The rates expose the failures of America’s tax laws to levy increases in wealth derived from assets in the way wages – the prime source of income for most Americans – are taxed. Buffet commented “I continue to believe that the tax code should be changed substantially,” as “huge dynastic wealth is not desirable for our society”. But don’t worry, Buffett, said that 99% of his wealth will eventually go to philanthropy “during my lifetime or at death”. He added: “I believe the money will be of more use to society if disbursed philanthropically than if it is used to slightly reduce an ever-increasing US debt,” So the answer to grotesque wealth inequality is not even proper wealth taxes on the rich but instead to rely on their ‘good offices’ to spend their money where they can help. “The ultra-wealthy get to pick and choose when and how they’re taxed,” said one campaign group. “This is exactly why we need a strong, unavoidable wealth tax now.”
That brings us to the poster headline for the G7 meeting – the deal reached among G7 governments for a ‘global minimum corporate tax rate’, to be signed off at this week’s G7 meeting and then taken to the G20 summit later this year. The claim is that the deal will go some way to getting multi-national companies to pay tax where they make their profits rather than hiving them off to ‘tax haven’ countries.
But again, like the economic recovery, the devil is in the detail. The deal is far from the desperately needed overhaul of the global tax system and fails to limit the damaging use of tax havens – which are estimated to cost low-income countries $200bn each year. Under the deal it was agreed that G7 countries would set a minimum 15% corporate tax based on where the company made its sales, regardless of whether they had a physical presence in that country. But this agreement is full of holes.
First, most countries have higher rates than 15%, so it does not affect them. “It’s absurd for the G7 to claim it is ‘overhauling’ a broken global tax system by setting up a global minimum corporate tax rate that is similar to the soft rates charged by tax havens like Ireland, Switzerland and Singapore,” said Oxfam’s executive director Gabriela Bucher. “They are setting the bar so low that companies can just step over it.”

Second, the pact supposedly will make companies pay more tax in the countries where they are selling their products or services, rather than wherever they end up declaring their profits, thus curbing the use of tax havens by corporations. But that only applies to profit ‘margins’ above 10% and accounting tricks can ensure that breaking this threshold can be avoided. And anyway, only 20% of any margin above 10% will be reallocated.
Moreover, it seems that ‘sales’ will be defined as where they are exported not where they are consumed, thus hitting poorer countries and actually boosting profits to G7 nations. Ironically, a 15% minimum tax means that Biden in the US will now not proceed to raise corporate taxes in the US as originally promised!
As part of the deal, digital services taxes that have been introduced by several G7 countries to tax the mega tech companies will be dropped. TaxWatch, a think-tank, has calculated that Big Tech companies will pay less tax in the UK under the G7 plan than they currently do under the country’s digital services tax. Based on 2019 revenues, Amazon, eBay, Facebook and Google would pay £232.5m less in tax under the G7 plans. TaxWatch calculated that the tax take from Google would fall from £219m a year to £60m under the G7 plan. Facebook’s taxes would drop from £49m to £27.7m and eBay’s taxes would decline from £15.7m to £3.8m. TaxWatch added that eBay might even fall out of the scope of the G7 plan, which is designed to capture about 100 of the biggest global companies. As for Amazon, it currently pays £50m under the UK’s DST. It is not yet clear how it would be captured by the G7 plan, because its profit margins are below 10 per cent. TaxWatch estimated Amazon Web Services, its cloud unit, would pay £10.1m under the G7 proposals.
Then there are demands for exemptions that could scupper any tax revenues for governments. UK wants an exemption on financial services. And Paris, Berlin, Copenhagen and Luxembourg are also trying to persuade the EU commission support exemption for their banks.
This deal will do little to reduce inequality and establishing fairness. The IMF chart below groups together 196 countries with the same type of corporate income tax (CIT) system (there are several) & if a minimum tax (MT) rate is used. It shows that, even if some minimum international level had been set back in the 1980s, tax levels would still be way below levels in the 1980s, minimum or no minimum.

It is not higher corporate taxes that are needed; it’s ownership and control of the multi-nationals and the closure of tax haven operations. Of course, there is no G7 deal on that.
Economic recovery may be under way now as businesses reopen, fiscal spending is boosted and monetary largesse from central banks continues, but this is really only creating what some have called a ‘sugar-rush economy’.

And even on these criteria, emerging and developing countries are far behind. Quantitative easing has averaged 15 per cent of GDP in high-income countries against 3 per cent in emerging and developing countries. Fiscal support averaged 17 per cent in high-income countries against 5 per cent in emerging and developing countries.
Moreover, half of all low-income countries are in debt distress. And the record level of debt around the world, particularly among emerging and developing countries, is a threat to economic stability as global financial system is now vulnerable to a sudden increase in interest rates. But the G7 will do nothing about debt cancellation.
The risk of significant consumer price inflation is rising as bottlenecks in global supply chains build up. US consumer price inflation rate jumped to 5% in May, the highest rate since August 2008 due to soaring commodity prices, supply constraints, and higher wages. The core index jumped 3.8% in May, the largest increase since June 1992.
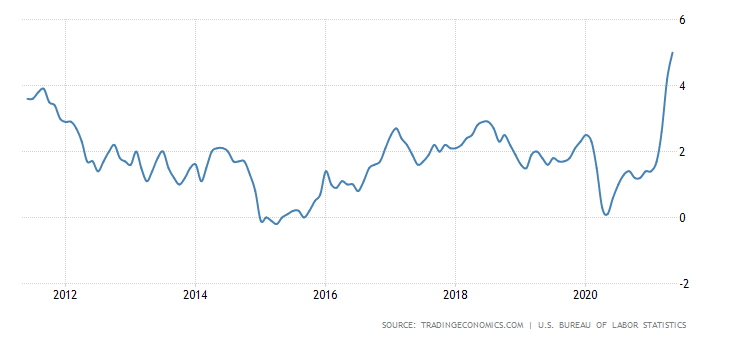
There could be stronger inflation over the next six to 12 months, especially in import prices and if international supply chains are weakened, we could see a rise in prices over a period of time. Inflation in the late 1980s was immense. In most advanced countries, it was in the double-digit percentage range. Over the last two decades, inflation in these countries has, broadly speaking, been around 2%. But we could see the inflation rate for the next 12 months between 3-4% until production can catch up with increased demand.
Indeed, it is likely that after the initial burst of economic expansion after the end of COVID pandemic this year and into next, the world economy, led by the G7 nations, will fall back into the previous crawling pace of economic growth experienced before the pandemic. That will mean that most major economies will not return to even the previous trajectory of weak real GDP growth (the blue line in the graph below).

The global economy was already growing very weakly in 2019. That’s because capitalism grows sustainably and strongly only if profitability increases. However, average profitability was already very low before the pandemic, and in some countries, it was at the lowest level since the end of the Second World War.
Profitability would only revive if some rotten layers of capital were removed in what is called ‘creative destruction’ of the weak to help the strong. Instead, up to now, cheap money and fiscal support have kept alive the ‘living dead’, so-called zombie companies, which make little profit and can only just cover their debts. In the advanced economies, about 15-20 percent of companies are in this situation. These companies keep overall productivity low, hindering the more efficient parts of the economy from expanding and growing.

And what if they should collapse? These zombies are “a ticking time bomb” whose explosive effects will be felt if governments and central banks withdraw measures that have helped keep them alive during the pandemic.
Apart from restoring profitability and investment long term, the other challenge facing the G7 leaders is global warming and climate change. A recent UN report found that far too little was being done and funded to save the planet. Out of the $14.6 trillion the world’s 50 largest economies announced in fiscal spending in the wake of COVID-19, just $368 billion (or 2.5 per cent) was being directed towards ‘green initiatives’. That needs to at least triple in real terms by 2030 and increase four-fold by 2050 if the world is to meet its climate change, biodiversity and land degradation targets, says the UN. This acceleration would equate to cumulative total investment of up to USD 8.1 trillion and a future annual investment rate of USD 536 billion. The UN hopes that private investment will step up tot the plate. Fat chance! Up to now, of $133 billion/year invested in ‘nature based solutions’ to global warming public funds make up 86 per cent and private finance 14 per cent.
There is little chance that G7 nations will add to this. And the G7 has no intention of reducing subsidies to fossil fuel industries, let alone bringing them into public ownership in order to plan the phasing out of these carbon emitting companies. Instead, heavily subsidized private oil companies enjoy the profits of oil extraction while the rest of us pay in tax dollars, human rights abuses and an unliveable climate.
Of course, public ownership by itself does not guarantee that we can fully replace oil and gas with renewable energy in time to avert the worst impacts of the climate crisis. After all, three-quarters of the world’s oil reserves are already owned by states rather than private companies. But if companies like Shell or ExxonMobil were nationalized with a mandate to wind down their assets, it would be a start.
Instead, the G7 as the globe’s imperialist bloc is much more interested is finding ways of isolating China and Russia in order to maintain its hegemony. The problem for the G7 is that, whereas in the 1970s the G7 nations accounted for some 80% of world GDP, that is now down to about 40%.
Michael Roberts's Blog

- Michael Roberts's profile
- 35 followers

