
Michael Roberts's Blog, page 19
August 27, 2023
Navigating by the stars under cloudy skies – and holed below the water line
In the last few days, the leading central bankers of the advanced capitalist economies met at the annual jamboree in Jackson Hole, Wyoming, US. Jackson Hole is a very upmarket ski and mountain resort where average household income is near $100,000 a year. So it is a very appropriate place for central bankers to meet and discuss the world’s economic problems and, in particular, the cost of living crisis and the fall in real incomes that has hit the rest of us across the globe.
The meeting was kicked off by an eagerly awaited address from Fed Chair Jay Powell on the central bank’s progress on getting inflation down. Financial investors were hoping for a clear statement that the Fed would stop hiking its policy rate now that inflation was falling. But that hope was dashed as Powell made it clear that inflation was “still too high” and while the rate of inflation was falling, it would be necessary to keep the policy rate high for some time i.e. well into 2025, and it may be necessary to raise it again before the year is out.
Powell sort of admitted for the first time that inflation had spiked to levels not seen since the 1980s because of “supply distortions”, but continued to claim that it was a combination of ‘excessive demand’ and weak supply. That was stating the obvious in the sense that it takes two to dance i.e. if the supply of commodities is lower than demand for them, then prices would rise and vice versa. But the question is: which was the leading the dance, supply or demand?
The evidence is now overwhelming that it was the latter, with rocketing energy and food prices caused by the collapse of supply chains internationally, very low productivity growth and the loss of skilled workers after the pandemic.
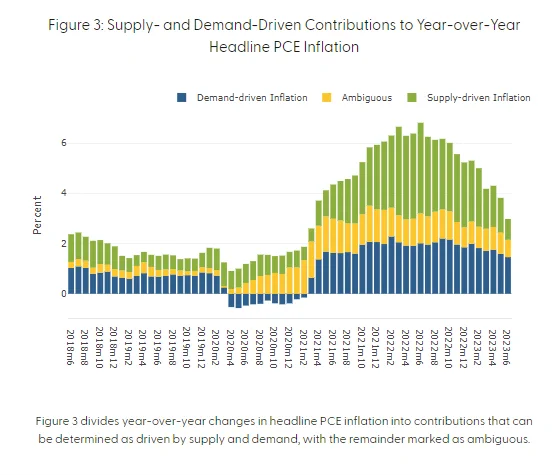
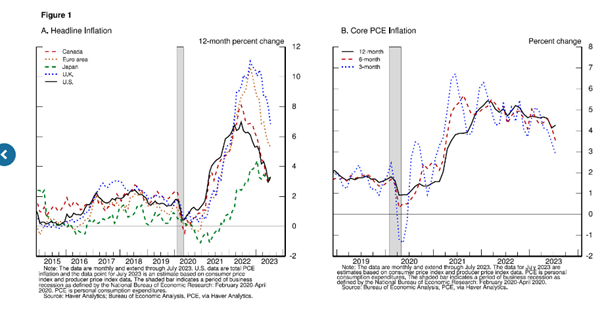
That meant that the huge rise in interest rates, supposedly to bring down ‘excessive demand’ by reducing borrowing to spend or invest, would have limited effect on inflation rates. And so it has proved. While the ‘headline’ inflation rate has fallen globally as energy and food price inflation subsided (at least for now), ‘core’ inflation rates have remained stubbornly high.
Central banks and mainstream economists have not been able to answer why that is. Nevertheless, they have ploughed on with what they do: namely to raise interest rates and reduce money supply in order to bring the inflation rate down to some arbitrary target of 2% a year. As Powell put it at Jackson Hole: “although further unwinding of pandemic-related distortions should continue to put some downward pressure on inflation, restrictive monetary policy will likely play an increasingly important role.”
So, despite the hit to people’s living standards; despite the monstrous rise in mortgage borrowing costs; despite small banks and businesses going under, the Fed will continue to keep interest rates at record highs to ‘control inflation’, which is only coming down because the supply issues in energy and food have abated.
What high interest rates are doing is damaging the productive sectors of the economy, but not really affecting inflation. Powell admitted that “getting inflation sustainably back down to 2 percent is expected to require a period of below-trend economic growth as well as some softening in labor market conditions.” Indeed. The Fed and the the mainstream economists continue to proclaim how low unemployment is, not only in the US but in most of the other advanced economies.
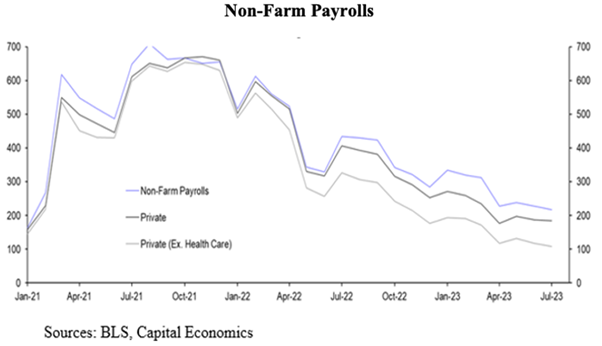
So there is nothing to worry about – a ‘soft landing’ for the economy is probable, even if unemployment ticks up a bit. But Powell had to recognised that “payroll job growth has slowed significantly. Total hours worked has been flat over the past six months, and the average workweek has declined to the lower end of its pre-pandemic range”.
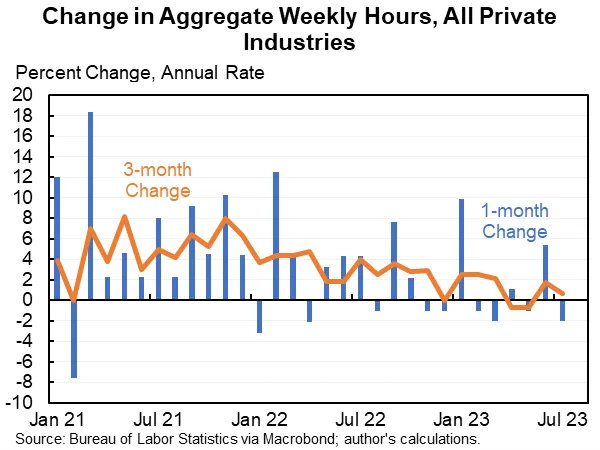
He called this “a gradual normalization in labor market conditions“. More likely, it is another sign that the US economic ship, far from pulling into a safe economic harbour, is showing signs of listing with a hole appearing below the water line.
Actually, the ‘strong’ jobs data has been quietly revised down by the official statisticians just this month, with a reduction of over 350k jobs in the year to March. Moreover, a further downward revision is expected.
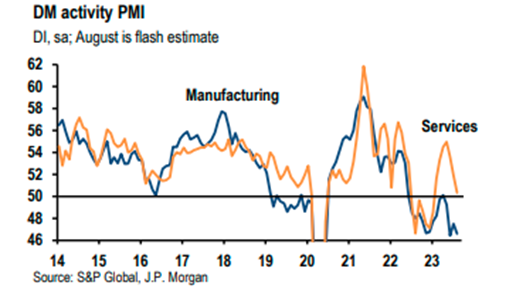
Anyway, employment is a lagging indicator of activity in a capitalist economy. The lead indicator starts with profits, then investment and production, then employment and consumer spending. Corporate profits and corporate profit margins have already been falling. Investment growth is slowing. And manufacturing is in recession. A high frequency indicator of economic activity, the JPM global PMI, is indicating that the manufacturing sector is contracting (any score below 50) and the services sector is now virtually doing so, both globally and in the US.
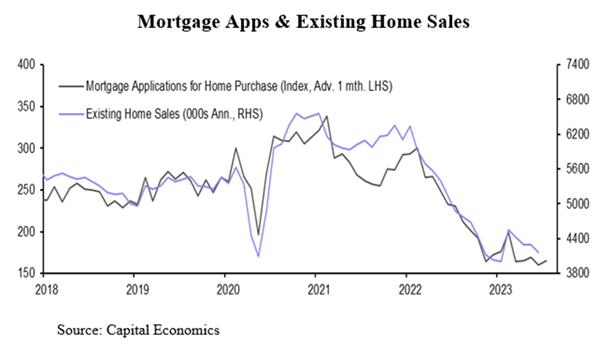
As for the consumer, housing markets in the major economies are dead in the water.
But no worries. Powell remarked: “While nominal wage growth must ultimately slow to a rate that is consistent with 2 percent inflation, what matters for households is real wage growth. Even as nominal wage growth has slowed, real wage growth has been increasing as inflation has fallen.” That sounds good, but he did not say that since the end of the pandemic, consumer prices have risen by 17-19% and wage rises have been well short of that. And these higher price levels are here to stay forever, so wages will have to rise a lot more to recoup the losses in real incomes over the last two years.
While the economic ship is showing signs of leakage, up on the bridge, Captain Powell says that he is “navigating by the stars under cloudy skies.” In other words, he does not know if the ship will make port before sinking. Indeed, “there is always uncertainty about the precise level of monetary policy restraint.” He went on: “These uncertainties, both old and new, complicate our task of balancing the risk of tightening monetary policy too much against the risk of tightening too little. Doing too little could allow above-target inflation to become entrenched and ultimately require monetary policy to wring more persistent inflation from the economy at a high cost to employment. Doing too much could also do unnecessary harm to the economy.”
Indeed, ‘managing’ an anarchic capitalist economy is not easy – indeed impossible. Even worse, the navigation guide that Powell and mainstream economics are trying to use is the so-called ‘neutral policy rate’ that supposedly tells economists when demand and supply; or more accurately, aggregate savings and investment, are in balance. But this r*, as it named, is a nonsense concept that comes from the neoclassical equilibrium economics of Kurt Wicksell. Many studies have shown up the myth of this theory. It’s less an astronomic navigation tool and more the astrology of the zodiac. Nevertheless, Powell referred to this ‘natural rate of interest’ theory as his policy foundation, but then dissed it by saying “we cannot identify with certainty the neutral rate of interest, and that assessment is further complicated by uncertainty about the duration of the lags with which monetary tightening affects economic activity and especially inflation.” Yes, indeed.
But the Jackson Hole ‘symposium’, as it is called, is not just an opportunity for central bankers to explain and defend their monetary policy. It is also when the central bankers hear from leading mainstream economists about important trends and issues in the world economy. This year’s theme was: Structural Shifts in the Global Economy – in other words, looking at the long-term economic factors rather than the success of the policy on inflation.
While Powell only defended short-term Fed monetary policy, ECB President Christine Lagarde at least addressed the theme of the symposium in her address called, Policymaking in an age of shifts and breaks. Lagarde looked at long-term trends in inflation and trade. It made sober listening and reading.
Like Powell, she pointed out that the low level of unemployment was now being accompanied by falling hours of work. Digitilisation and remote working had increased and “according to one estimate, more than a quarter of jobs in advanced economies rely on skills that could easily be automated., even if this does not necessarily lead to a fall in available jobs.”
She pointed out that trade barriers had increased tenfold in the past decade, weakening international trade growth. So-called ‘free trade’ was being replaced by so-called ‘reshoring’ and ‘friend-shoring’ in strategic industries and so global supply chains were fragmenting. The ECB’s economists reckon that this could cut international trade by 12-19%; raise the world’s core inflation by 1.0-4.8% p.a. and lower global GDP by 1.0-5.0% from where it would have been over the rest of this decade!
Also this may mean that inflation will not return to previously low levels that existed before the pandemic – as inflation is being kept higher by these supply factors, not ‘excessive’ demand’. “These shifts – especially those related to the post-pandemic environment and energy – have contributed to the steep rise in inflation over the last two years. They have restricted aggregate supply while also directing demand towards sectors with capacity constraints”. So “for a start, we are likely to experience more shocks emanating from the supply side itself.” So much for the Powell thesis of demand factors.
Lagarde also indicated that rising arms spending plus greater supply constraints would mean “we are likely to see stronger price pressures in markets like commodities – especially for the metals and minerals that are crucial for green technologies.” So the problem is not going away but may get worse. So, unlike Powell, Lagarde admitted that supply constraints and corporate price rises had been driving inflation up and were now likely to keep the inflation rate permanently higher than before. “Under such conditions, we saw that firms are not only more likely to adjust prices, but also to do so substantially.
Despite that admission, Lagarde was quick to turn the focus on wages not profits: corporate price hikes were blamed on workers demanding more wages: “as we are seeing today, when workers have greater bargaining power, a surge in inflation can trigger “catch up” wage growth which can lead to a more persistent inflation process.” You see, workers asking for more wages to catch up with inflation only forces companies to raise prices to preserve profits – and of course, the latter is sacrosanct.
Lagarde went on: “we will have to be extremely attentive that greater volatility in relative prices does not creep into medium-term inflation through wages repeatedly “chasing” prices. That could make inflation more persistent if expected wage increases are then incorporated into the pricing decisions of firms, giving rise to what I have called “tit-for-tat” inflation.“
With her tit-for-tat image, Lagarde echoed the argument of Tom Weston in 1865 in a debate with Marx that workers should not ask for higher wages when prices rise because companies would respond with higher prices to protect their profits and so workers would gain nothing.
The rest of the symposium was taken up with presentations by leading mainstream economists on different aspects of the ‘structural shifts in the global economy’. And again they did not paint a picture of prosperity ahead.
One paper found that continued high interest rates set by the Fed and other central banks were, not surprisingly, likely to force significant declines in R&D investment and innovation. For every 1% hike in the rate, R&D spending would decline by about 1-3% and patents drop off by up to 9% over the next few years.
“We have to invest ever-rising resources in R&D just to maintain a constant rate of economic growth. ◦… we have to run faster and faster to stay in the same place, i.e. to maintain 2% overall growth.” Why was not explained.
Another paper reckoned that as the US reduced its sourcing of products from China, ”it is unclear if these measures will reduce US dependence on supply chains linked to China, and there are moreover already signs that prices of imports from Vietnam and Mexico are on the rise.” So isolating China could be damaging to global growth.
Another paper commented that public sector debt had “soared to unprecedented peacetime heights”. But the authors reckoned that “high public debts are not going to decline significantly for the foreseeable future. Countries are going to have to live with this new reality as a semi-permanent state.” That would ever more emerging economies in the Global South going into debt distress. – some 60% of such countries already in trouble. Other papers worried about the decline in the prospects for world trade and growth.
It seems that if world’s major economies sink into a slump or face unsustainable debts in the rest of this decade, there would be no ‘escape hatch’ from productivity growth or increased exports because innovation was being squeezed by high interest rates; and trade was being squeezed by US sanctions on Russia and China and by the rise in trade barriers. It all sounds like the 1930s not the roaring 20s.
It is navigating the stars in cloudy skies on a sinking ship in search of a safe harbour.


August 24, 2023
BRICS: getting bigger, but is it any stronger?
The three-day summit of the BRICS leaders ends today. The BRICS are Brazil, Russia, India, China and South Africa. Russian leader Putin was not present in person – he has plenty on his plate already!

The five BRICS nations now have a combined GDP larger than that of the G7 in purchasing power parity terms (a measure of what GDP can buy domestically in goods and services).
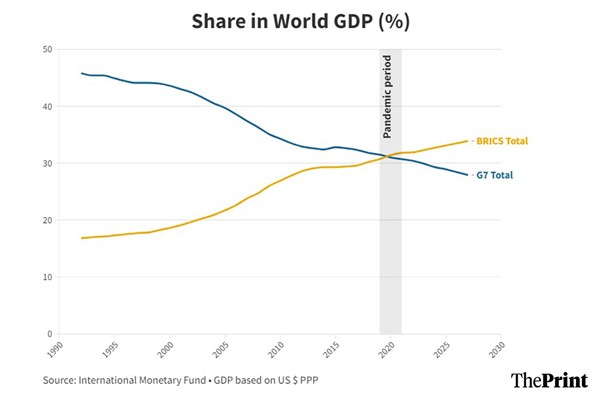
This sounds like a turning point in the world economic order. But that would be an illusion. First, within the BRICS, China (accounting for 17.6 per cent of global GDP) is dominant, followed by India at a distant second (7 per cent); while Russia (3.1 per cent), Brazil (2.4 per cent), and South Africa (0.6 per cent) together made up just 6.1 per cent of world GDP. So this is no equally shared economic power.
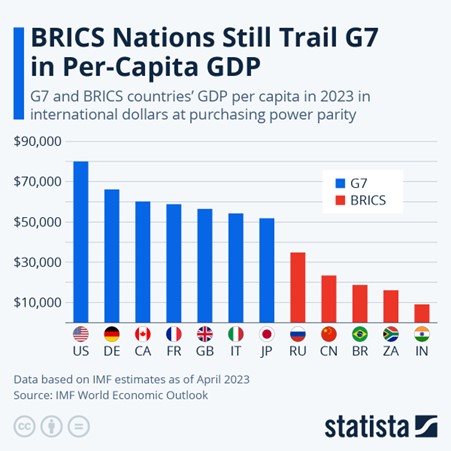
Moreover, in nominal dollar terms, which in my opinion is what matters, the BRICS countries are still well behind the G7. Combined, the BRICS bloc had a GDP of USD26trn in 2022, which is about the same as the US alone. And when we measure GDP per person, the BRICS are nowhere. Even using PPP-adjusted international dollars, the United States’ per-capita GDP amounts to $80,035, more than three times that of China, which amounts to $23,382.
From this summit, more countries have been invited to join as full members: Argentina, Egypt, Ethiopia, Iran, Saudi Arabia and the United Arab Emirates. But even if that happens, the BRICS group will remain a much smaller and weaker economic force than the G7 imperialist bloc. Moreover, the BRICS are very diverse in population, GDP per head, geographically and in trade composition. And the ruling elites in these countries are often at loggerheads (China v India; Brazil v Russia).
So, unlike the G7, which has increasingly homogenous economic objectives under the hegemonic control of the US, the BRICS group is disparate in wealth and income and without any unified economic objectives – except maybe to try and move away from the economic dominance of the US and in particular, the US dollar.
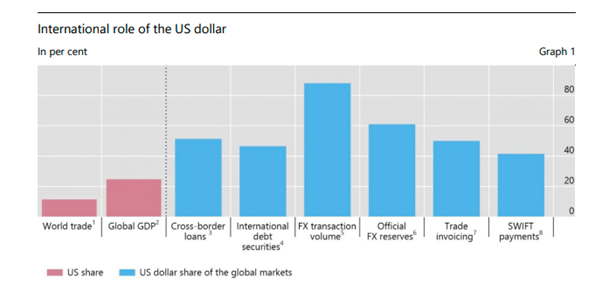
And even that objective is going to be difficult to achieve. As I have pointed out in previous posts, even though there has been a relative decline in US economic dominance globally and in the dollar, the latter remains the most important currency by far for trade, investment and national reserves.
Approximately half of all global trade is invoiced in dollars and this share has hardly changed. The USD was involved in nearly 90% of global FX transactions, making it the single most traded currency in the FX market. Approximately half of all cross-border loans, international debt securities, and trade invoices are denominated in US dollars, while roughly 40 percent of SWIFT messages and 60 percent of global foreign exchange reserves are in dollars. The Chinese yuan continues to make gradual gains and the renminbi’s share in global FX turnover has increased from less than 1% 20 years ago to more than 7% now. But the Chinese currency still only represents 3 percent of global FX reserves, up from 1 percent in 2017.
And it’s even the case that ‘anti-US’ China remains heavily committed in its FX reserves to the US dollar. China publicly reported that it reduced the dollar share of its reserves from 79% to 58% between 2005 and 2014. But China doesn’t appear to have changed the dollar share of its reserves in the last ten years.
Moreover, multilateral institutions that could be an alternative to the existing IMF and World Bank (controlled by the imperialist economies) are still tiny and weak. For example, there is the New Development Bank set up in 2015. The NDB has now appointed Brazil’s former leftist President Dilma Roussef as head, based in Shanghai.
There is much noise that the NDB can provide an opposite pole of credit to the imperialist institutions of the IMF and World Bank. But there is a long way to go in doing that. One ex-official of South African Reserve bank (SARB) commented: “the idea that Brics initiatives, of which the most prominent thus far has been the NDB, will supplant Western-dominated multilateral financial institutions is a pipe dream.”
Even so, international rivalry, politically, economically and militarily, is going to hot up in this decade. The days of complete domination by the imperialist bloc under the US are over – because globalization ie unimpeded trade and financial flows of the last two decades of the 20th century, is over.
As the profitability of capital fell back in the major economies in the first two decades of this century, the struggle for surplus value by the major capitalist economies has intensified. And this is leading to a fragmentation of economic power. The US-led imperialist bloc is still dominant, but its dominance is being questioned as never before.
ADDENDUM: 1% of all adults in the world own 44.5% of all personal wealth, while more than 52% have only 1.2%
My last post was on the Global Wealth report produced every year by Credit Suisse and associated economists. It showed that in 2021, 1.2% of adults had 47.8% of the world’s wealth while 53.2% had just 1.1%.
However, as I published that post, the 2023 global wealth report was released, now under the name of UBS which has taken over Credit Suisse (that’s another story). Now the data show that in 2022, global wealth inequality dropped back to 1% of adults (59m) owning 44.5% of all personal wealth, still slightly higher than before the pandemic in 2019. At the other end of the wealth pyramid, the bottom 52.5% of the world’ population (2.8bn) had net wealth of just 1.2%, slightly better than in 2021.

2022 recorded the first fall in net global household wealth since the global financial crisis of 2008. One reason was an appreciation of the US dollar against other currencies, reducing the dollar wealth of non-dollar countries. Indeed, if exchange rates are held constant at 2021 rates, then total wealth increased by 3.4% and wealth per adult by 2.2% during 2022.
The other reason was the relative decline in financial wealth during 2022 as stock and bond markets prices fell. So the number of US dollar millionaires worldwide fell by 3.5 million during 2022 to total 59.4 million at year-end. The ultra-high net-worth (UHNW) group with wealth above USD 50 million had 22,490 fewer members than in 2021, with North America accounting for 81% of this decline.
But the long-term trends outlined in the post on the 2022 report remain. The vast majority of rich and very rich people still live in the so-called ‘Global North’. This century, the rise of household wealth in emerging markets, most notably in the large populations of China and India, has narrowed wealth differences between countries. And this has been the dominant factor governing the overall slightly downward global inequality trend.

China’s median wealth per person in 2000 was about twice the world average; now it is more than three times. Moreover, it is now higher than the average for the whole of Europe (that’s Western and Eastern Europe)!
And this point remains: If you own a property to live in and, after taking out any mortgage debt, you still have over $100,000 in equity and any savings, you are among the wealthiest 10% of all adults in the world. You may find that difficult to believe, but it’s true because most adults in the world have no wealth to speak of at all.
And apart from phenomenal rise of China, personal wealth and power remains in the imperialist bloc of North America, Europe and Japan with add-ons from Australia. Just as the imperialist bloc rules over trade, GDP, finance and technology, it has nearly all the personal wealth.
August 22, 2023
1.2% of adults have 47.8% of the world’s wealth while 53.2% have just 1.1%
Every year, I bring to the attention of readers of my blog, the results of the latest Credit Suisse Wealth Report. It is produced by economists Anthony Shorrocks (with whom I graduated at university), James Davies and Rodrigo Lluberas. It is the most comprehensive study of global personal wealth and inequality between adults around the world.
Personal wealth is defined as ownership of real estate and financial assets (stocks, bonds and cash) less debt for all the adults in the world. According to the 2022 report, by the end of 2021, global wealth reached $463.6 trillion, which is an increase of 9.8% versus 2020 and far above the average annual +6.6% recorded since the beginning of the century. Setting aside exchange rate movements, aggregate global wealth grew by 12.7%, making it the fastest annual rate ever recorded. Average wealth per adult rose to $87,489 at the end of 2021. On a country-by-country basis, the United States added the most household wealth in 2021, followed by China, Canada, India and Australia.

This increase in wealth (real estate and financial assets) was not shared equally. On the contrary, the wealth share of the global top 1% rose for a second year running to reach 45.6% in 2021, up from 43.9% in 2019. This is represented in the report by a pyramid.
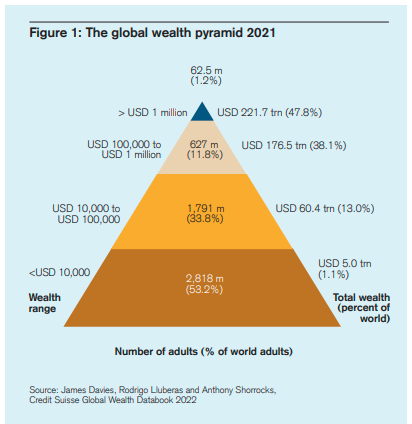
The wealth pyramid shows that 62 million people out of a total of 4.4 billion adults in the world, or just 1.2%, had 47.8% of the world’s wealth while 2.8 billion adults (or 53.2%) had just 1.1% – a staggering level of inequality. While the top 1.2% had average wealth after debt of well over $1 million each, the bottom 53% had well below $10,000 each, at least 100 times less.
And within the wealthiest group, the inequality is equally stark – with yet another pyramid. There are 264,200 ultra-high-networth (UHNW) individuals with net worth above $50 million at the end of 2021. This is 46,000 more than the 218,200 recorded at the end of 2020, which in turn was 43,400 higher than in 2019. These increases are more than double the increases recorded in any other year this century. Taken together, it means that the number of adults with wealth above $50 million expanded by more than 50% in the two years 2020 and 2021. This recent rise in inequality is due to the surge in the value of financial assets during and after the COVID-19 pandemic – and it’s the rich that own most of the financial assets.

The overall increase in global wealth mainly reflects the rise in wealth in China and in the expansion of the ‘middle class’ in the so-called developing world. Even so, this group’s average wealth is $33,724, or only about 40% of the level of average wealth worldwide. The majority of rich and very rich people still live in the so-called ‘Global North’. But note that 7% of the very poorest people in the world live in North America.

Global inequality rises or falls in response to changes in wealth inequality within countries: the so-called “within-country” component. But it is also affected by changes in the average wealth levels in countries relative to the global average: the “between-country” component. This century, the rise of household wealth in emerging markets, most notably I China and India, has narrowed wealth differences between countries, so that the between-country component has declined quite rapidly. This has been the dominant factor governing the overall downward inequality trend.
In the 21st century, median wealth per person has risen from $1613 in 2000 to $8296 in 2021, an annual rise of 8.1%. But this is the result of the sharp rise in median wealth in China from $3133 per person to $26752 in 2021 (12% a year), or from 7% of North America’s median wealth in 2000 to 28% in 2021. China’s median wealth per person in 2000 was about twice the world average; now it is more than three times.
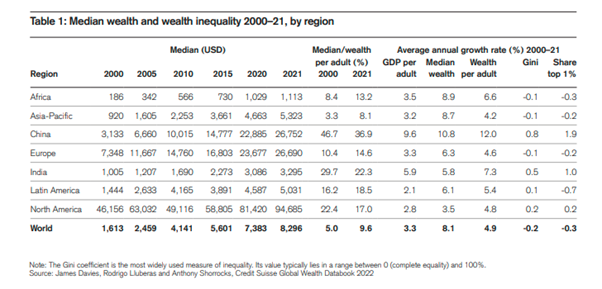
India too saw a rise in median wealth per adult from $1005 in 2000 to $3295 in 2021, 7% a year, but in 2000, India’s wealth per adult was just 2% of that in North America; now it is just 3%; and India’s adults remain well below the world average. Indeed, that ratio fell from 62% in 2000 to 40% now. India is going backwards relatively, while China is going forwards relatively.
And here is a key point worth considering. If you own a property to live in and, after taking out any mortgage debt, you still have over $100,000 in equity and any savings, you are among the wealthiest 10% of all adults in the world. You may find that difficult to believe, but it’s true because most adults in the world have no wealth to speak of at all.
As for inequality between men and women, the report finds that of the 26 countries that make up 59% of the global adult population, 15 countries (including China, Germany and India, for example) show a decline in the wealth of women over the last two years.
As for the super rich worldwide, there were 62.5 million millionaires at the end of 2021, up 5.2 million from a year earlier. The United States added 2.5 million new millionaires, almost half of the global total. This is the largest increase in millionaire numbers recorded for any country in any year this century and reinforces the rapid rise in millionaire numbers seen in the United States since 2016. The US now has 39% of all millionaires in a population of 350m, while China has 10% with a population of 1.4bn.

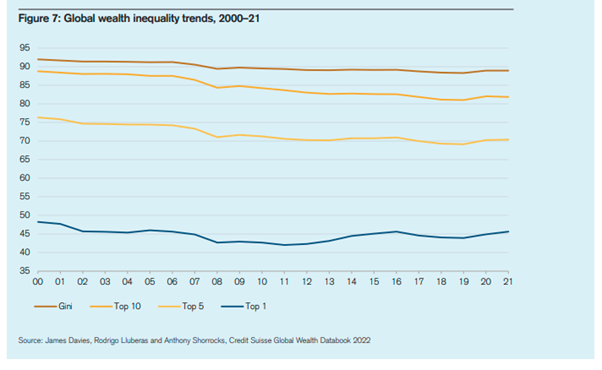
As for wealth inequality within countries, at year-end 2021, the Gini coefficient (the usual measure of inequality) for wealth was a huge 85.0 in the United States (remember 100 would mean one adult owning all the wealth). Indeed, in the United States, all measures of inequality have trended upward since the early 2000s. For instance, the wealth share of the top 1% of adults rose from 32.9% in 2000 to 35.1% in 2021 in the United States.
What about China? Well, the wealth Gini coefficient rose from 59.5 in 2000 to peak at 71.7 in 2016. Then it eased back to 70.1 by 2021, close to where it was in 2010 and some 20% lower than in the US. Wealth inequality in India was much higher in 2000 and has risen since. The Gini coefficient rose from 74.6 in 2000 to 82.3 at the end of 2021. The wealth share of the top 1% went up from 33.2% in 2000 to 40.6% in 2021. Like the US, India is for the very rich.
In some advanced capitalist economies, wealth inequality fell in the first decade of the 21st century but then rose after the global financial crisis and the pandemic slump. By 2021, the wealth Gini had risen slightly above its 2000 level, standing at 70.2 in France and 70.6 in Britain – about the same as China.
The report provides an overall perspective on the disparity of wealth across countries and regions in its world wealth map. That shows that nations with high wealth per adult (above USD 100,000) are concentrated in North America and Western Europe, and among the richer parts of East Asia, the Pacific and the Middle East, with a sprinkling of outposts in the Caribbean.
China and Russia are core members of the “intermediate wealth” group of countries with mean wealth in the range of USD 25,000–100,000. This group also includes more recent members of the European Union and important emerging-market economies in Latin America and the Middle East.
One step below, the “frontier wealth” range of USD 5,000–25,000 per adult is a heterogeneous group that covers heavily populated countries such as India, Indonesia and the Philippines, plus most of South America and leading sub-Saharan nations such as South Africa. Fast-developing Asian countries like Cambodia, Laos and Vietnam also fall within this category.
Countries with average wealth below USD 5,000 comprise the final group, which is dominated by countries in central Africa.

The imperialist bloc is North America, Europe and Japan with add-ons from Australia. Just as the imperialist bloc rules over trade, GDP, finance and technology, it has nearly all the personal wealth.
August 16, 2023
Russia’s war economy
This week Russia’s central bank held an extraordinary meeting to discuss the level of its key interest rate after the Russian ruble fell to its weakest point in almost 17 months. The meeting decided to hike the bank’s interest rate for borrowing to 12% (up from 8.5%) in order to support the ruble.
The currency has been steadily losing value since the beginning of the year and has now slid past RUB100/$. That’s down 26%. The main cause of this decline is the fall in oil export revenues and the rising cost of military spending to prosecute the war against Ukraine.
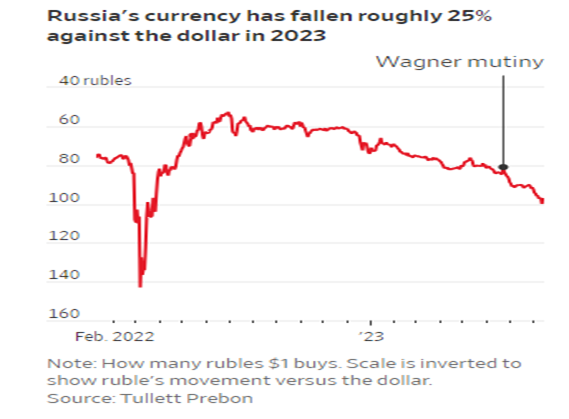
When the Russian invasion began in February 2022, the ruble dropped to a record low of RUB150/$. Rich Russians took their money out to the tune of $170bn, most of which ended up in Europe’s property and banks.
Russia: net foreign capital flows $bn quarterly

Weeks after Russia invaded Ukraine, a US official predicted that sanctions would cut Russia’s GDP in half. But that proved nonsense. It fell just 2.5%. That’s because the central bank introduced capital controls that stopped the flow of money from rich Russians out of the country. And as the price of energy rocketed over the next year, the ruble gained strength and reached a seven year high. Export revenues rose, while the sanctions and falling domestic demand led to a drop in imports, so Russia’s trade balance and current account rose sharply, bolstering the ruble. Two-thirds of the trade surplus was due to rising export revenues and one-third due to falling imports.
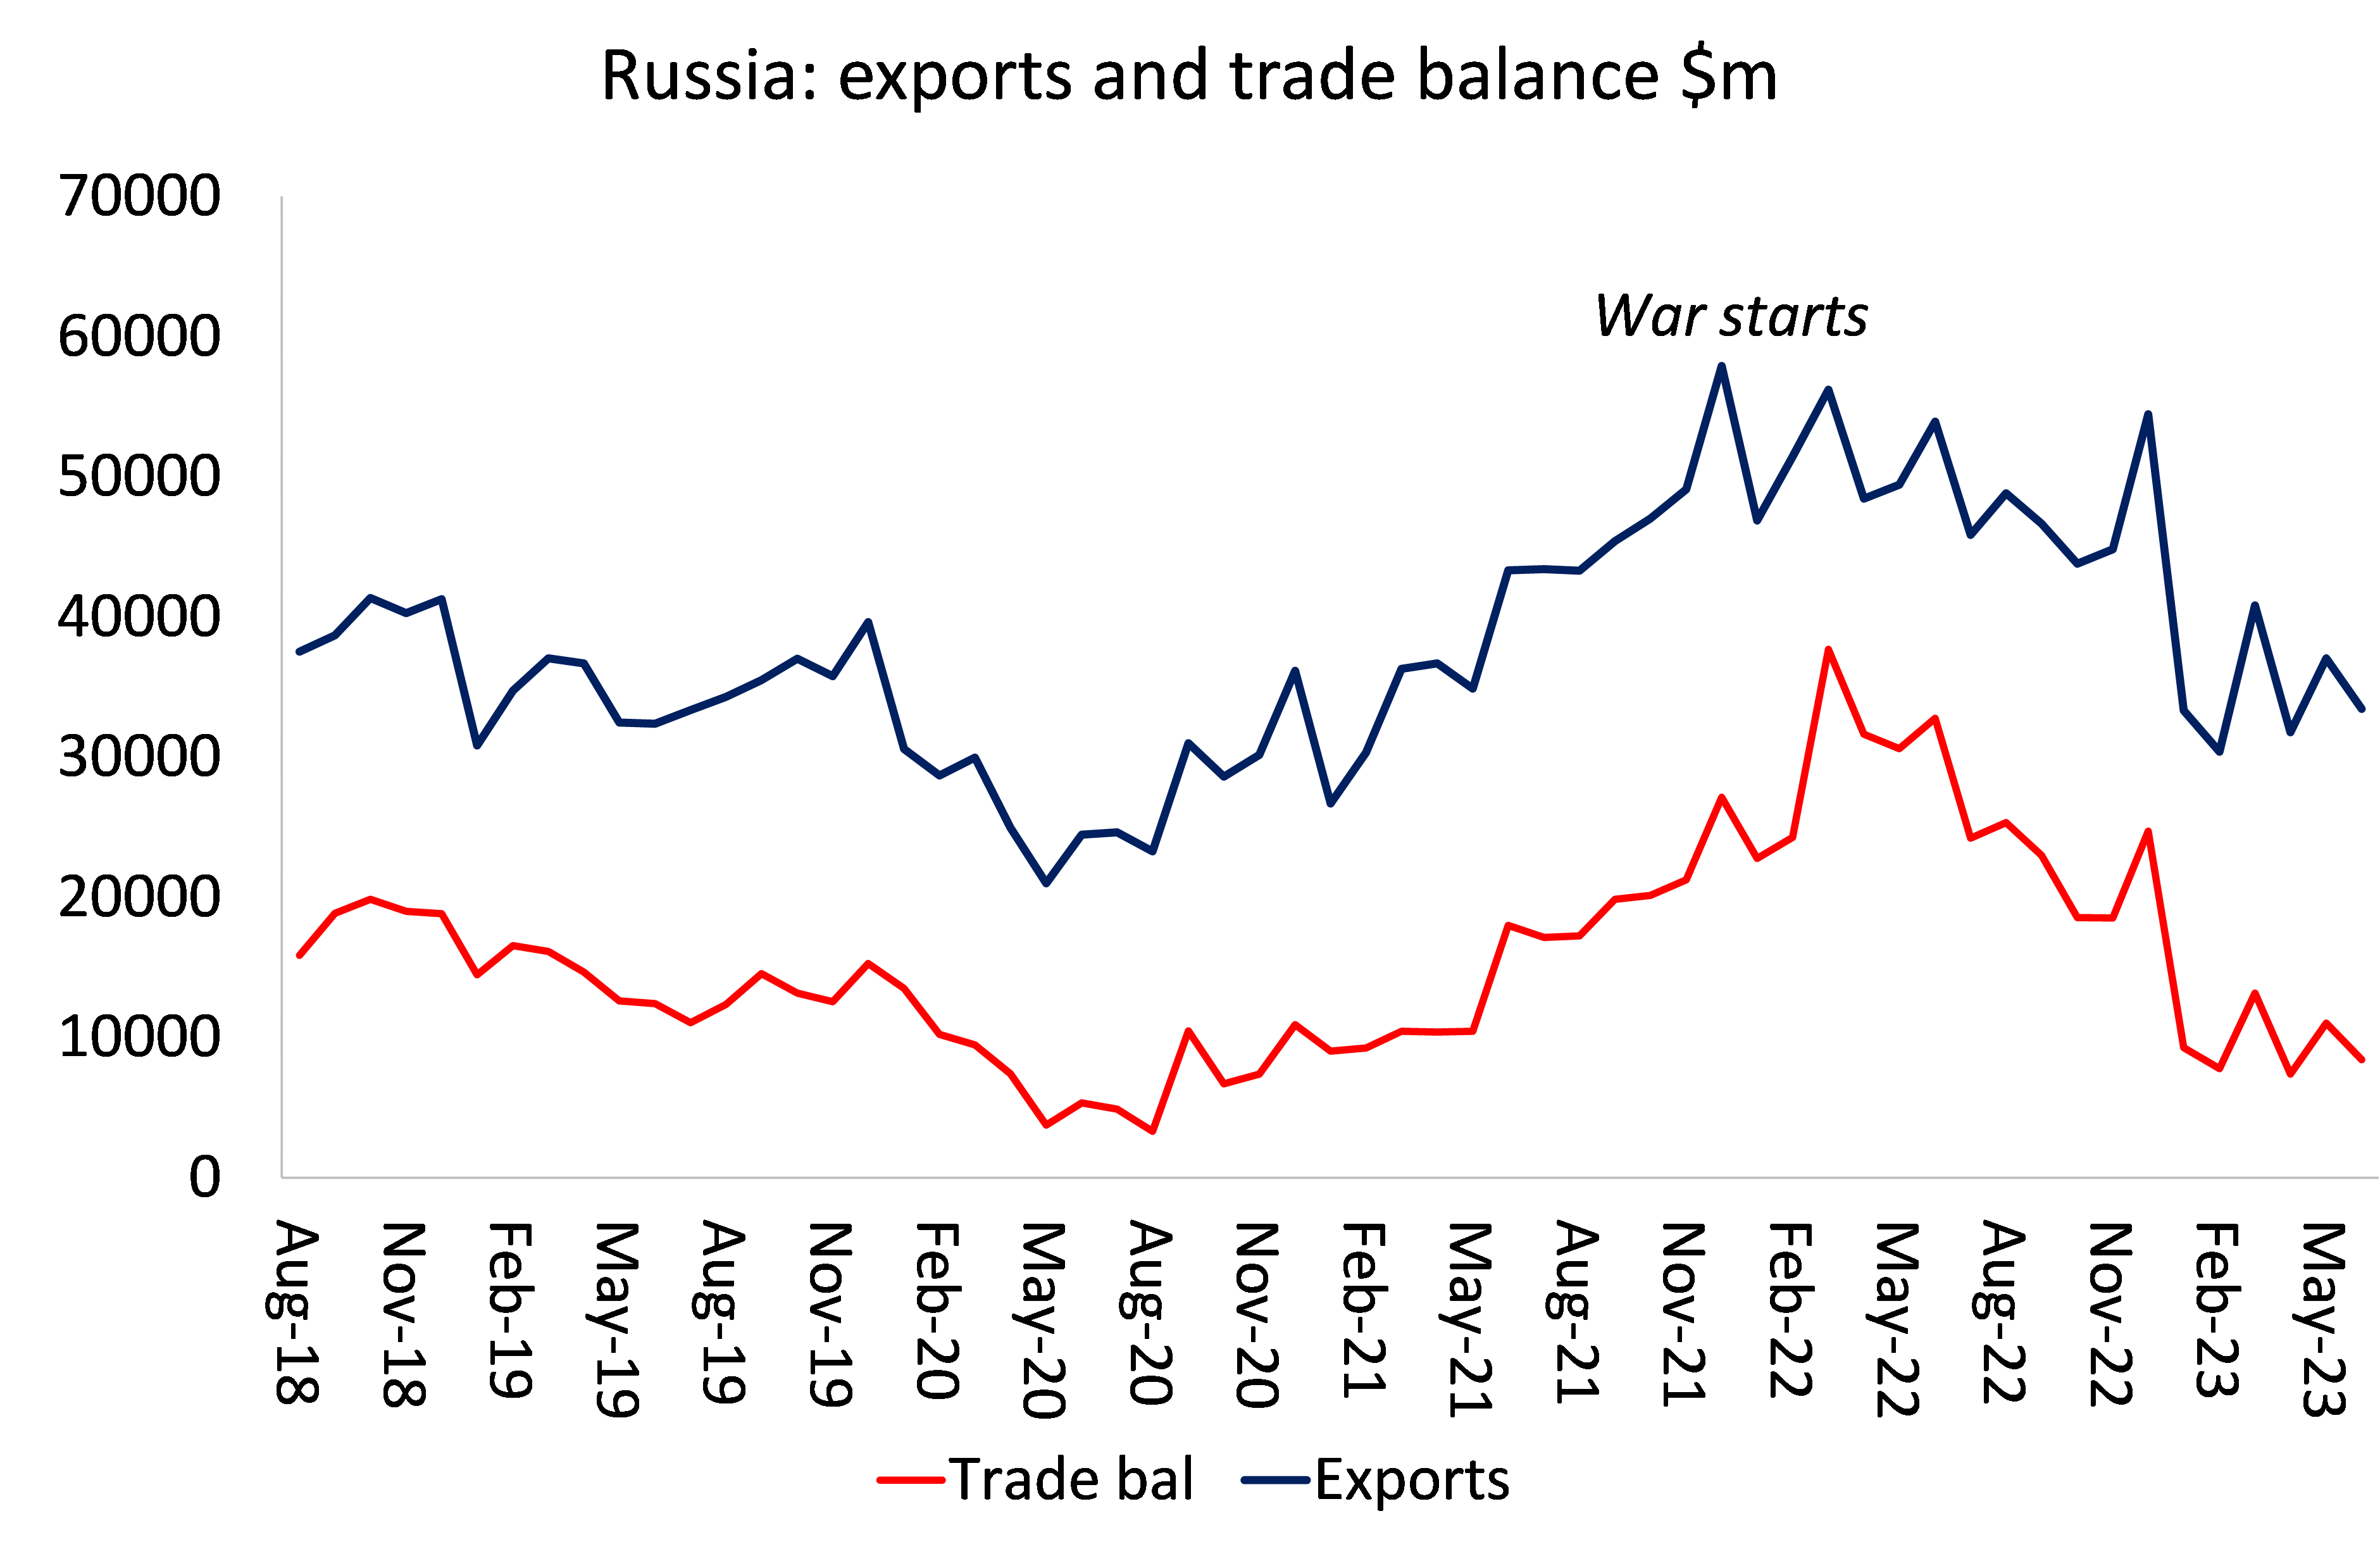
It seemed that sanctions on Russian banks and companies and a ban on using Russian energy had failed to bring the Russian economy to its knees. Russia was able to reroute its energy exports into Asia (if at a lower price) and find ’shadow’ shipping to deliver it.
But energy prices have slipped back in the last six months and the price cap on Russian oil imposed and enforced by the NATO allies has had some effect in reducing export revenues, while the costs of the war have increased. The 2023 defence budget is planned at $100bn, or one-third of all public spending.
Government spending on the war, RUB bn

Russia’s national output rose 4.9% in Q2 2023 compared to the same period in 2022. That sounds good, but much of the rise in output has been in the production of military equipment and services. The output of “finished metal goods” ie weapons and ammunition, rose by 30% in the first half of the year compared with last. Production of computers, electronic and optical products also rose by 30%, while the output of special clothing has jumped by 76%. By contrast, auto output is down over 10% year-over-year. Russia is now a war economy. Russia has been able to import many of the goods that the West has banned—from iPhones to cars to computer chips—but it does so via third countries, a roundabout way that increases prices.
Immediately after the start of the invasion real wages for the average Russian fell sharply as the domestic economy dived. But energy revenues came through and low domestic demand kept price inflation low. As Russia workers were more and more employed in arms production or in the army, wages rose. In May 2023, real wages were up 13.3% year-on-year. Such an improvement no doubt helps keep support for the Putin regime.
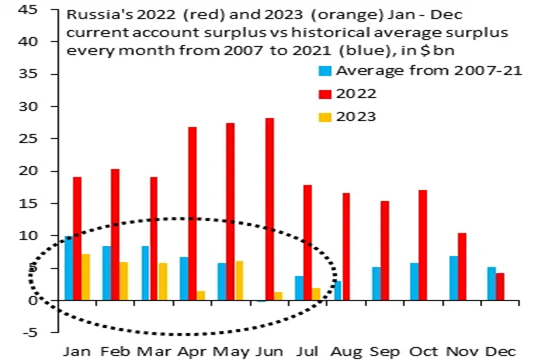
But in recent months the energy revenue bonanza has fallen back. Russia’s energy export revenues are expected to decline from $340 billion in 2022 to $200 billion this year and next. Russia’s current-account surplus shrank to $25.2 billion in the first seven months of the year, an 85% fall compared with the same period last year.
At the start of the war, Russia had a large stock of financial assets ‘for a rainy day’. But it is now raining, if only as a drizzle. Russia’s National Wealth Fund (NWF) had savings and assets worth 10.2% of GDP at the beginning of the invasion. But that is now down to 7.2% as rubles lose value and war spending rises.
And the domestic civil economy and production is suffering. Sanctions are blocking technology imports and other key manufacturing parts. Some 65% of industrial enterprises in Russia are dependent on imported equipment.
But the impact of sanctions is slow burn. It may weaken Russian productivity and domestic production over the long term, but it is not going to stop the Russian war machine now and energy revenues to finance it. That could only happen if fast-growing Asia led by China and India refused to buy Russian oil and gas, but the opposite is the case – they are buying more at cheap prices.
Russia’s war machine will continue but as emigration of skilled workers and capital owned by richer Russians accelerates, it is weakening the currency and reducing available skilled labour in production.

Inflation had fallen in the last year due to the collapse in domestic demand and imported goods. But if the currency continues to dive, then it will start to rise, increasing the pressure on the central bank to raise interest rates to support the currency and try to curb inflation. A stronger ruble and higher interest rates would mean lower foreign currency revenues and a weaker domestic economy. That will hit Russian households hard.
As it is, potential average growth is probably no more than 1.5% per year as Russian growth is restricted by an ageing and shrinking population, with low investment and productivity rates. The profitability of Russian productive capital even before the war was very low.
The economics suggest that Putin can continue the war against Ukraine for several years to come, even taking into account the collapse in the currency and rising inflation and interest rates. Of course, that does not take into account political developments (like the Wagner revolt or gains by Ukraine’s NATO backed army). They could threaten Putin’s rule. And there are presidential elections in Russia next March – as supposedly there are in Ukraine. Both Putin and Zelensky must face the voters – at least theoretically.
But the underlying message is that the weakness of investment, productivity and profitability of Russian capital, even excluding sanctions, means that Russia will remain feeble economically for the rest of this decade.
August 11, 2023
The UK economy: levelling down
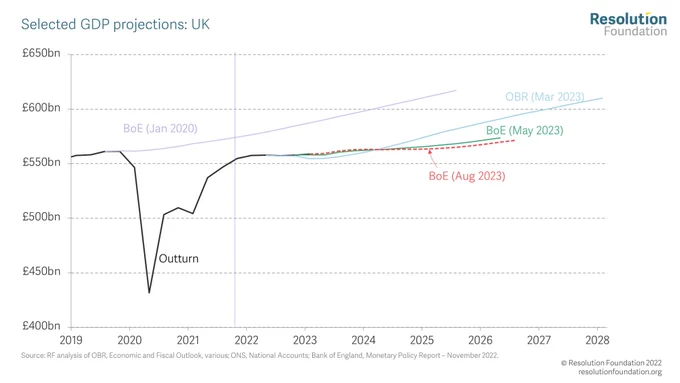
In the second quarter of this year, the UK economy grew by a ‘staggering’ 0.2% in real GDP. The media and government were in raptures that the expected recession in the UK was being avoided. Indeed, real GDP is up 0.4% from the same period in 2022.
So all is well. But no. First, while a ‘technical’ recession (two consecutive quarters of contraction in real GDP) is no longer forecast for 2023, the Bank of England still expects stagnant output for next two years! And that may be the best outcome. The BoE Governor Andrew Bailey said, “We hope we can deliver the path we expect with no recession, but we will have to see”.
As the economic think-tank, the Resolution Foundation put it: “this might not be a technical recession but we are experiencing the weakest growth for 65 years outside of one (a recession).”
And the UK economy is just falling behind. Compared to the rest of the G7 economies, the UK has the highest inflation rate and the second lowest GDP growth (just in front of Germany which went into recession this year).
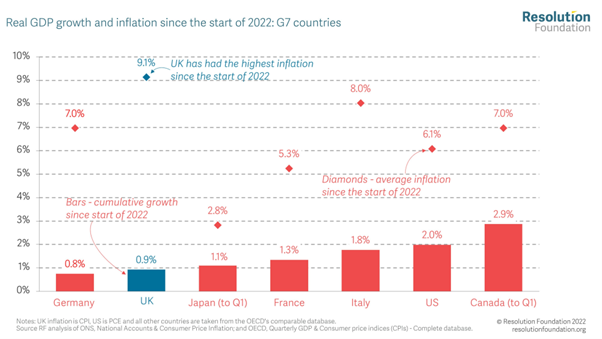
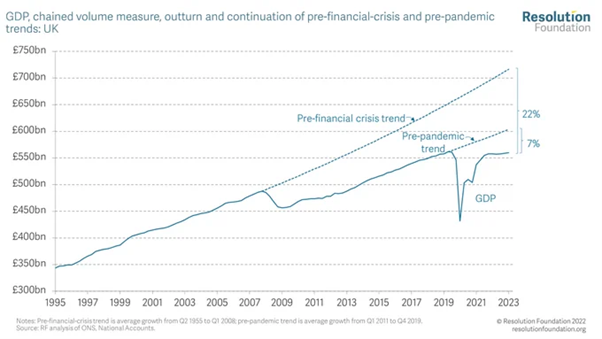
Real GDP growth is still more than 20% below its pre 2008 trend – although that fallback applies to all G7 economies, if at lesser rate.
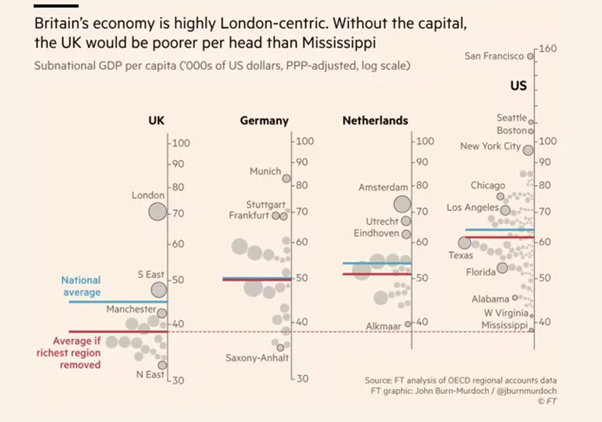
Indeed, people in north-east of England have an average standard of living less than half that of the average Londoner. There is no greater regional disparity anywhere else in Europe or the US. So much for ‘levelling up’.
August 10, 2023
Food, trade and slumpflation
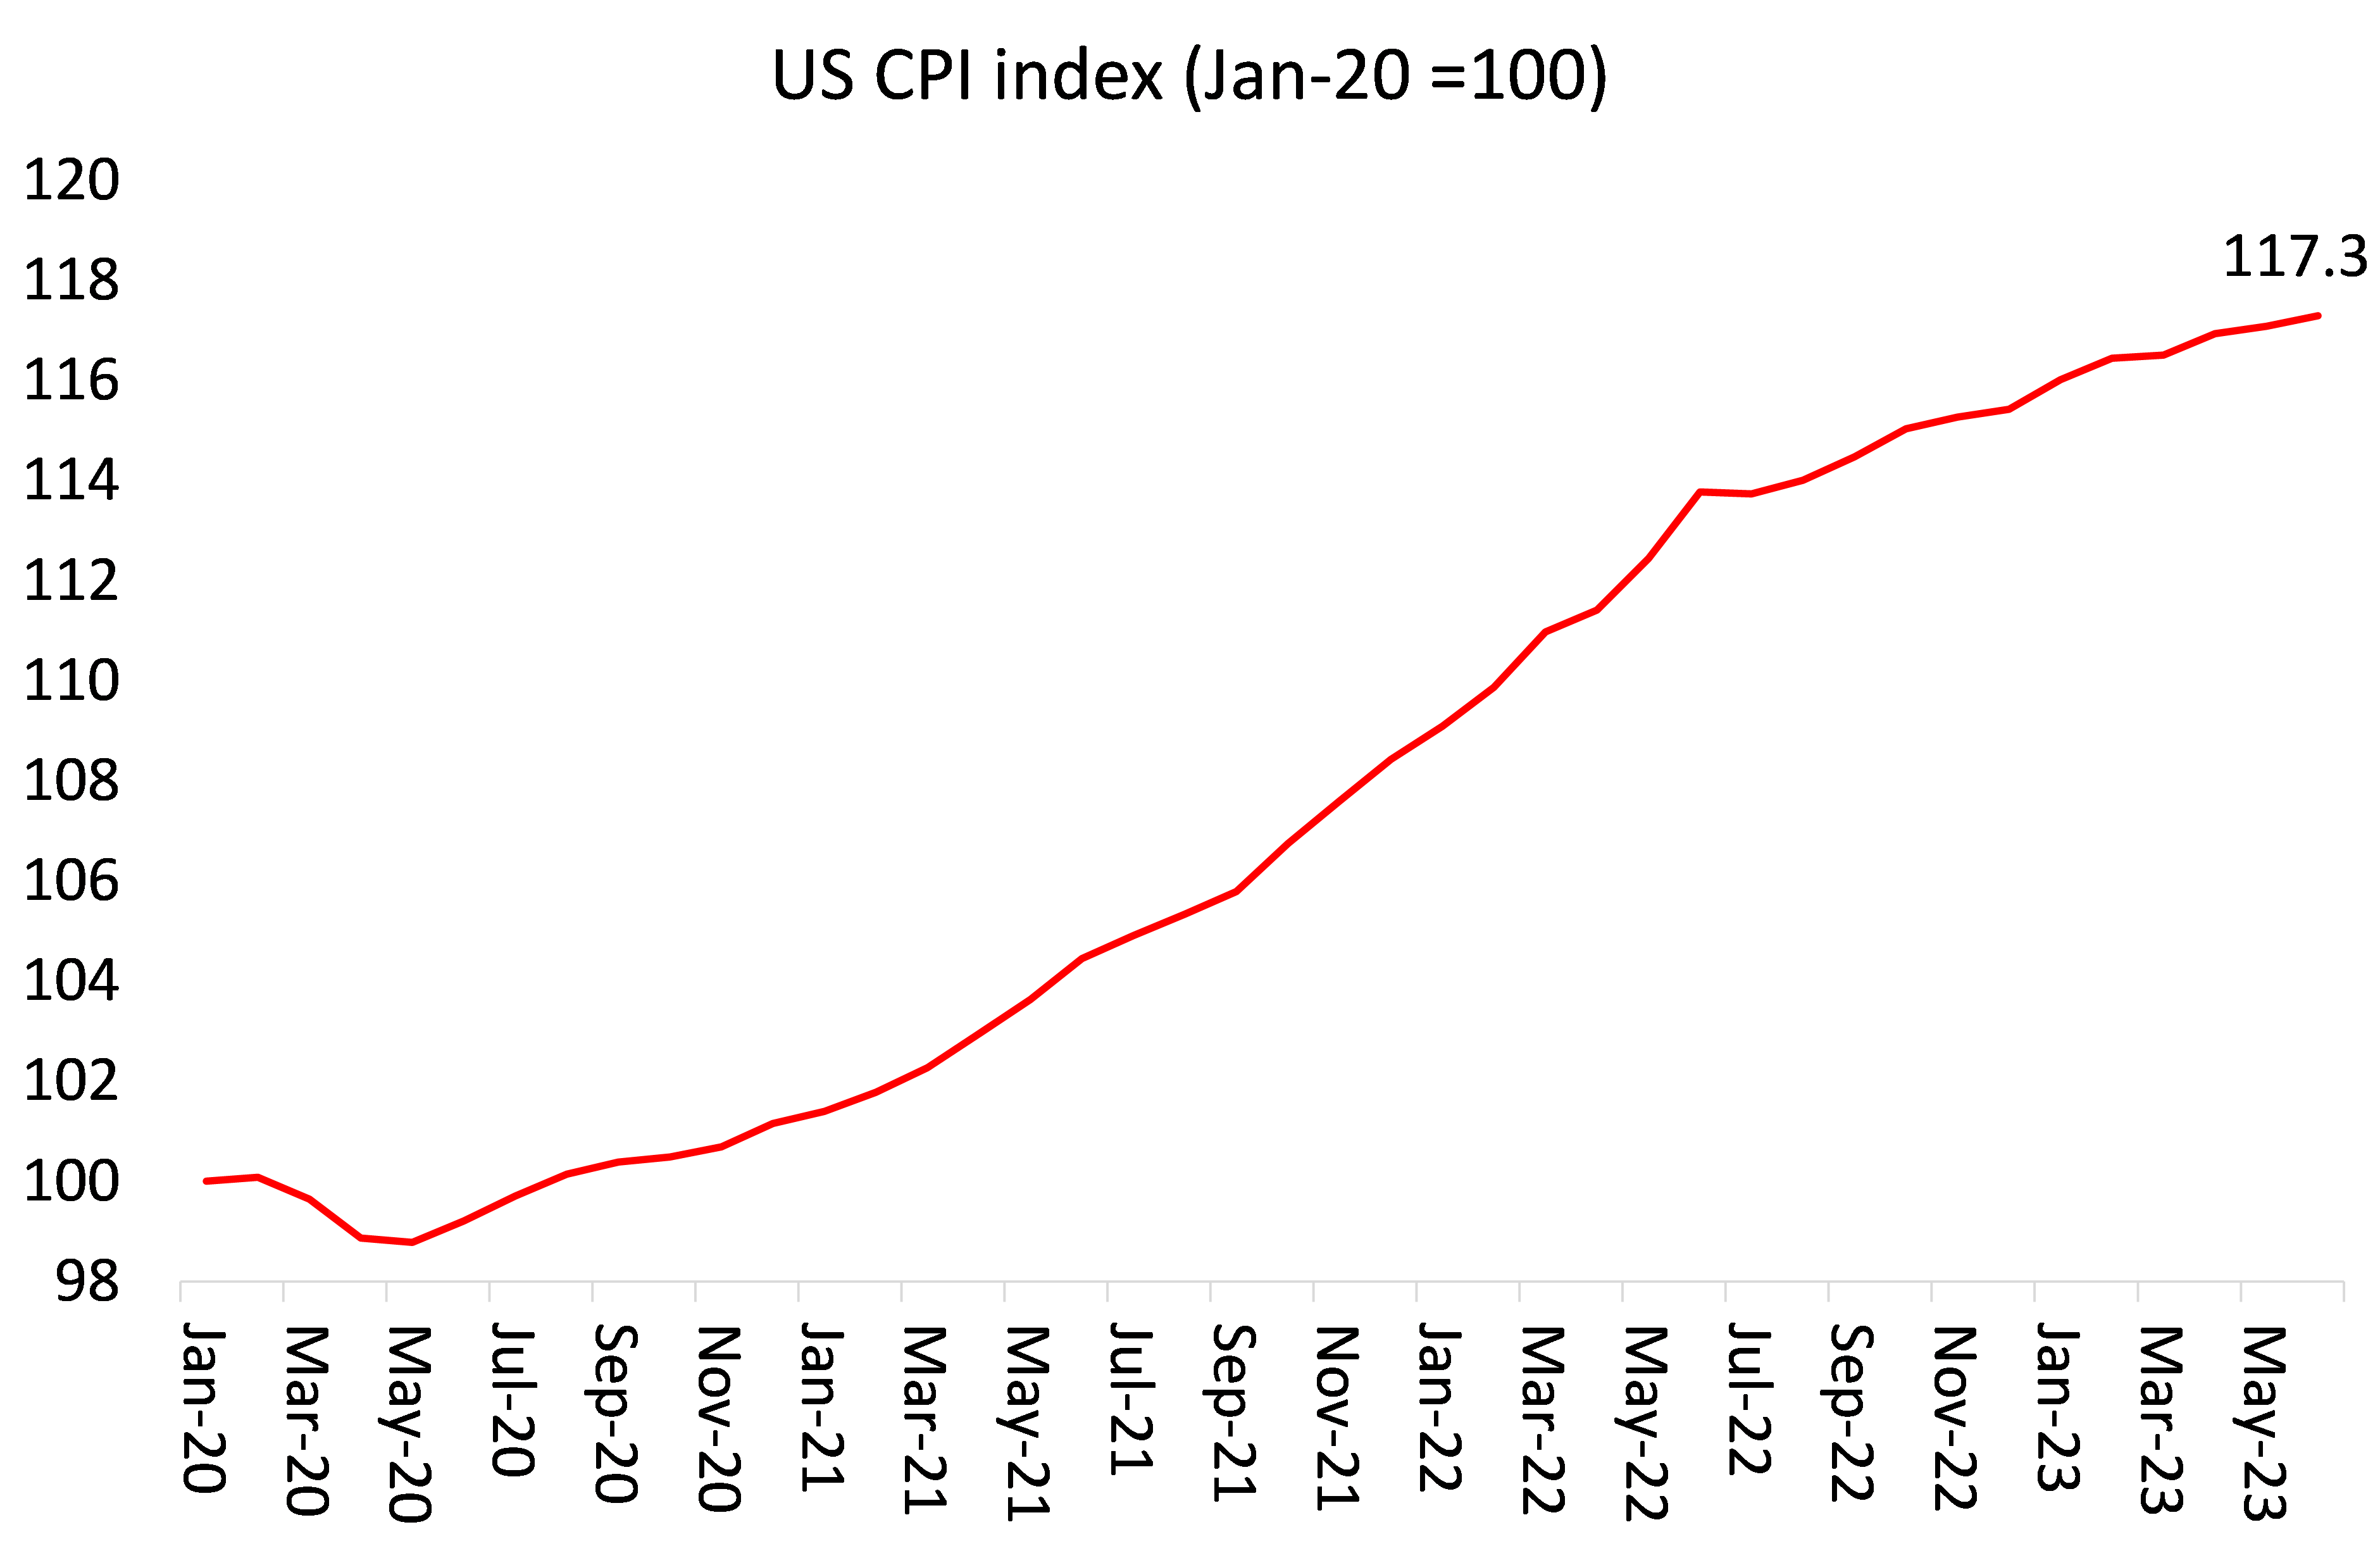
The latest measure of US consumer price inflation for July actually showed an uptick in the year-on-year rate to 3.2% from 3% in June. That is mainly a result of comparison (‘base effects’, they are called) with a drop in the rate last July from the peak in June. Core inflation, which excludes food and energy perices, remained much higher at 4.7% yoy.
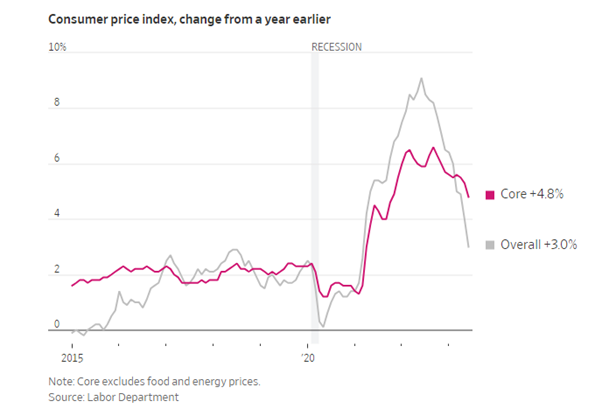
And remember, even if inflation were to fall further towards zero, prices since the end of the COVID pandemic slump are up 10-15% in most G7 economies, with those price sheer to stay and probably rise more. Yes, the inflation rate is slowing, but US consumer prices are 17% higher than they were at the beginning of 2021.
Inflation remains sticky in the US and most G7 economies, which is why central banks continue to talk of further rises in their ‘policy’ interest rates. But the expectation is that national rates of inflation will come down (if slowly) over the rest of this year. Stock and bond market investors and mainstream economists are generally pleased and confident.
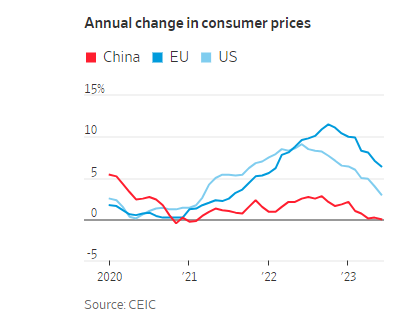
But how about having no inflation at all? That is the situation in China where consumer prices fell in July compared to July 2022. This could be transitory, however. Stripping out volatile food and energy prices, so-called core inflation rose to 0.8% in July, the highest level since January, from 0.4% in June.
Deflation in China has been greeted by the China ‘experts’ as yet another sign that China is heading for a debt deflation disaster. They reckon that if the expectation of falling prices becomes entrenched, it could further sap ‘demand’, exacerbate debt burdens and even lock the economy into a debt trap that will be hard to escape using the stimulus measures Chinese policy makers have traditionally turned to. I have dealt with these arguments in a previous post so I won’t go over the rebuttal.
And I am not sure working people would agree that having no inflation or even falling prices is such a bad thing, particularly as it means, in the case of China that wages are still rising – so real incomes are going up, not down as in the G7 economies. But then, capitalists companies like a bit of inflation to support profits and give them room to raise prices if they can – as we have seen.
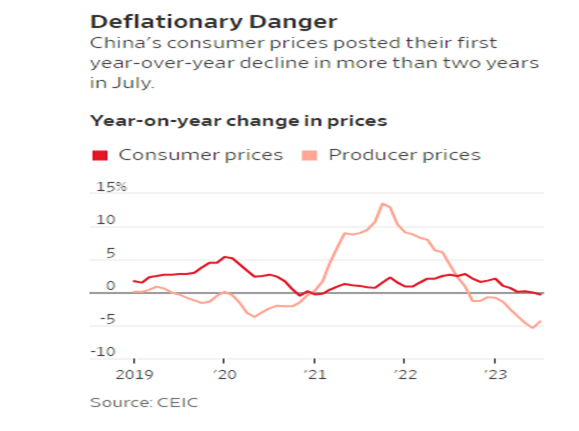
China’s negative consumer inflation result was mainly driven by a drop in food prices from a year earlier, when food prices were pushed up by extreme weather conditions. Prices of pork, a staple of Chinese dinner tables, plunged 26% in July from a year earlier. Vegetable prices also fell last month.
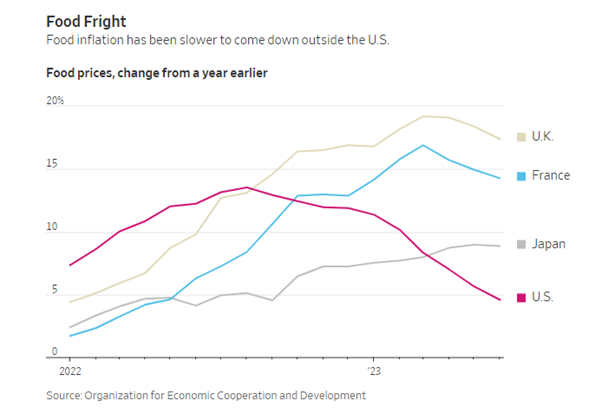
That’s not the case in the G7 economies. UK food prices rose 17.4% in the year through June, while Japanese prices were up 8.9% and French prices were up 14.3%. In each country, food prices are rising much more quickly than prices of other goods and services. The US has fared better, with food prices up only 4.6% from a year earlier in June.
Food prices globally have fallen from the 50-year high in March 2022. But now it seems that the global food price index is turning up again, rising 1.3% in July from June, a second increase in four months. It remains 36% higher than it was three years ago.
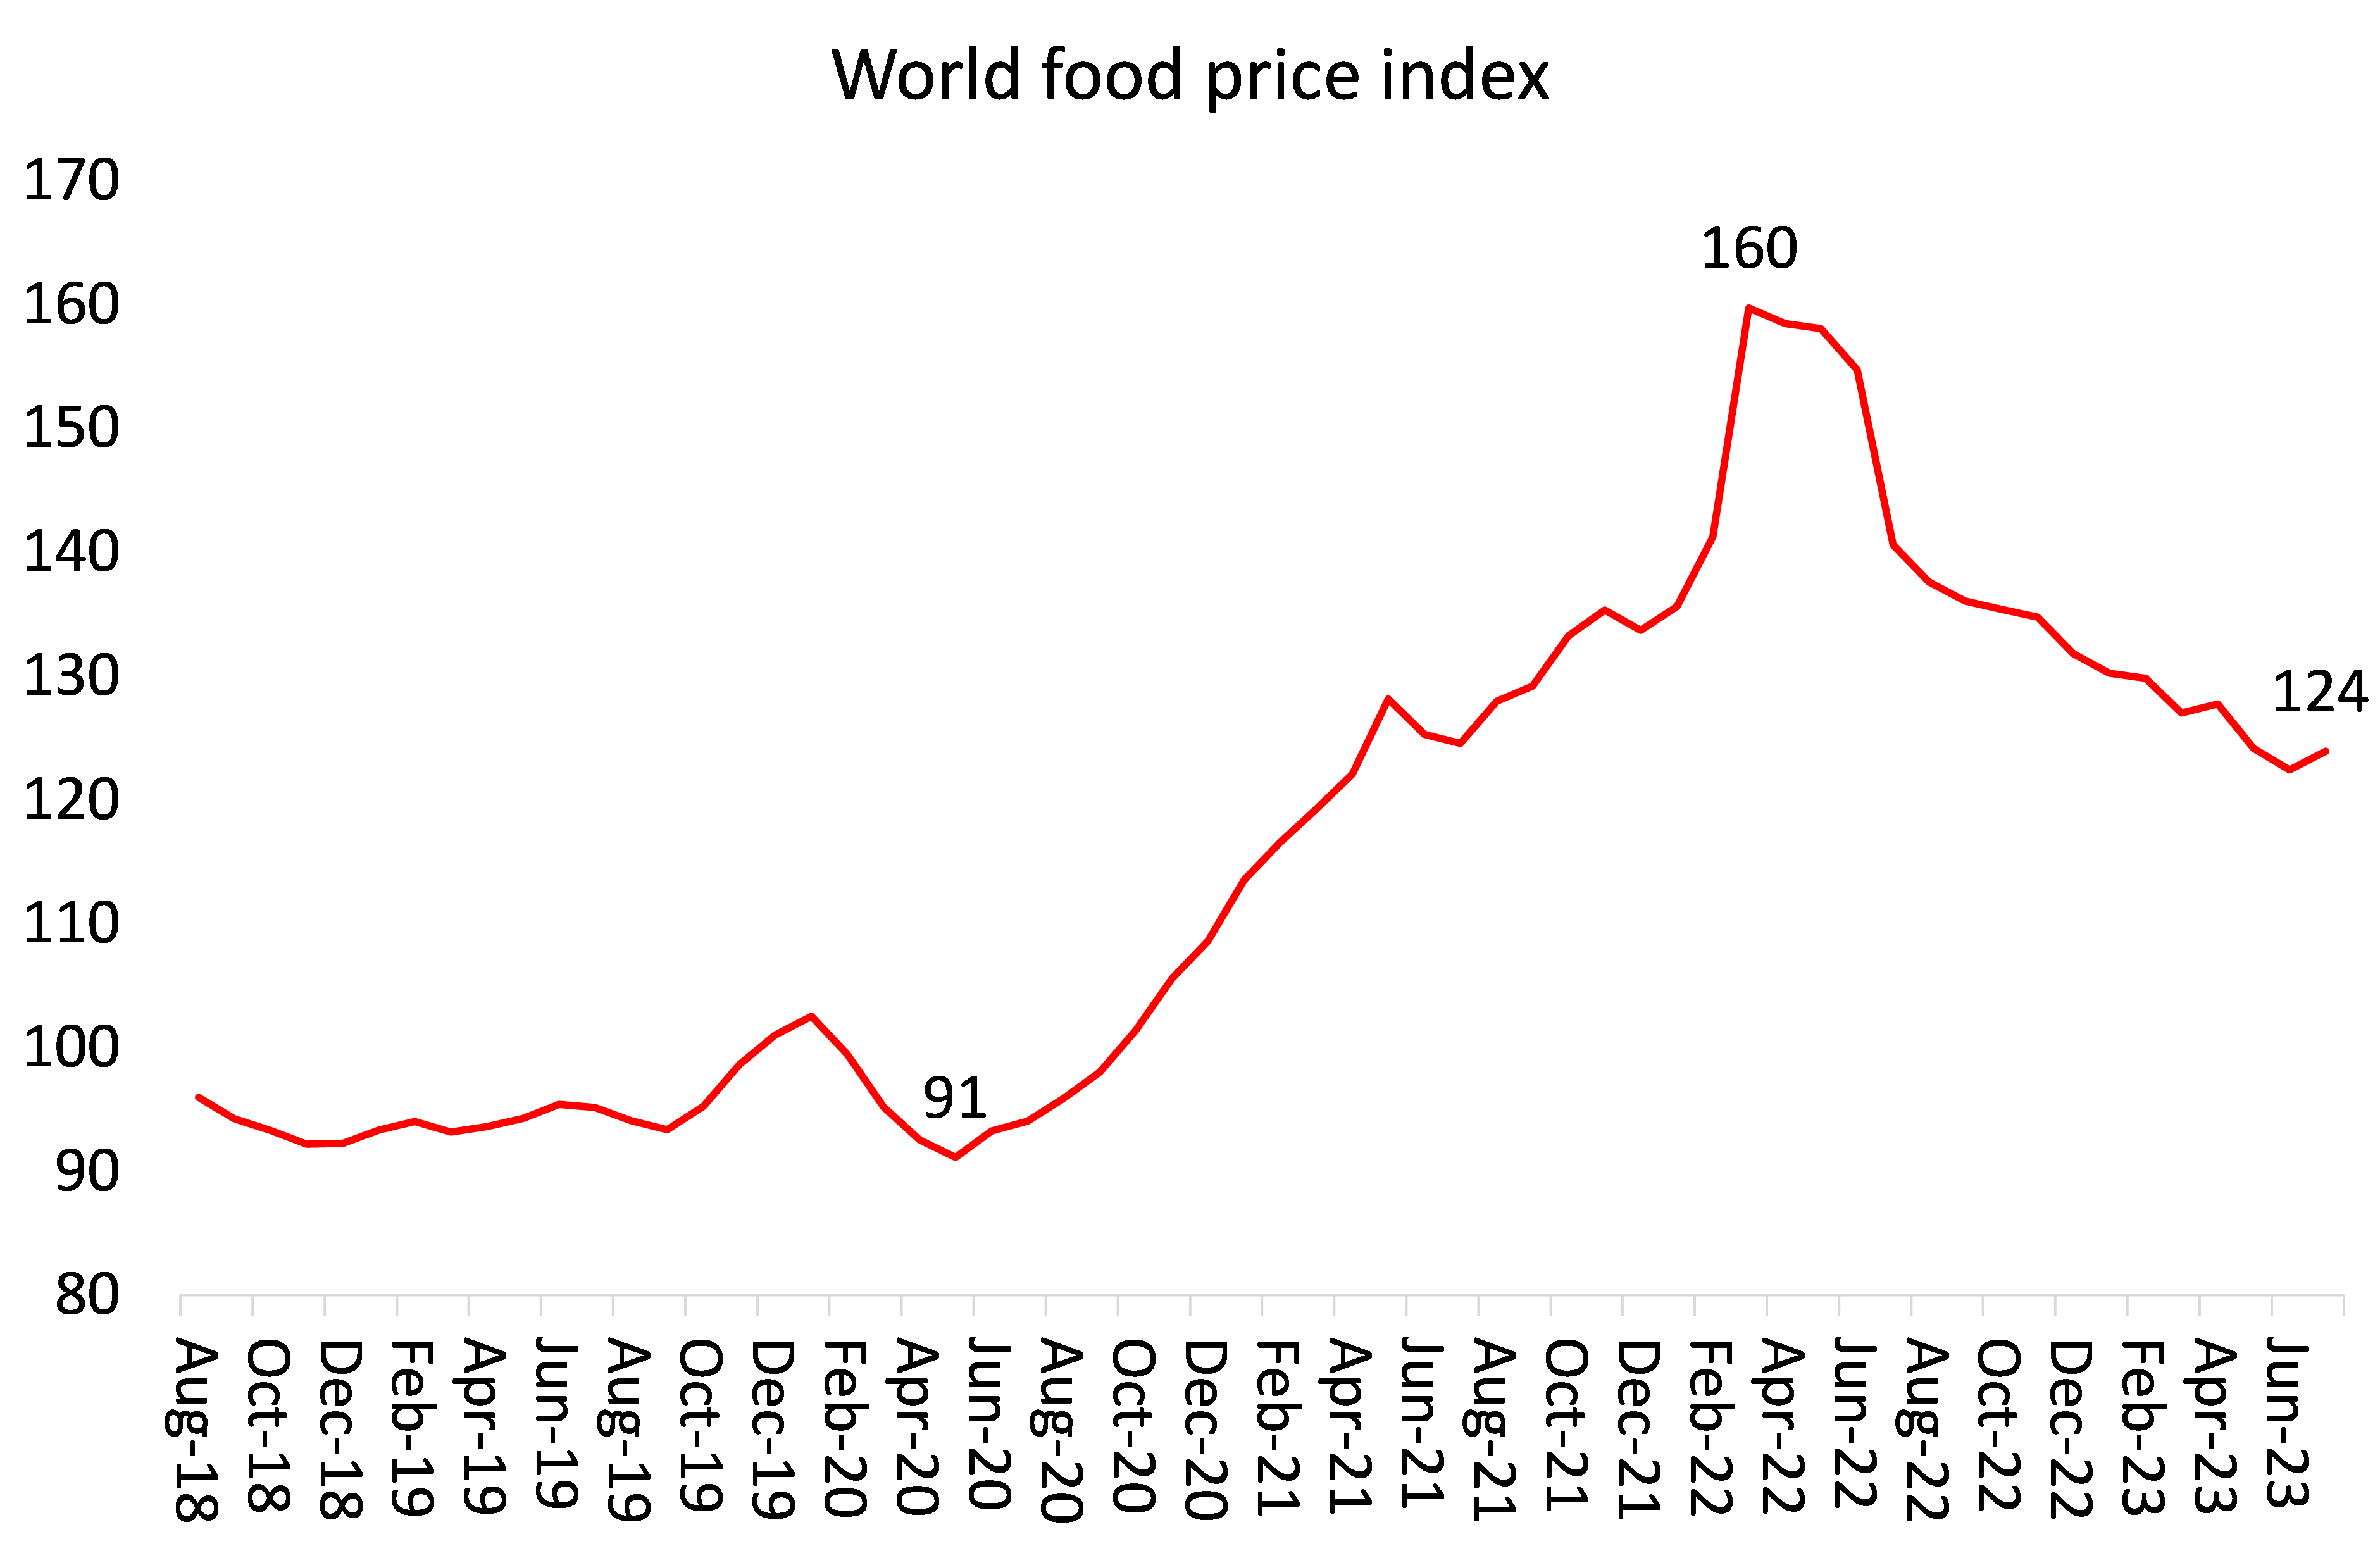
The new rise in food inflation is partly driven by the collapse of the Black Sea grain deal between Russia and Ukraine to export their harvests. Last month, Russia withdrew from the deal and subsequently targeted the country’s food-export infrastructure with drone attacks on Odesa’s port facilities. Originally food price inflation was the product of supply chain blockages even before the Russia-Ukraine war began; now it seems that those blockages could well return.
And then there is a further development: unusual weather patterns hitting harvests of a variety of grains, fruits and vegetables around the world. July 2023 was the hottest month of all Julys on record. Climate scientists are saying that global warming to dangerous levels is coming upon the planet much faster than previously expected. “Adverse weather conditions, in light of the unfolding climate crisis, may push up food prices,” said European Central Bank President Christine Lagarde.
The impact of unfavorable weather has been most notable in India, where heavy rain has reduced the rice harvest and pushed food prices sharply higher. The Indian government last month imposed a ban on exports of certain types of rice, an echo of similar restrictions on the overseas sale of food staples that were announced by a number of governments as prices surged last year.
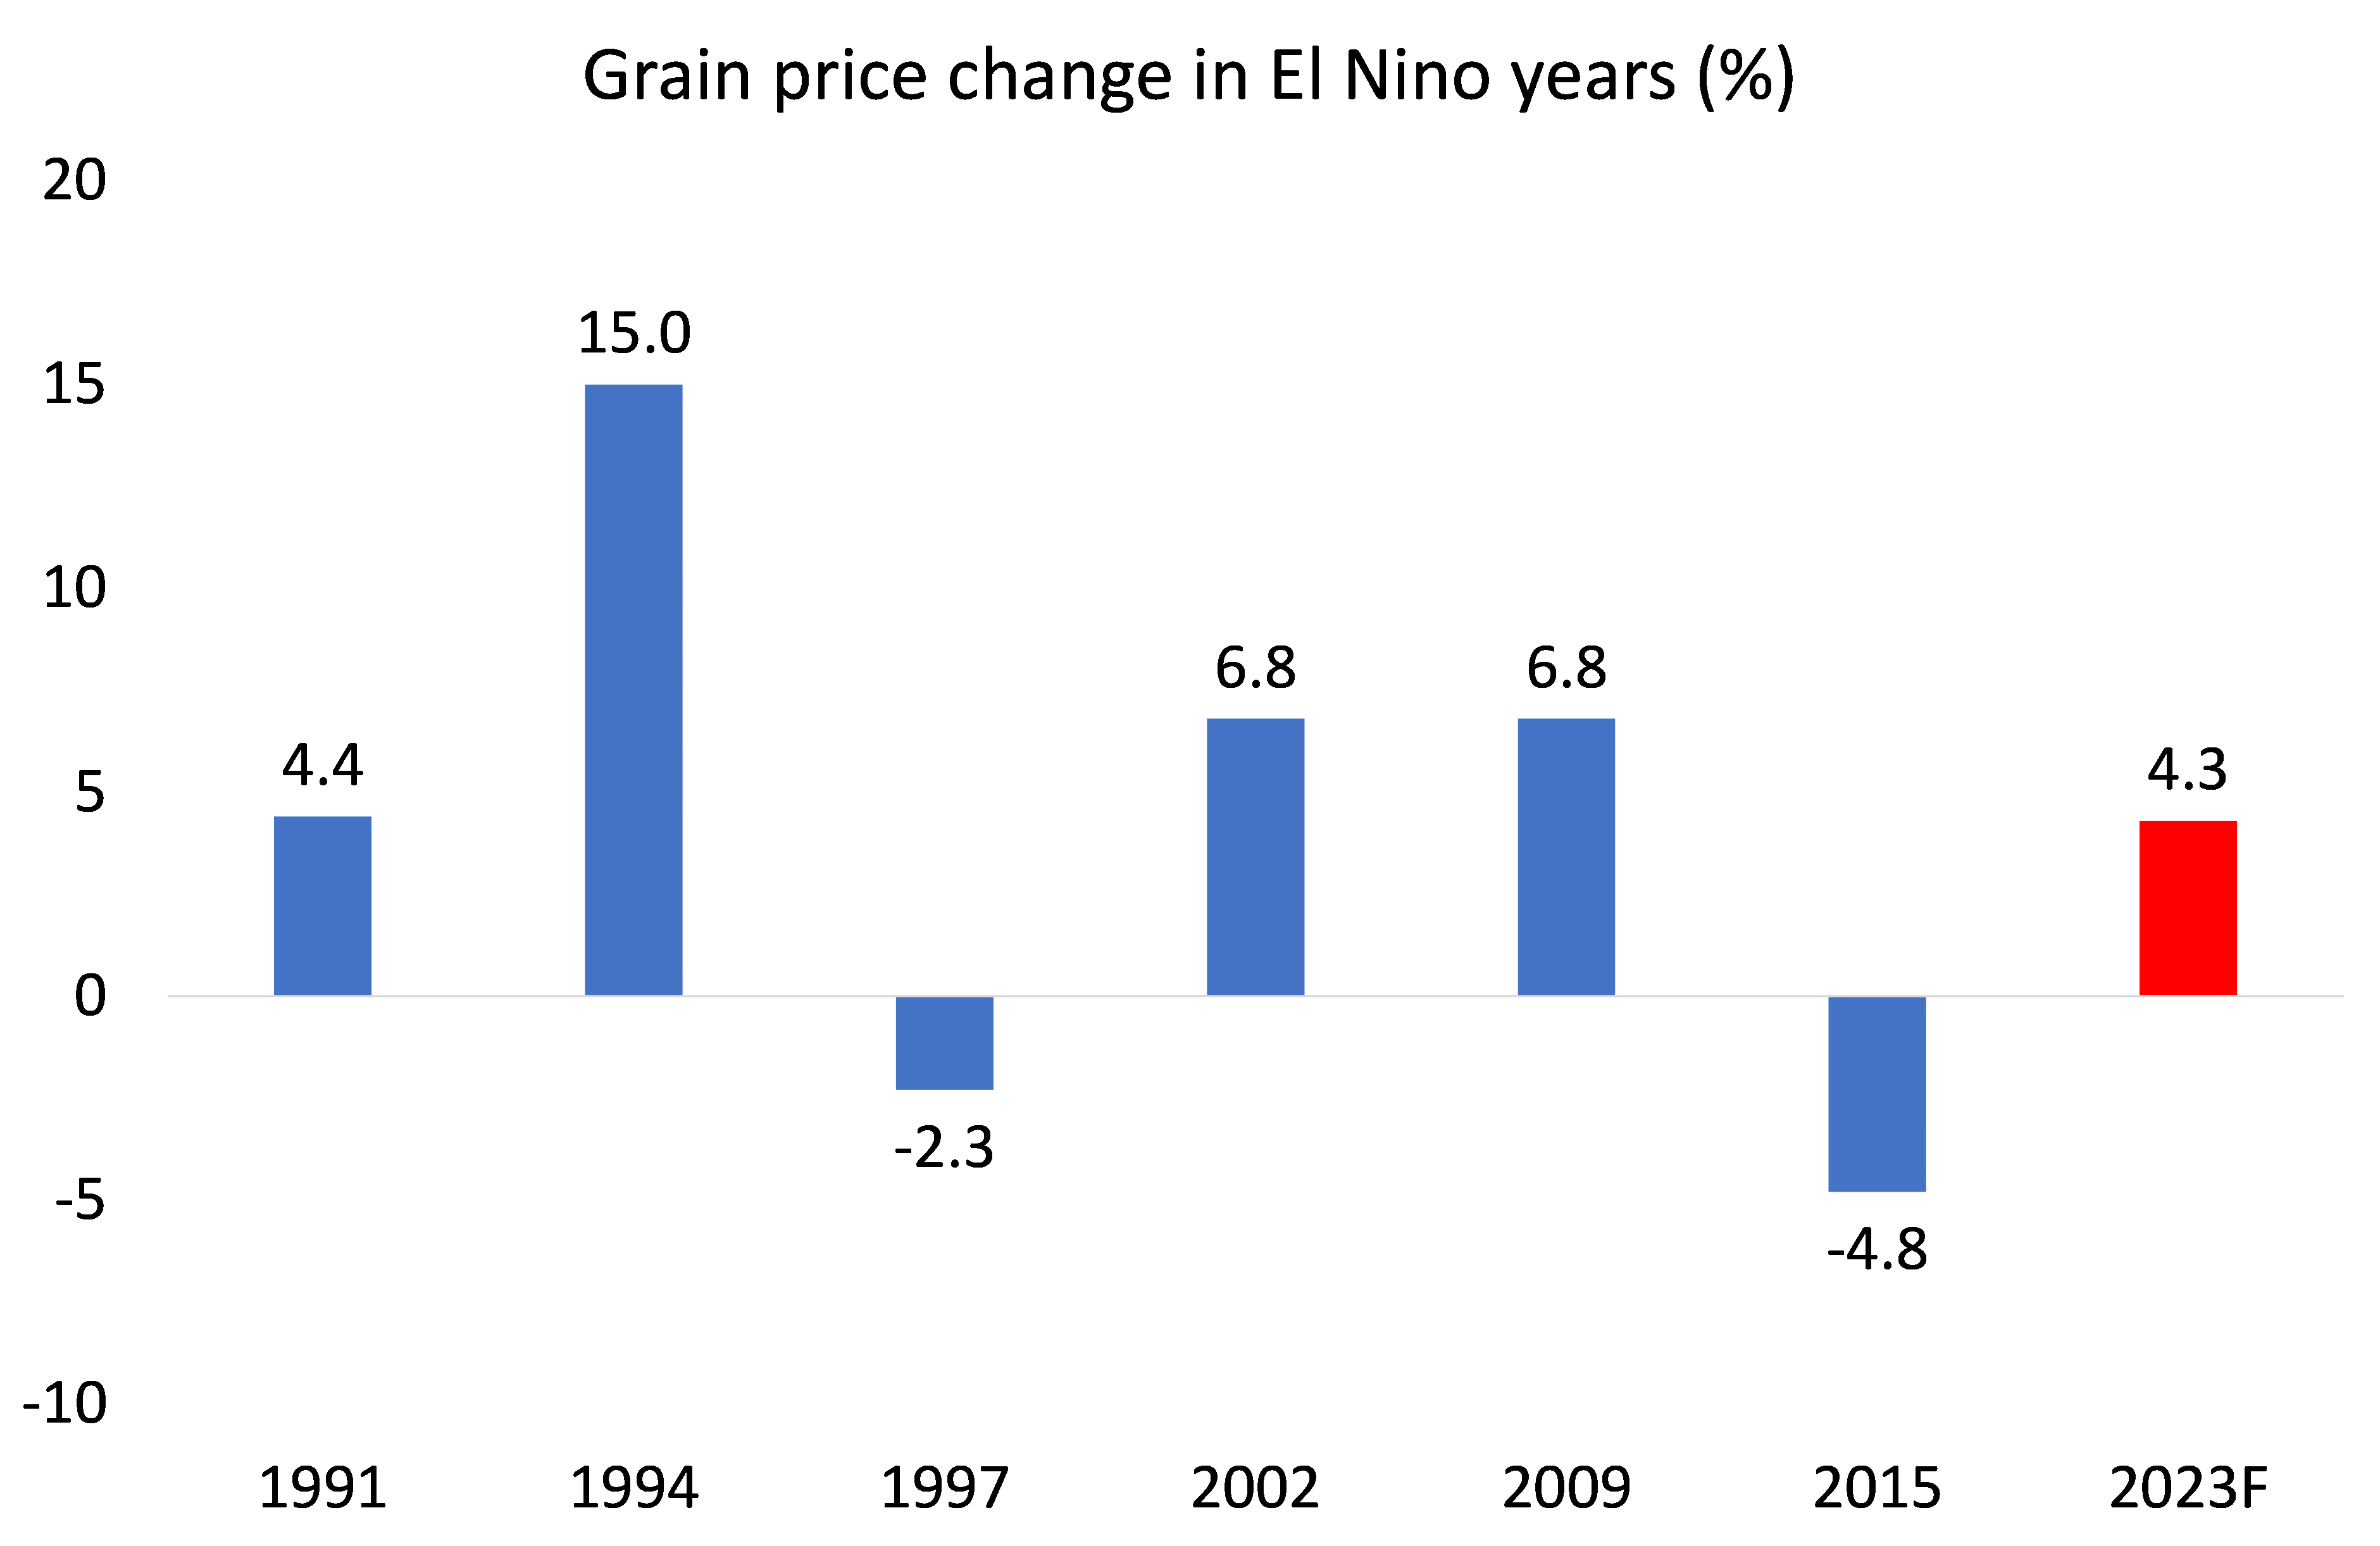
One additional risk to food supply is the strong natural warming condition in the Pacific Ocean known as El Niño, which can lead to changes in weather patterns and reduced harvests of some crops. The Australian government’s Bureau of Meteorology has issued an El Niño alert, saying there is a 70% chance that the climate pattern will emerge later this year. Previous El Niño periods have usually (but not always) led to rising grain prices. The ECB reckons that a one-degree celsius rise in temperature during El Nino historically raises food prices by more than 6% one year later.
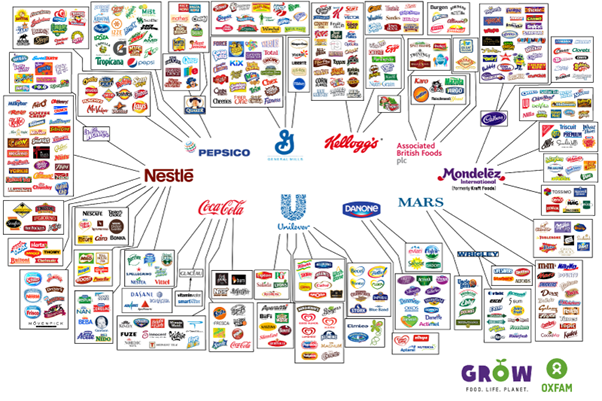
And then there are the food monopolies. Four companies – the Archer-Daniels-Midland Company, Bunge, Cargill and Louis Dreyfus, known collectively as ABCD – control an estimated 70-90% of the global grain trade. They have been taking advantage of the food supply crisis by hiking their profit margins. Further up the food chain, just four corporations — Bayer, Corteva, ChemChina and Limagrain — control more than 50% of the world’s seeds. From seeds and fertilizer to beer and soda, just a small number of firms maintain a powerful hold on the food industry, determining what is grown, how and where it’s cultivated and what it sells for. Only 10 companies control almost every large food and beverage brand in the world. These companies — Nestlé, PepsiCo, Coca-Cola, Unilever, Danone, General Mills, Kellogg’s, Mars, Associated British Foods, and Mondelez — each employ thousands and make billions of dollars in revenue every year.
Energy demand is relatively ‘elastic’ because there are rising alternatives fossil fuel production and energy demand varies with global growth, industrial production and trade. So when the world economy slows and manufacturing goes into recession, as it has now, then demand for energy can fall back. That’s not the case for food. Billions in the poorest parts of the world need ‘food security’ as the cost of food takes up most of their incomes. And a fall in food supply will drive up prices much more than energy.
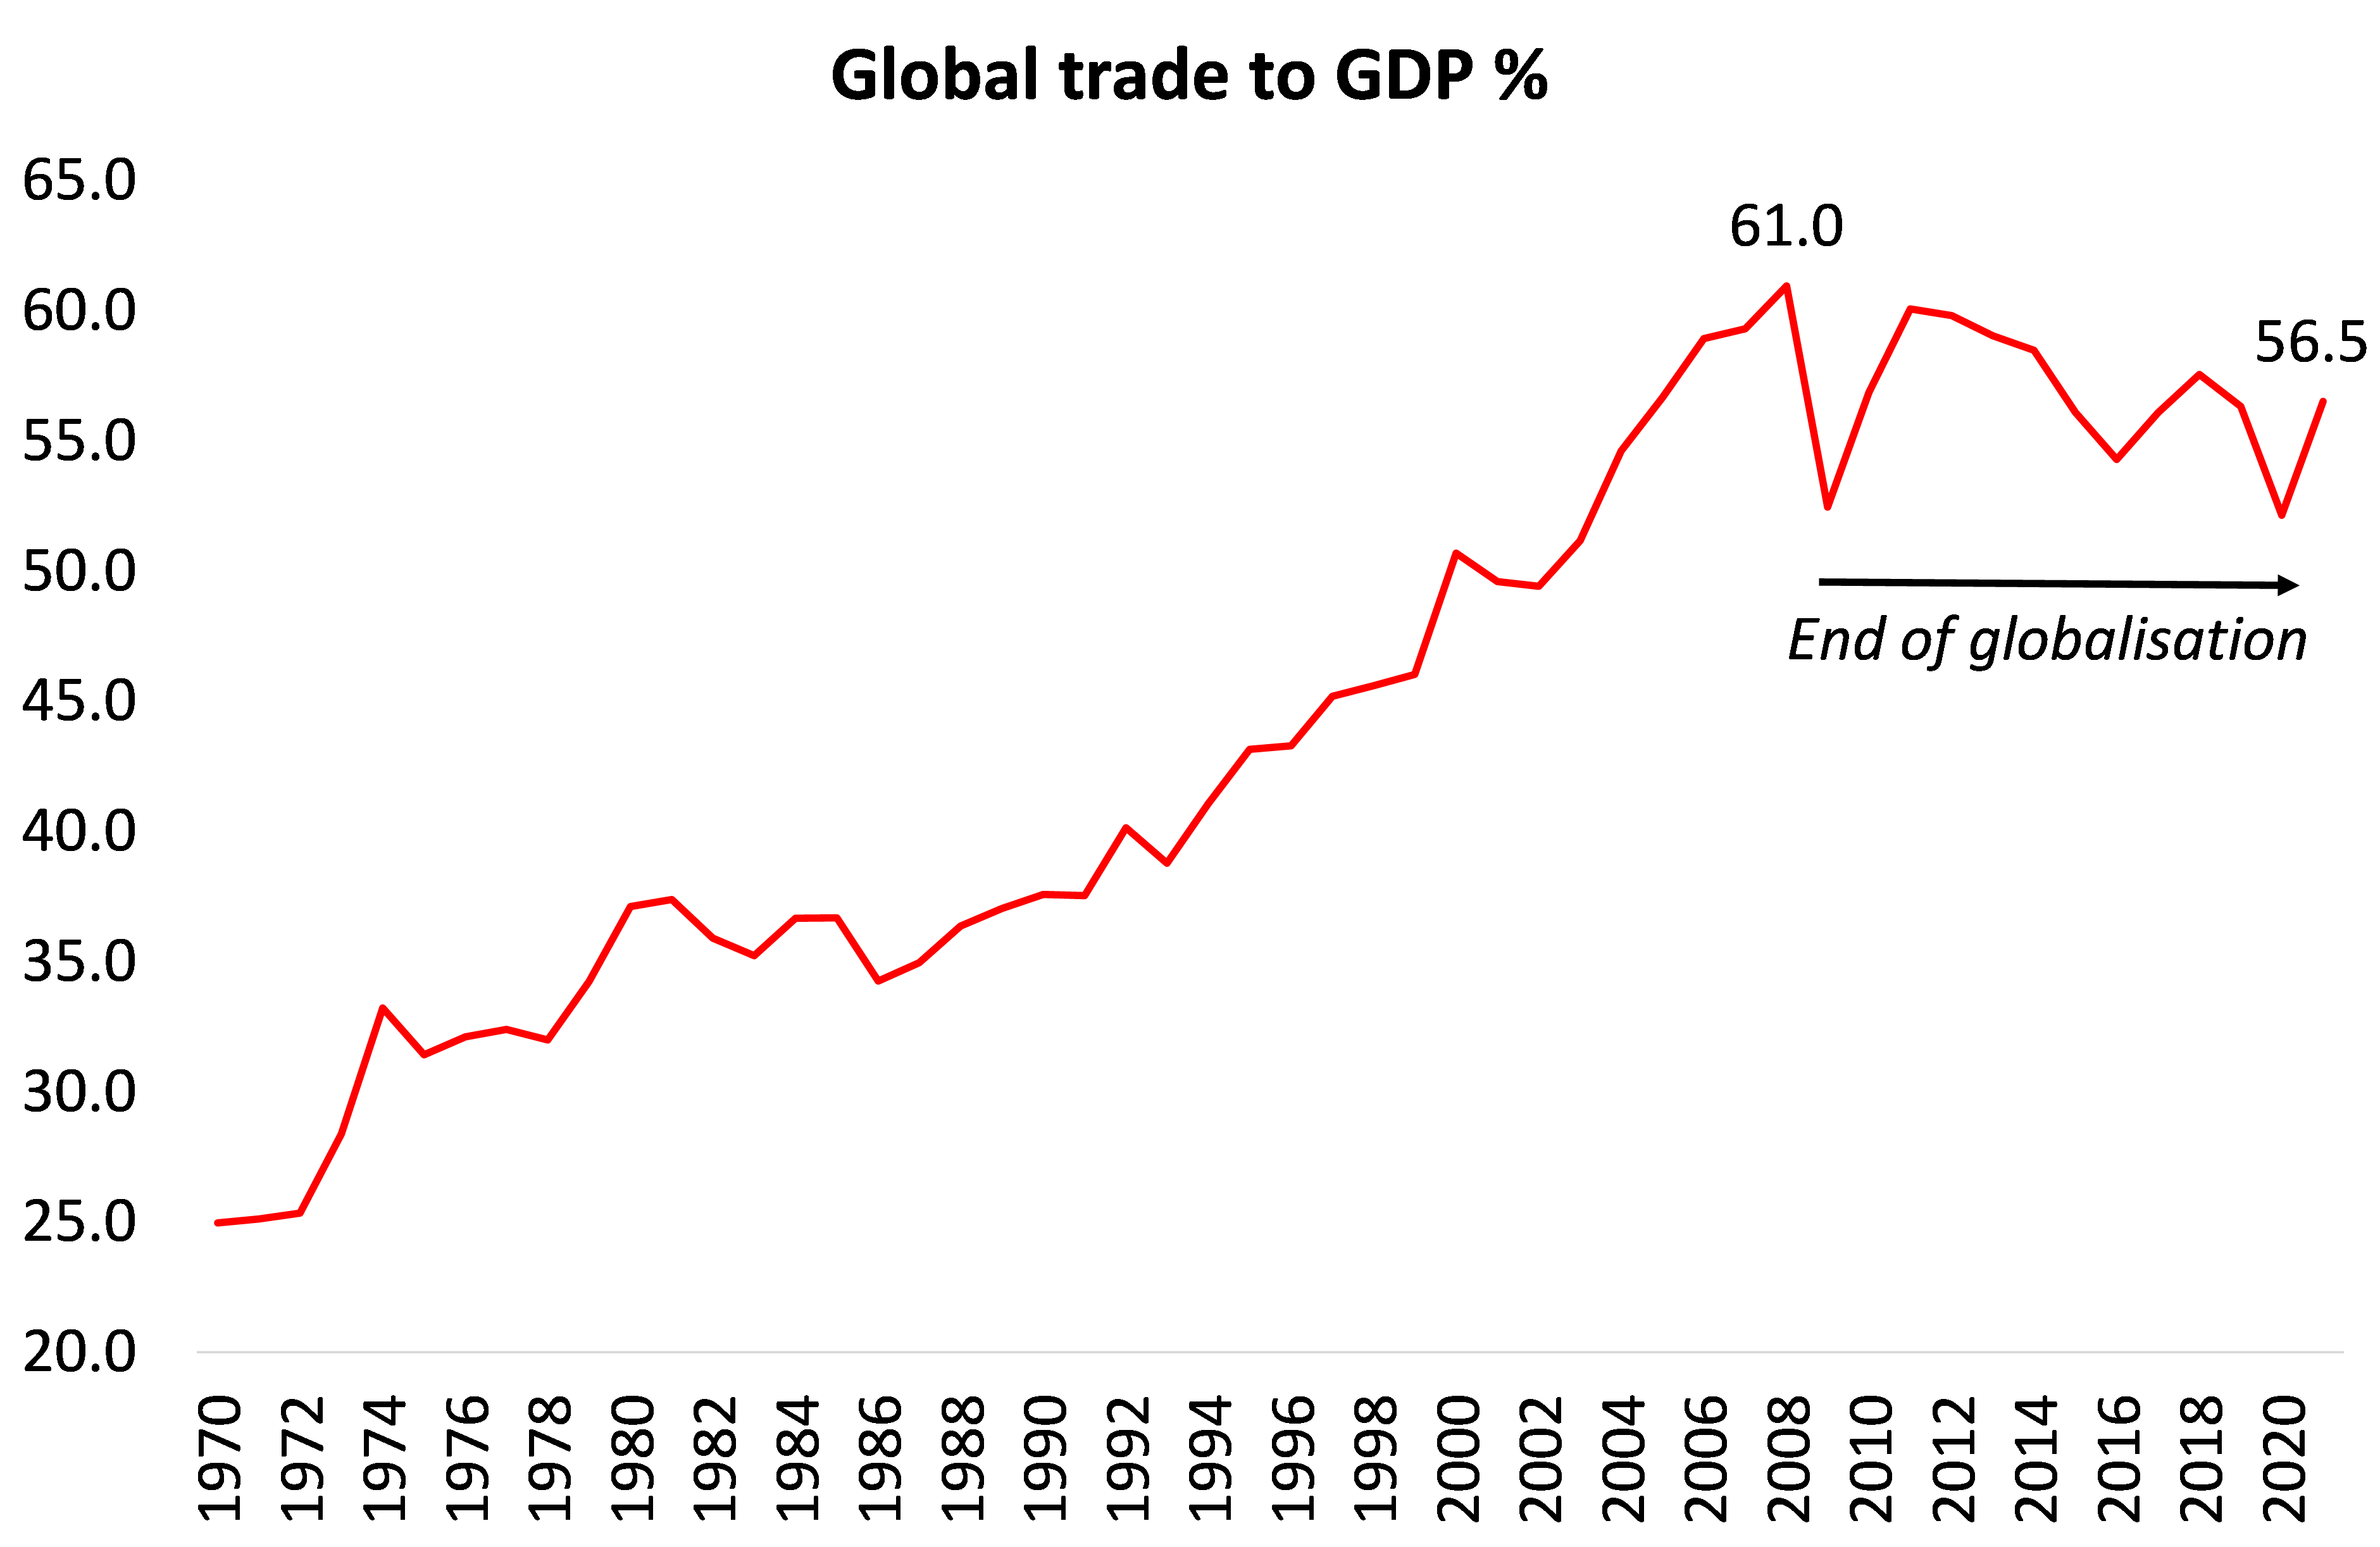
Indeed, it is food prices that will remain ‘sticky’ and food inflation could well accelerate from here. Supply and international trade are in the doldrums. The IMF expects growth in global trade to slow to 2% this year from 5.2% last year. The World Bank and the World Trade Organization both forecast trade will grow by just 1.7% this year. Even a partial recovery in 2024 is predicted to fall well short of trade’s average yearly growth of 4.9% during the two decades before the pandemic. “Overall, the outlook for global trade in the second half of 2023 is pessimistic,” the UNCTAD wrote in a June report. The organization now forecasts the global goods trade to shrink by 0.4% in the second quarter when compared with the previous quarter.
This is a confirmation of the end of globalisation since the end of the Great Recession of 2008-9 and the long depression of the 2010s. Trade growth no longer provides an escape when domestic growth is weak. Indeed, the world is entering a period of deglobalization led by the US as imposes yet more measures on Chinese trade and investment with its ‘chip war’. The Biden administration has also kept in place most of the tariffs on goods from China and other countries implemented by the Trump administration.
This provides part of the explanation for the significant drop in Chinese exports to the rest of the world, according to the latest data. Overseas shipments from China slumped 14.5% in July from a year earlier, the steepest year-over-year decline since February 2020. Again, the Western experts see this as a sign of imminent collapse or stagnation of the Chinese economy. But it is more a sign of the weakening of economic growth, investment and real wages in the G7 economies.
Indeed China continues to dominate global trade as it pushes deeper into markets other than the US. China’s overall share of global goods exports was 14.4% in 2022, up from 13% the year before the pandemic and 11% in 2012, according to World Trade Organization data.
A growing share of China’s exports are heading to regions including the Middle East and Latin America, reflecting strengthening economic links thanks to Chinese investment and its hunger for natural resources. China is also finding success exporting cheap electric cars and smartphones to emerging markets, edging out much more expensive Western alternatives. The country surpassed Japan as the world’s biggest exporter of vehicles in the first quarter of 2023.
The shift in export destinations also reflects worsening relations between China and the US-led West that are crimping trade. Tariffs on a range of goods mean China accounted for around 15% of U.S. imports in the 12 months through May, down from more than 20% before Donald Trump hit a range of Chinese goods with tariffs in 2018.
Rising food inflation, falling trade growth and a global manufacturing recession hardly make a recipe for an optimistic ‘soft landing’ for the G7 economies over the next year.
August 2, 2023
China: consumption or investment?
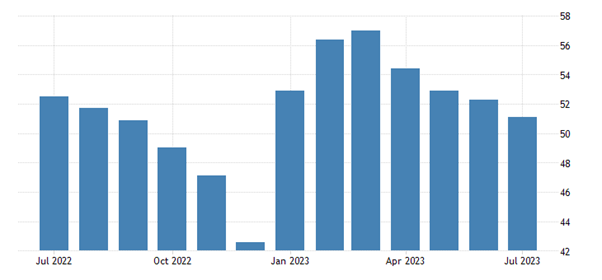
In Q2 2023 the Chinese economy expanded by 6.3% year-on-year, up from 4.5% yoy recorded in Q1. Sounds strong, but quarterly growth was only 0.8%, slowing sharply from 2.2% qoq in the first quarter of 2023.

And a reliable measure of economic activity, the purchasing managers survey index for July, was down to 51.1 in July 2023 from 52.3 in the previous month (50 is the threshold between expansion and contraction). This was the lowest figure since December 2022. Factory activity contracted for the fourth month in a row.
The West’s China ‘experts’ have been quick to argue that the Chinese economy is in deep trouble, with slowing growth, falling exports, weak consumption growth and rising debt. The great economic miracle is over.
But how many times have we heard this refrain from the experts over the last 20 years? I could cite article after article, book after book, predicting the collapse of China’s state-led economy, ranging from the claim that is locked into a ‘middle-income trap’ (ie cannot grow fast again); that an ageing population and falling workforce, alongside rising public and private sector debt, is leading to ‘Japanification’ ie a stagnant economy; and finally to forecasts of an imminent collapse in the property and finance sectors.
I have dealt with these arguments in detail in many previous posts. The last one was only in March. Please read that for chapter and verse and the previous posts cited. The data are all there, refuting this ‘expert’ analysis. But of course, it won’t go away because it is in the interests of ‘the West’ to claim that Chinese economic model cannot work and it needs urgently to make a transition, not to socialism, but to outright free market capitalism.
Let us consider the latest round of claims being put by mainstream economists (and parroted by some inside China, ie those who were nicely educated in neoclassical, free market economics in American universities). For example, here is the latest view of the Financial Times. “Government policy is largely to blame for the slowdown. Decades of relying on an investment-driven growth model has slowed China’s transition to a consumer-based economy. Poor oversight of the housing market led to an unsustainable lending boom, while political impediments have hamstrung private enterprises. Heavy-handed Covid restrictions have also left deep scars.”
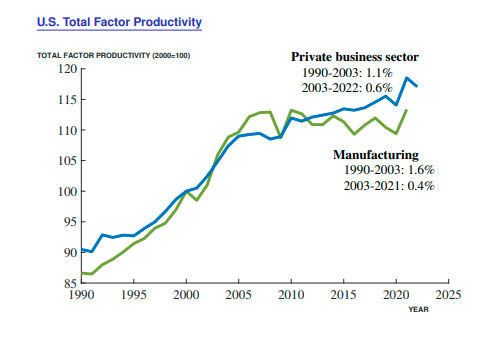
So first, let’s blame the Chinese government for the slowing economy – presumably for interfering in business and the capitalist sector. But then claim that “decades of relying an investment-driven growth model” is at fault because what is needed is a “transition to a consumer-based economy”. Really? Have the consumer-based economies of the G7 done better than the awful investment-led Chinese economy in the last two or three decades? Take a look at this graph below.

But the FT and other experts might retort, since COVID things have changed in China; now the economy cannot recover. Really? Look at this graph on the growth rate of China and the US since the COVID pandemic started. Indeed, during the COVID pandemic slump year of 2020, every major advanced capitalist economy suffered a recession, but, as in the Great Recession of 2008-9, China did not. And yet China applied the most stringent and draconian series of lockdowns during the pandemic.

And while the US economists are in rapture over 0.6% growth in the US economy in Q2 this year, apparently 0.8% growth for the same quarter in China is to be considered a disaster.
The FT says that “heavy-handed Covid restrictions have also left deep scars.” Well, those ‘heavy-handed’ measures also saved millions of lives in China, when its health system was at breaking point and inadequate to the task. During 2020-21, when the COVID death rate rocketed in the West, China’s stayed at miniscule levels. Eventually, as lockdown exhaustion emerged and protests rose, the government relented and ‘opened up’ the economy, the death rate rose – but only to 85 per million compared to 3300 per million in the US, or to ‘open’ Sweden at 2325 and or even India at 375 (ludicrously underestimated). The ‘deep scars’ were and are still being felt in Europe, the US and Latin America from COVID deaths and long ‘COVID’ on the health of the workforce and economic growth. This year, the IMF forecasts China will grow 5.3%, while the advanced capitalist economies will manage only 1.5%, with the Euro area reaching only 0.9% and Germany and Sweden in outright recession.
The FT goes on that “Poor oversight of the housing market led to an unsustainable lending boom, while political impediments have hamstrung private enterprises.” Much noise has been made about the property crash in China, with several mega-property development companies going bust as the debt borrowing that they built up could no longer be serviced from property sales.
But was this down to poor regulation? We have heard the same cause presented in the property busts in capitalist economies – that it was ‘badly regulated’. But as in those economies, China’s property crisis is not because of bad regulation or ‘unsustainable lending’ but because the housing and property market in China is just that – part of the speculative capitalist market. To quote, Xi himself: ‘housing is for living not speculation’.
And therein lies the rub. Why was a basic human need, housing, handed over to the private sector to meet the needs of millions flooding into the cities over the last few decades? Housing should be done by direct public investment to build houses for all at reasonable rents and so avoid speculation, rocketing house prices and widening inequality. Indeed, the biggest reason for rising inequality in China in the last two decades was not billionaires but the inequality between urban and rural areas and property and non-property owners.
It’s what happened in the West; China should have avoided that too. But in their ‘wisdom’ the Chinese leaders, as advised by their Western-educated bankers and economists, opted for the rentier-capitalist model, which now has come back to bite them.
The government has been forced to act. First, with its “three red lines” policy introduced in 2020, it aimed to limit borrowing by developers and ultimately curtailed their access to financing. Then it started to bail out developers and take over some. But huge debts remain in local government which bore the burden of providing land to these developers and raising funds. Local government debt has spiralled and the oncoming repayment schedule is high.

Local government debt now stands at around 25% of GDP, but if you add in the financing vehicles set up by local governments (LGFVs), then total local government debt is more like 60% of GDP. Worse, faced with tighter credit criteria at home, LGFVs turned to offshore markets and raised a record $39.5 billion in dollar bonds.
I am afraid that the Chinese leaders have not learnt from this. They are now moving to provide easier credit for developers and have dropped Xi’s phrase about ‘homes for living’. The government now talks of helping out the capitalist sector. Senior party and state officials jointly released a 31-point plan earlier to shore up the private economy and improve business sentiment. Various government agencies last week also outlined goals to boost consumer spending on cars and electric appliances, though no direct subsidies for households have been unveiled.
All this is along the lines advocated by the likes of the FT, which reckons that “entrepreneurs and established businesses need stability and regulatory clarity from the government. Further monetary policy loosening by China’s central bank could help. Beijing will also need to restructure its local government debt; one option might be a fire sale of state assets to private companies. The proceeds would help local authorities to avoid a debt crisis.” In other words, the answer is not public ownership of the housing sector and taking over the indebted property companies, but instead a bailout and then a sale of state assets to pay for it ie privatisation not nationalization.
Finally, in its claimed demise of the Chinese economy, the FT returns to the old ‘Western expert’ argument that China must become a consumer-led economy like the G7, if it is to avoid the ‘middle-income’ trap and Japanese style stagnation. But it is the consumer economies of West that are stagnating, not China. Moreover, if ‘stagnation’ means no inflation of prices, then it may have merit. China has the lowest inflation rate of all the major economies in the world, including stagnating Japan which is desperately trying to create inflation!
While households in the West are suffering the biggest fall in living standards since the Great Depression because wages are not keeping up with high inflation, it is the opposite in China.

What is an issue is youth unemployment which is over 20% in China compared to average urban unemployment of around 5%.

The problem isn’t that jobs don’t exist in China. They do. But the economy isn’t producing enough of the high-skill, high-wage jobs that many college students have come to expect. China is producing more and more university graduates.
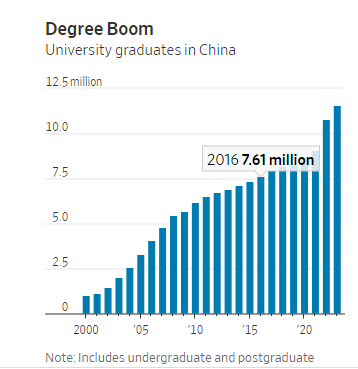
But they all expect to get jobs in finance and technology, but not in manufacturing, construction and engineering. It’s a problem that has affected not just China, but also the West. Better-off families want their kids to be working for glamorous tech firms and banks (where they have to work ridiculous hours) rather than in any ‘mundane’ work that often can pay just as much. The government has offered incentives to companies take on students but it does not plan government projects that could provide training in tech and innovation that could meet important social targets.
Then there is external trade. One reason that China’s growth rate has been relatively low in the last year is the collapse of international trade which has turned negative. As a result, China’s exports to the world have dropped.

Yes, that probably means China should concentrate on domestic investment and output, not exports. But that does not mean becoming a ‘consumer-led’ economy. As I have argued before, consumption flows from investment not vice versa – as China’s economy up to now has proved.
The FT and the other experts argue that China is heading for low growth through this decade – see the IMFs latest forecasts.

But as I have argued in previous posts, that does not follow if China uses the potential it still has to invest and grow. Some ‘experts’ are now claiming that India will usurp China over the next decade. But as ex-World Bank and IMF economist Ashoka Mody puts it:
“Since the mid-1980s, Indian and international observers have predicted that the authoritarian Chinese hare would eventually falter and the democratic Indian tortoise would win the race.”
But the World Bank’s 2020 Human Capital Index – which measures countries’ education and health outcomes on a scale of 0 to 1 – gave India a score of 0.49, below Nepal and Kenya, both poorer countries. China scored 0.65, similar to the much richer (in per capita terms) Chile and Slovakia. While China’s female labour-force participation rate has decreased to roughly 62% from around80% in 1990, India’s has fallen over the same period from 32% to around 25%. Especially in urban areas, violence against women has deterred Indian women from entering the workforce.
Assuming that the two economies were equally productive in 1953 (roughly when they embarked on their modernization efforts), China became over 50% more productive by the late 1980s and today, China’s productivity is nearly double that of India. While 45% of Indian workers are still in the highly unproductive agriculture sector, China has graduated even from simple, labour-intensive manufacturing to emerge, for example, as a dominant force in global car markets, especially in electric vehicles.

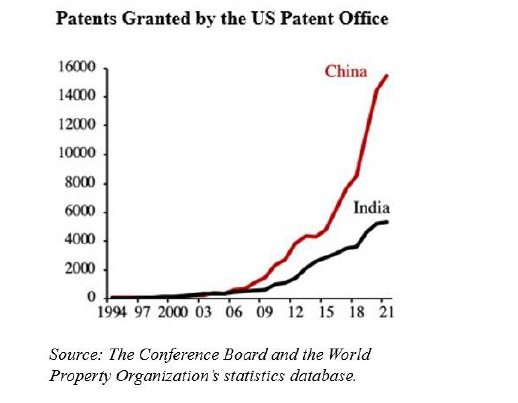
China is also better prepared for future opportunities. Seven Chinese universities are ranked among the world’s top 100, with Tsinghua and Peking among the top 20. Tsinghua is considered the world’s leading university for computer science, while Peking is ranked ninth. Likewise, nine Chinese universities are among the top 50 globally in mathematics. By contrast, no Indian university, including the celebrated Indian Institutes of Technology, is ranked among the world’s top 100.
China still has vast opportunities for infrastructure in its interior provinces. The challenge is turn domestic savings into domestic investment, so capital is allocated to its most productive uses. For me, that means the state must direct the allocation and not leave investment to the capitalist sector to deliver.
Indeed, the capitalist sector in China is failing. The private-sector’s share of China’s 100 largest listed companies by market value dropped from a peak of 55% in mid 2021 to 39% this June, close to its lowest levels in more than three years, according to a forthcoming research report by the Washington, D.C.-based think tank Peterson Institute for International Economics, or PIIE.
Private sector investment shrank by 0.2% in the first half of 2023 from a year earlier, the first contraction since official data collection began in 2005, with the exception of 2020, when the economy was racked by the pandemic. In contrast, investment by state-controlled firms expanded 8.1% in the same period.
The FT makes a point: “China’s central government is one of the least indebted in the world… If China is to sustain its long run of economic success, it is down to Beijing to act.” But the FT’s idea of action is for government to make cash handouts to households and ‘free up’ the private sector. But it’s not a turn to a consumer-led market economy that China needs to get the economy going again, but planned public investment into housing, technology and manufacturing.
July 27, 2023
It’s not Goldilocks
Both the Federal Reserve and the European Central Bank raised their policy interest rate again this week. The Fed rate now stands at its highest in 22 years. The ECB rate has never been as high. The ostensible reason for this is that hiking interest rates until the pips squeak in the economic orange will eventually get the inflation rate of consumer prices down to the (arbitrary) central bank targets of 2% a year.
This policy is based on the theory that accelerating inflation was being caused by ‘excessive demand’ by consumers (workers). So raising interest rates, by increasing the cost of borrowing (mortgages, consumer credit and loans to firms), will slow down spending and investment sufficiently to bring ‘demand’ back into line with ‘supply’.
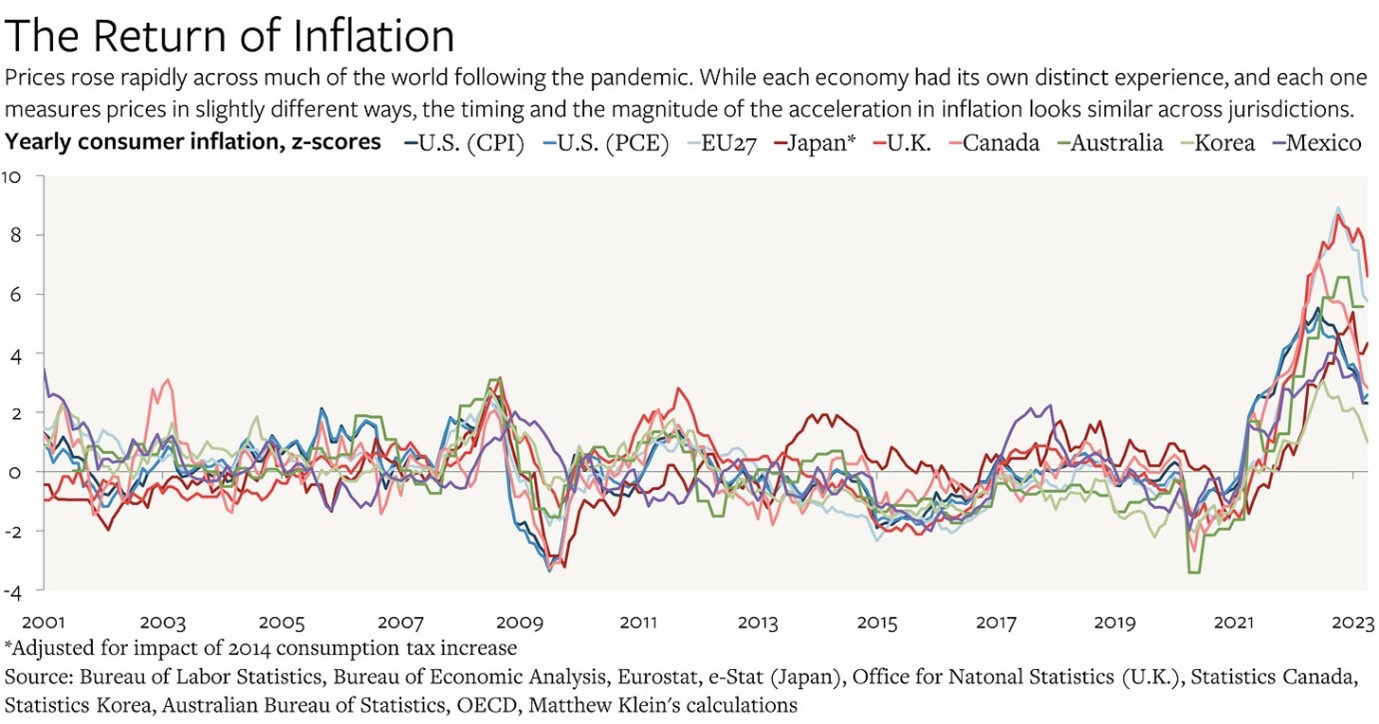
As I and many others have argued, this theory is full of holes. It assumes that the cause of inflation is excessive demand and not insufficient supply. The latter side of the price equation is ignored. And yet the evidence on the causes of the inflationary spike since the end of the pandemic slump clearly shows that it was a supply ‘shock’ (the word used by the mainstream to describe anything disturbing the supposed harmony of supply and demand in a market economy).
After the pandemic, global production was slow to recover as healthy labour was in short supply and international trade and transport was clogged with obstacles. As a result, in particular, basic commodities (food and energy) rose sharply in price, driving up import prices for most countries.
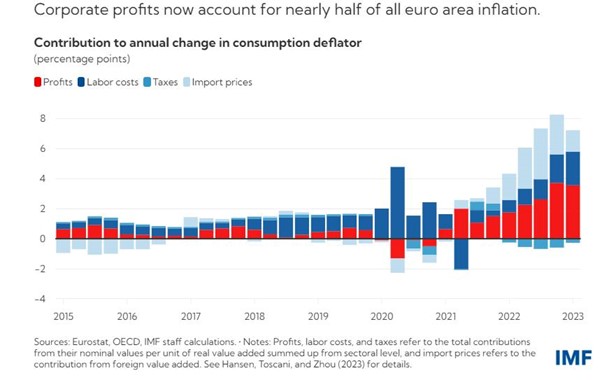
In addition, multi-national food and energy producers took advantage of the supply blockages to raise prices and increase profits (and to some extent, lever up their ‘mark-ups’ on costs). In addition, the Russian invasion of Ukraine added another accelerator to price rises. We now know that it was profits that made the largest contribution to price rises in the last two years, not wages. There was no ‘wage-price ‘ spiral as the central bankers claimed as one reason why interest rates had to rise; on the contrary, it was profit-price spiral.
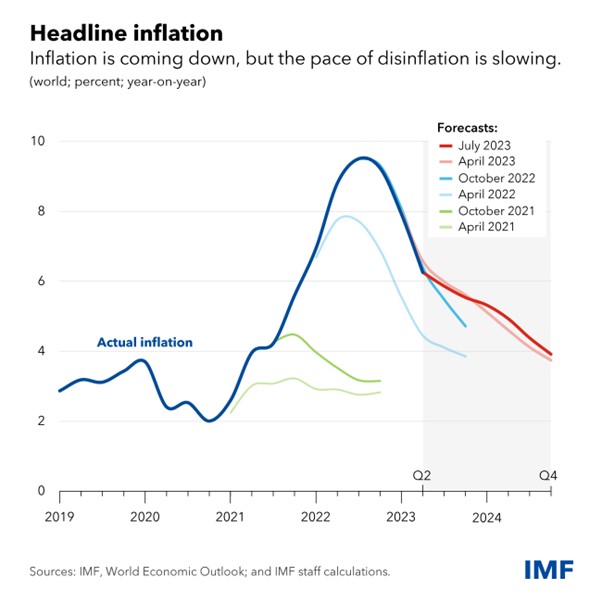
But here is the rub. Despite the huge rise in interest rates, and with more to come, consumer price inflation is still not back to anywhere near 2% a year. At his press conference this week, Fed chair Powell said that the Fed’s 2% target would not be reached before 2025! It is more likely that the US economy will have been driven into a slump before then.
Yes, so-called headline inflation has been falling fast as food and energy supply improved and prices for these essentials dropped back. The US inflation rate has fallen back to 3% a year and Spain’s even below 2%. The IMF reckons that global inflation will drop 6% a year now to 4% a year, but not until the end of 2024. But the pace of reduction is likely to slow because so-called ‘core’ inflation rates, which exclude food and energy, and in effect measure ‘underlying’ or ‘domestic’ inflation of prices in an economy, have remained ‘sticky’, i.e well above the 2%.
In short, central banks continue to hike interest rates despite the failure of this policy to have any significant effect on the prices of goods and services, despite claims to the contrary. I am reminded by the claim by central banks back in the 2010s that they needed to keep interest rates near zero or even below in order to boost ‘demand’ and avoid inflation going under 2% or even into deflation. This is the current policy of the Bank of Japan. Despite huge dollops of money injection (quantitative easing) and zero interest rates, price inflation refused to reach the 2% targets in the major economies (and shas not succeeded in Japan now). Instead, there was credit-fuelled boom in stock and bond prices. Now the situation is in reverse.
Despite the abject failure of monetary policy to affect inflation rates, mainstream economics continues to claim that it does and there is no alternative to raising interest rates. Take Noah Smith, a prolific mainstream economics blogger. Smith claims that the 2% inflation target will soon be met in the US. He bases this on measuring inflation rates in the most inflationary sectors. But right now, ‘core’ inflation remains close to 5% a year.
Smith claims that mainstream economic policy has worked. He dismisses modern monetary theory as failing to explain inflation; or the hyperinflation theory of cryptocurrency enthusiasts. He reluctantly admits that “supply chain collapses, increased deficits, and the oil price spike all probably did contribute to the inflation of 2021-22.”
But he rejects the ‘greedflation’ theory of inflation that claims it is all due to greedy monopoly companies using market power to hike prices. As Smith says : “When greedflation proponents say that profits “caused” inflation, they typically just show that both profits and prices rose in 2021-22. But that’s correlation, not causation; it could easily just be that supply and demand shocks drove prices higher, and that companies merely reaped a passive windfall from that, without any change in their behavior or market power. When we look at changes in markups (which are closely related to profit margins), we see that these weren’t correlated with price changes at the industry level.” Indeed, on all these theories, Smith has a point.
So which theory got it right? Smith claims “the answer is a bit surprising: It was good old mainstream macroeconomics.” By hiking interest rates and cutting budget deficits, ‘excessive demand’ has been curbed and, low and behold, inflation is falling while unemployment has stayed low and recession has been avoided. Smith says triumphantly, “it looks like the Fed and Congress, with an assist from falling oil prices, have pulled off the most elusive and sought-after Holy Grail of macroeconomic stabilization — the costless disinflation. And even if the economy does cool off a little bit in the months to come, it would still be in the Goldilocks region of a soft landing. You can’t really ask policymakers — or macroeconomic theorists — to do any better than that!”
But the fact that inflation is falling and unemployment has not risen in the major economies is really an indicator of the faultlines in mainstream economic theory. If money supply growth is reduced or ‘excessive demand’ is forced down by rising interest rates, then unemployment should rise, according to mainstream theory. But instead, the Phillips curve (the mainstream theory of a trade-off between inflation and unemployment) has remained flat and the so-called Beveridge curve (where job vacancies fall and unemployment rises) has taken on an ‘elbow-shape’ – namely vacancy rates have risen, but unemployment has been unmoved.
The Beveridge ‘curve’ is not a curve but an elbow.
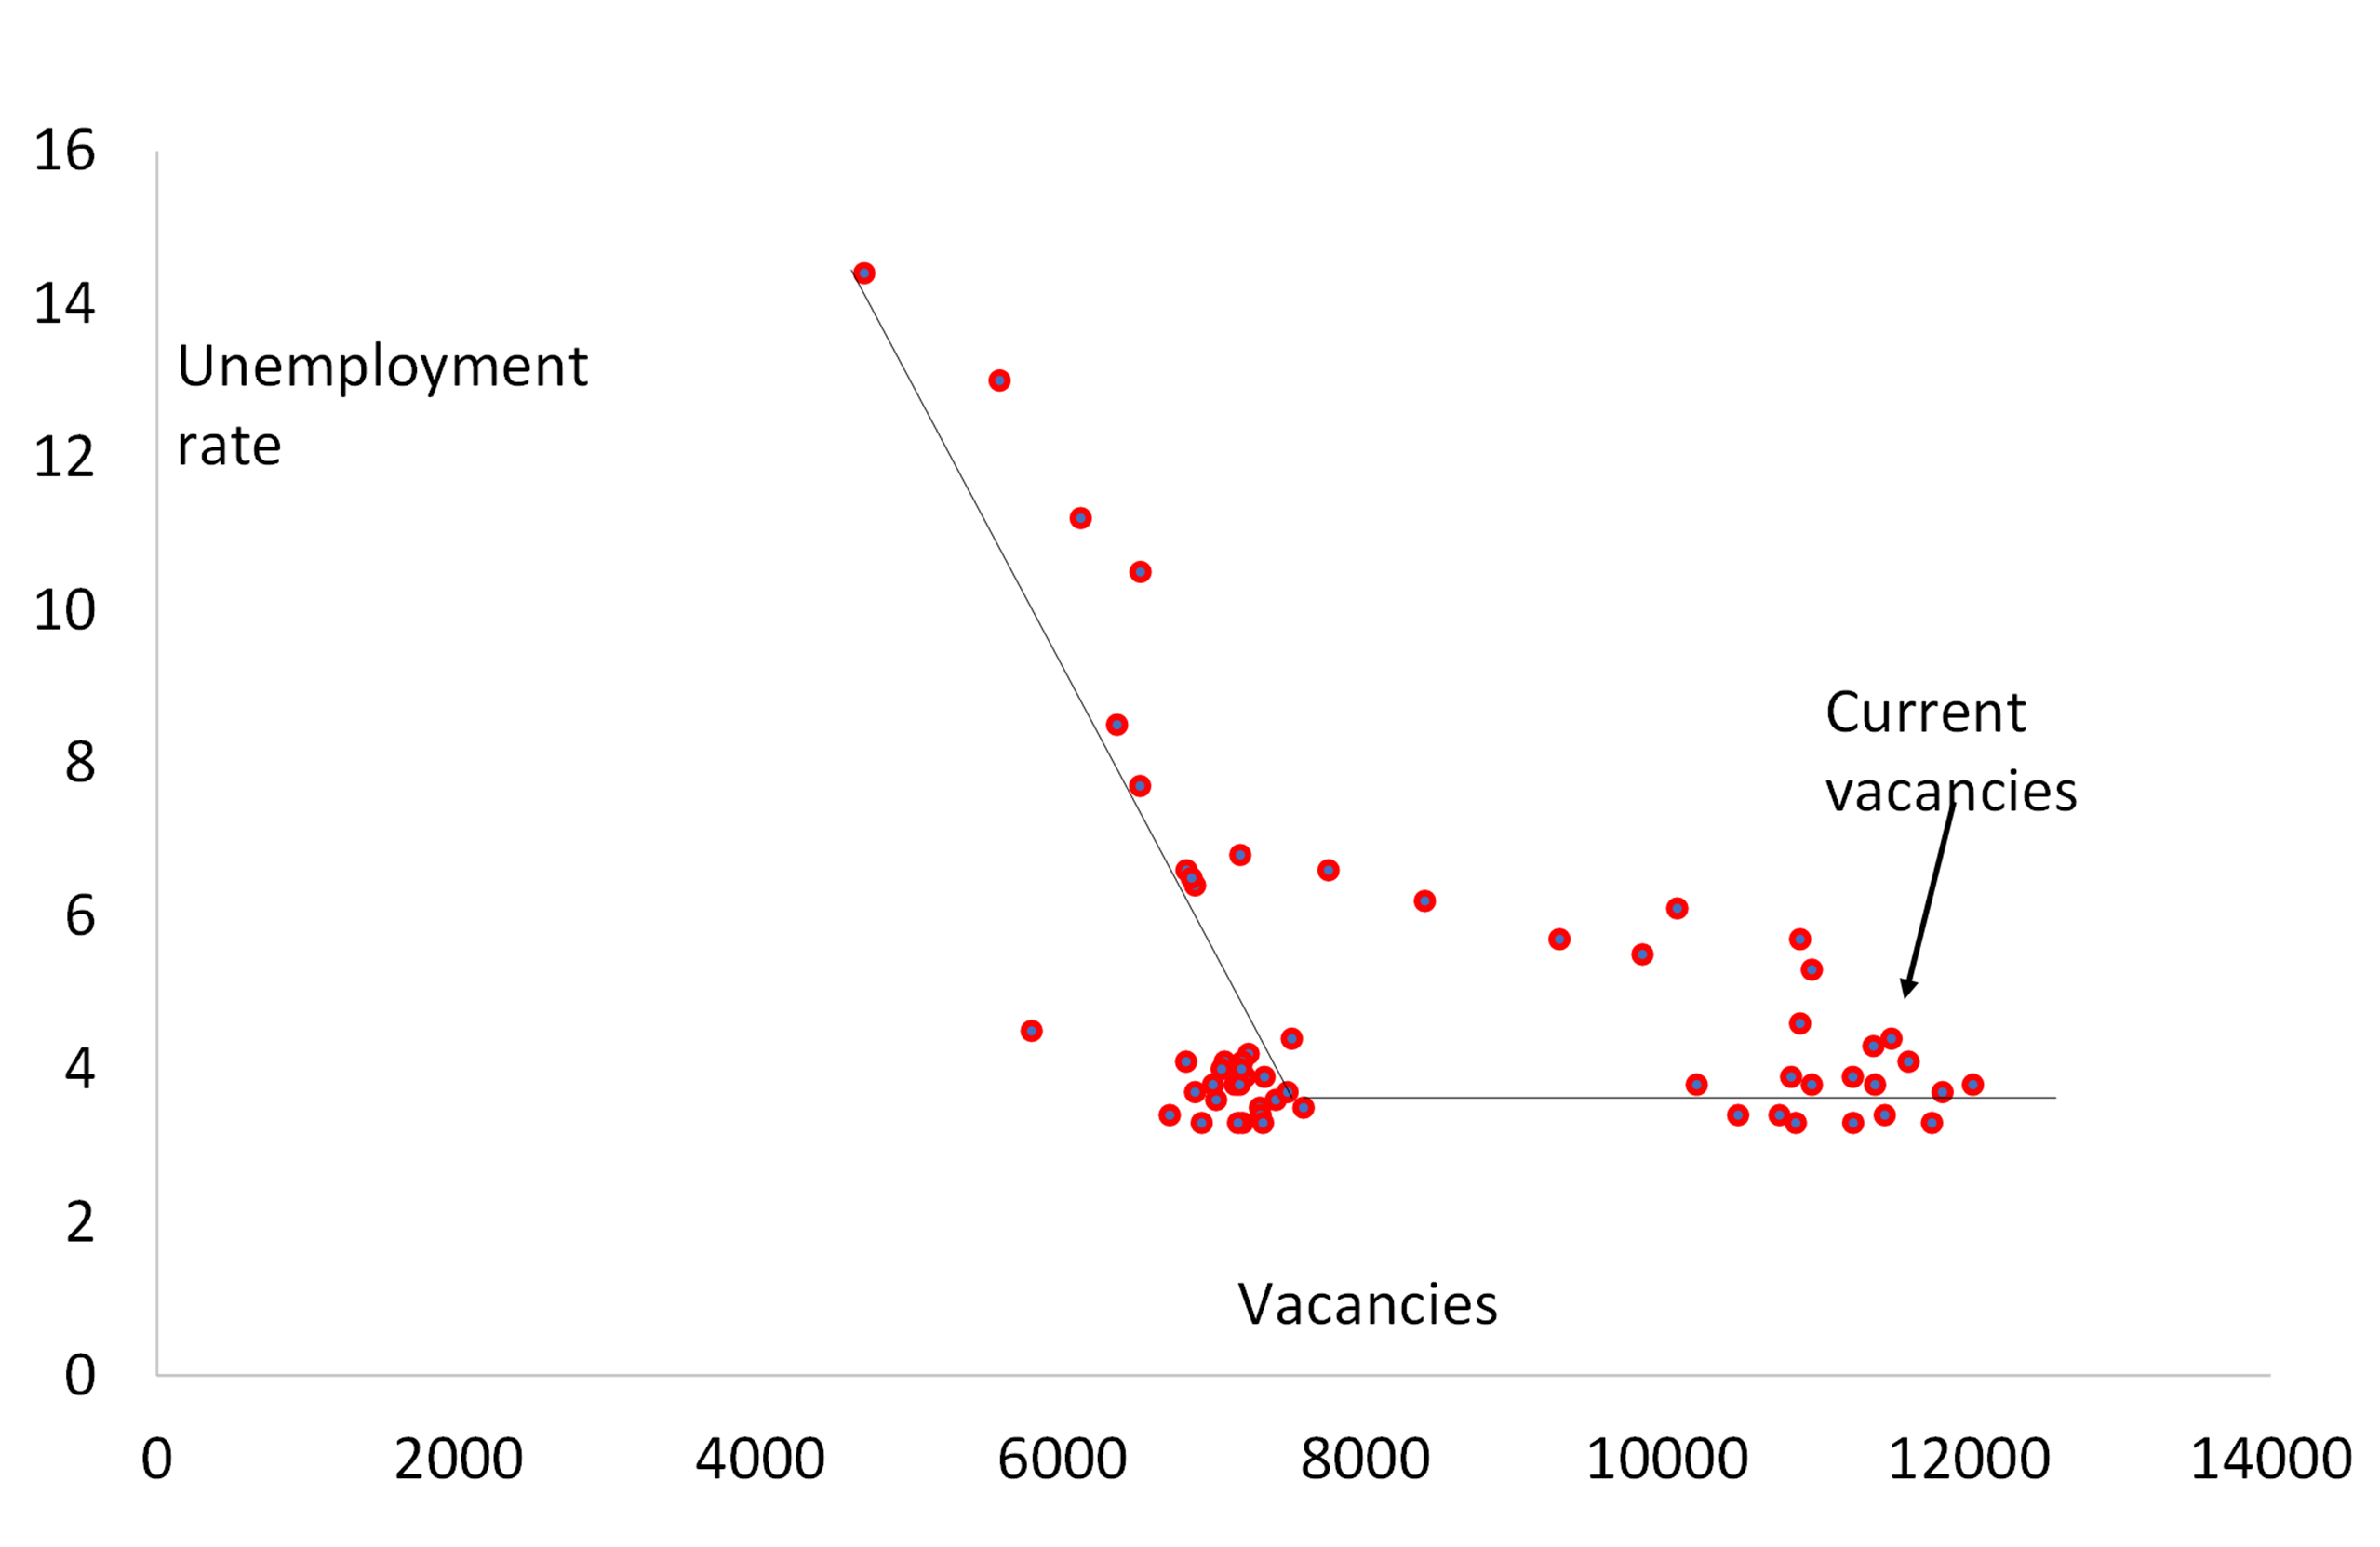
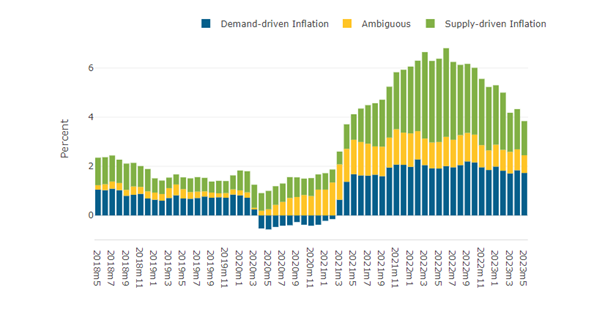
This suggests that it is not ‘excessive’ demand or ‘excessive’ money supply growth that caused inflation, as mainstream theories argue, but something on the ‘supply-side’. Indeed, supply factors have been much more important, as the San Francisco Fed analysis shows.
The reason for low unemployment also lies with the ‘supply-side’. In the US, there has been a significant increase in ‘early retirement’ as older workers decided not to return to the labour market after the pandemic; and in the US and the UK, for example, the hit to the health of many workers from ‘long COVID’ and also the lack of medical treatment for other ailments during the pandemic has meant a huge drop in labour supply.
US labour force participation rate
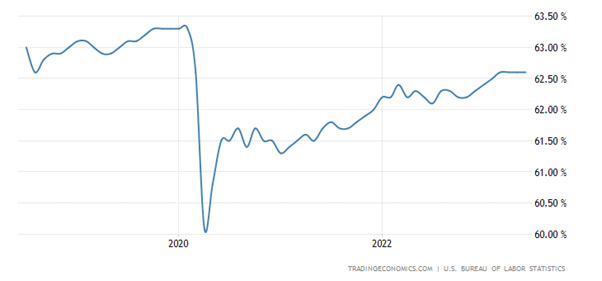
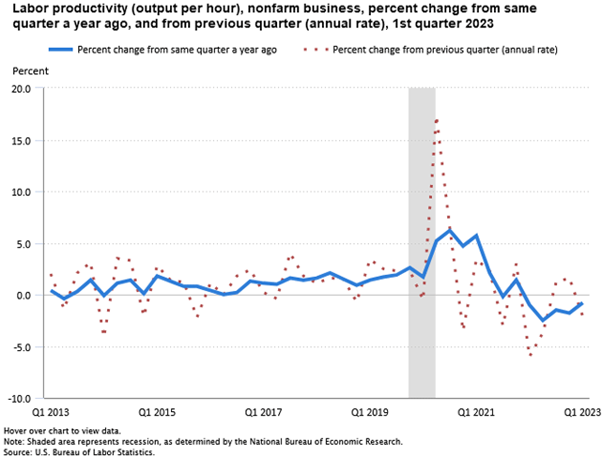
And the productivity growth of the existing labour force has been historically low in all the major economies. Many skilled workers have left the labour market for good to survive on their pensions; while employers, rather than invest in labour-saving technology, have simply tried to raise production with more labour. As a result, productivity growth has slumped. That means any wage rises that workers achieve tend to drive up labour costs per unit of production.
That keeps inflation rates ‘sticky’, assuming the companies can pass on rising labour costs into price rises. They were able to do that during 2021-222, but now that is increasingly difficult and corporate profit margins are falling back.

US corporate profits are now falling. According to FactSet, for Q2 2023, the blended earnings decline for the S&P 500 is -7.1, the largest earnings decline reported by the index since Q2 2020 (-31.6%). And much of the high profits and stock market gains have been confined to the seven large tech stocks – up 58% so far this year compared to just 4% for the other 493 stocks in the S&P 500 index.
The view, as expressed by Noah Smith, is that the battle against inflation is won without the major economies slipping into a slump. Central banks will soon be able to stop raising interest rates and the major economies, particularly the US, will have ‘soft landing’ and then resume some measure of steady economic growth alongside modest inflation that means rising living standards for all. This ‘Goldilocks’ scenario of economies that are not ‘too hot’ nor ‘too cold’ is the consensus view of financial investors. As a result, the US stock market is booming and reaching new post-pandemic highs.
But the economic data don’t really support the consensus. It’s true that US real GDP growth picked up in Q2, according to first estimates, rising at an annual rate of 2.4% compared to 1.8% in Q1. This appears to have been driven by an exceptional burst in business investment, mainly in transport equipment. That will not be repeated in the second half of 2023.
The latest economic activity indexes (called PMIs) for July (the beginning of Q3) show that the major economies were slowing significantly, with the Eurozone contracting outright. Australia was also in recession and Japan, the UK and the US were slowing towards zero expansion. Manufacturing everywhere has already been contracting, but now the services sector was also slowing down. The US economy has been the strongest and even there the US index fell back. Excluding the pandemic period, the global PMI is now at its lowest level since the ‘mini-recession’ of 2016 (blue line).

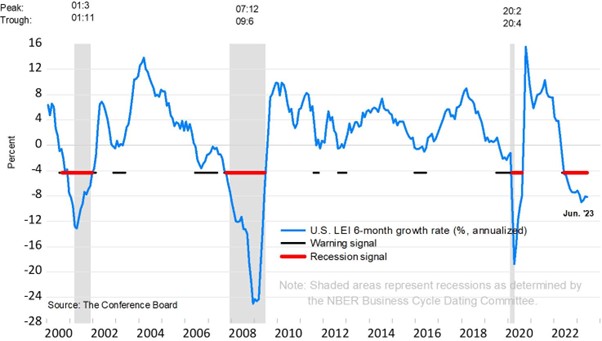
Indeed, the US Conference Board Leading Economic Indicator (LEI) forecasts a recession in the US before the year is out. The LEI fell again in June, “fueled by gloomier consumer expectations, weaker new orders, an increased number of initial claims for unemployment, and a reduction in housing construction,” said Justyna Zabinska-La Monica, Senior Manager, Business Cycle Indicators, at The Conference Board. The LEI has been in decline for fifteen months—the longest streak of consecutive decreases since 2007-08, during the runup to the Great Recession. “Taken together, June’s data suggests economic activity will continue to decelerate in the months ahead.” The Conference Board forecasts that the US economy is likely to be in recession from Q3 2023 to Q1 2024.
Globally, there is already a trade recession. The annual growth rate of global import volumes turned negative late last year and remained negative in 2023. This trade recession is a feature of the Long Depression (my term), which has been putting downward pressure on global trade growth for more than a decade now. In the ten years to 2020, the average rate of global trade growth fell below that of global GDP growth: this was the first decade since the second world war for which that statement holds true.
And the banking crisis that emerged last March is still on the horizon again, as rising interest rates drive down the demand for loans and corporate bankruptcies rise. US bank lending to commercial and industrial sectors has started to contract. And loan growth in the Eurozone is at a 20-year low. That will eventually squeeze investment.

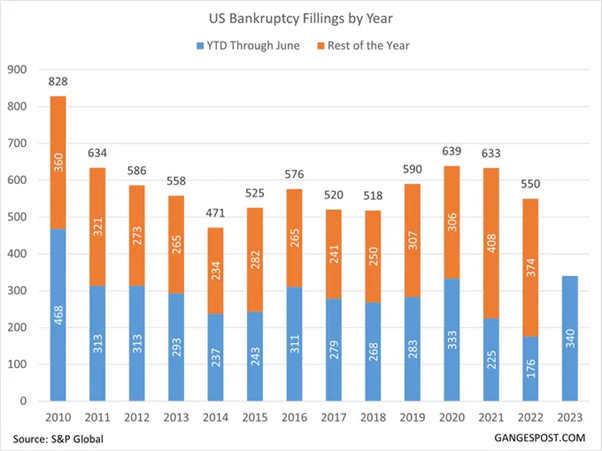
Indeed, corporate bankruptcies have spiked in the last few weeks.

US consumer prices inflation dropped sharply in June to 3.0% yoy and ‘core’ inflation, which excludes food and energy prices, also fell back to 4.8% yoy. These figures took the inflation rate back to 2021 levels. But this has not been achieved by central bank monetary policy pushing down ‘excessive demand’ but through slowing growth, particularly in manufacturing and trade. What’s going to bring inflation down further is not more rate hikes but a recession.
July 23, 2023
Spain: another swing to the right in Europe?
Amid the searing heat of this European summer, Spain’s citizens go to the polls today to elect a new parliament. Spain (unlike Portugal, Italy or Greece) still has a monarch. And this ‘constitutional’ monarch appoints a government that can command a majority in parliament.
The current government is a minority of Spanish socialists led by Pedro Sanchez and backed by the leftist grouping now renamed Suma and by sundry small nationalist parties from the Basque and Catalan regions. Sanchez has called a snap election, unprecedented in the middle of summer and just before the August holiday break. Why? Because support for his government is crumbling at the seams and he fears that the economic situation could deteriorate further if he leaves an election to later on. Moreover, he aims to gain votes at the expense of the weakening leftist parties within Suma.
However, the latest opinion polls show that the most likely result is a victory for the main pro-capitalist People’s Party (PP) under Nunez Feijoo (former head of the Post Office!) – but this time it will probably be in alliance with the rising ‘extreme’ right Vox party. The PP demolished the Socialists in recent regional elections in Madrid and the Vox made big gains in several other areas and cities. The latest polls show the PP on about 32% of 27m potential voters; the Socialists on 28%; the Suma on 14% and Vox on 13%.
A PP-Vox victory would mean a loosening of regulations on business and the environment. For example, the PP has gained support among farmers by pledging to make it legal to irrigate more land, even if that meant the drying up of rivers in southern Spain. Vox will be demanding more ‘social and cultural’ measures to weaken abortion and gay rights, as well as stricter controls on immigration. And this coalition will apply more severe austerity measures on government spending, particularly social spending and try to introduce further ‘pension reforms’. PP statement: “The party will emphasise economic growth, job creation and prosperity, low taxes – for low taxes means growth, which means better finance for public services. That said, government should be austere and not squander wealth. It must support business and the self-employed instead of attacking them.”
These are predictable policies of rightist parties in Europe and they are winning in Italy and gaining strength across the region. Why? Well, in Spain as in most of the rest of Europe, incumbent governments are being blamed for the disastrous response to COVID pandemic and following inflationary spiral that has hit working people hard.
The pandemic lockdowns and deaths were particularly severe in Spain and the inflationary spiral reached double-digits in 2022. And this could hardly be blamed on the Russian invasion of Ukraine. In fact, Spain has the least reliance on energy imports from Russia.

And it has the best base for alternative LNG production.

Inflation was already accelerating before the Russian invasion, driven, as elsewhere, by the supply chain blockages after the pandemic which caused global energy and food prices to rocket – and also the weak recovery in productivity growth that meant goods producers could not meet revived demand and so prices across the board rose. Spain’s inflation rate rose to double-digits, only the UK was worse.

And as elsewhere, average workers’ real wages fell sharply and for the poorer-paid it was even worse. In the OECD, Spain is where real incomes have fallen the most since Covid. Again, as elsewhere, wage rises were not the cause of the inflationary spiral. On the contrary, wage increases failed to match price inflation.

As the IMF put it in its latest report on Spain: “imported energy products accounted for about 75 percent of Spain’s total energy needs in 2020. As a result, soaring international energy prices have translated into a large negative terms of trade shock, with substantial impact on inflation and real national income. The erosion of purchasing power has been more pronounced for poorer households since they spend a larger share of their income on energy and food.” Indeed.
The reality is that, like many other major capitalist economies, workers have paid the price for COVID, the energy crisis and accelerating inflation – and social democratic governments as in Spain have failed to make a difference.
Indeed, Spanish capitalism has followed a trajectory in familiar in Europe. After Spain joined the EU in the 1980s, its much-heralded economic boom saw 3.5% real growth a year. But increasingly that boom was based less on productive investment for industry and exports and more on a housing and real estate credit bubble, particularly in the 2000s leading up to the Great Recession and the Euro debt crisis 2009-2012. As the IMF summed it up then: “The pre-crisis period was characterized by decreasing productivity of capital, measured as output per units of capital stock, both in absolute terms and relative to the euro area average. This is because capital flew to non-tradable sectors, in particular construction and real estate, characterised by higher profitability but lower marginal returns. By contrast, investment in information and communication technologies or intellectual property remained below that of other euro area countries.”
And in the Long Depression decade of the 2010s, Spanish governments applied severe austerity measures on government spending and held down any significant wage rises. This began to break up the Spanish state, with regional governments driven deeply into debt and being asked to make huge spending cuts. That’s why richer regional areas with their own nationalist interests, as in Catalonia and the Basque Country, continue to make noises about separation from Madrid. Any improved profits went into speculation in financial assets or real estate. Productive investment remained weak.

As a result, growth in the productivity of labour, the key to boosting long-term growth and reducing inflation, crawled nearly to a halt.

The ultimate reason for the failure of productive investment and productivity growth in capitalist economies lies with the profitability of capital – and Spain is no exception. Every measure of Spanish capital’s profitability reveals the same long-term decline. Here is mine.

Source: EWPT, AMECO, author’s calculation
And here is the IMF’s, in their latest report on Spain.

Despite the austerity measures of the 2010s, the COVID pandemic and previous government bailouts of Spain’s reckless banks have driven up government debt to GDP to 113%, with annual gross financing needs even higher than debt-ridden Italy.

Government spending was lower than in many other EU countries and much went in covering interest payments on existing debt and unemployment benefits, while productive investment in means of production and labour skills fell.

Some things did change under the Sanchez government. In particular, reform of the labour market led to an increase in permanent jobs, particularly for the youth, where unemployment and temporary and precarious work had dominated.

Despite the recent progress, Spain remains among the EU countries with a largest share of temporary employment.

What economic challenges face the new government? Well, the latest inflation figures show that Spanish inflation has fallen to under 2%, the first euro area country to achieve the ECB target. But that hides the core inflation rate (which excludes food and energy) which is stll around 6% a year. That means the hit to workers real incomes will continue.
Spain’s economy is likely to grow by less than 2% this year (probably closer to 1%), with little change next year – and that assumes no global slump in the next 12 months. Everything depends on getting and using the huge funding for investment being offered by the EU under the so-called Recovery and Resilience Plan (RRP). The funds from the EU could total €70 billion or 5.5% of 2022 GDP cumulative to 2027, so putting about 1% pt of GDP extra in investment. The next government is relying on this to keep the capitalist sector going while also imposing new austerity measures to get government budget deficits and debt down. Meanwhile the ECB will continue to hike interest rates and borrowing costs for households with mortgages and small businesses with loans.
The IMF is keen that it does so: “In the context of tightening financial conditions and high public debt, a moderate domestic fiscal consolidation in 2023 would help contain inflation and boost investors’ confidence. A sustained multi-year gradual consolidation will be needed to put debt on a firm downward path. An early formulation of credible medium-term plans would help build the necessary social consensus. Additional measures should offset the increase in pension spending resulting from the 2021 reform.“
Spanish households are highly exposed to rising interest rates, given the high concentration of variable-rate mortgages (about 75 percent of total outstanding). Higher interest rates are also set to increase small firms’ financial burdens. The IMF reckons that the share of debt of vulnerable so-called ‘zombie’ firms (i.e., those with interest coverage ratios below one) could reach levels last seen in 2013 once loans with longer maturity reprice fully.
And remember, the underlying inequalities in income and wealth in Spain, again as elsewhere, have only got worse in the last 30 years. At present, Spain is one of the most unequal nations in Europe, and income inequality in the country is forecast to grow in the near future.
Gini inequality ratios

And Spain’s poverty rate at 15% (the poverty rate is the ratio of the number of people (in a given age group whose income falls below the poverty line taken as half the median household income of the total population) is also among the highest in Europe.

The top 1% of Spanish households have 25% of all personal wealth and top 10% have 60%, while the bottom 50% have less than 7%. And these ratios are unchanged in 20 years.

Any new right-wing government will only make things worse for Spanish working people. But they may still come into office because of the failure of the social democratic government before it.
Michael Roberts's Blog

- Michael Roberts's profile
- 35 followers


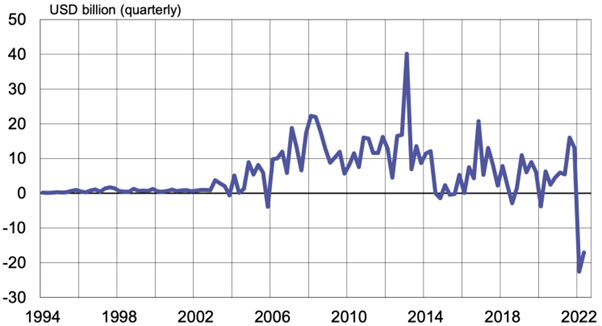
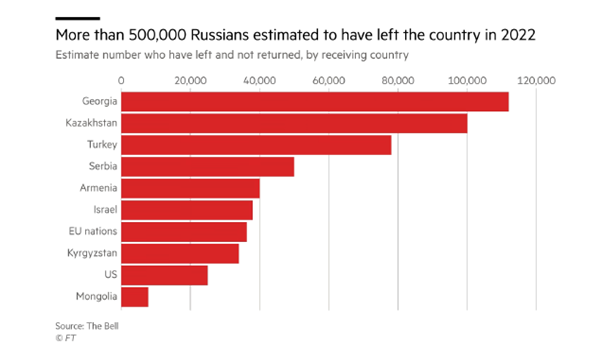