
Michael Roberts's Blog, page 18
October 27, 2023
US economy expanding?
The first estimate of third quarter real GDP growth in the US was released yesterday. It showed the US economy expanded by an annualised rate of 4.9%. The Financial Times called this a “blistering pace that, not for the first time, defied gloomier predictions from economists.” US Treasury Secretary Janet Yellen commented that “It’s a good, strong number and it shows an economy that’s doing very well,” and she is “not expecting growth at that pace to continue, but we do have good, solid growth.”
The doomsayers (like me?) have been proved wrong. The consensus is now that is very likely that the US economy would see inflation drop back to pre-pandemic levels without having to go into a slump and so suffer any significant rise in unemployment – in other words, a ‘soft landing’. And assuming that this first estimate of Q3 growth is not significantly reduced in the second estimate in a few weeks, then it seems that the US economy will avoid a slump this year.
But there are some caveats. The headline growth rate of 4.9% is an annualised figure i.e, quarterly real GDP growth in Q3 was actually 1.2% up over Q2, but the US statisticians multiply that by four to get an ‘annualised rate’. No other major economy’s stats are presented in this way. Even so, it is still a relatively strong figure and certainly likely to be faster than any other G7 economy. The rise over Q3 2022 (ie one year ago) was 2.9% – still higher than elsewhere, but not so startling as the annualised figure.
Where is this growth coming from? Most of the faster growth in Q3 came from 1) higher consumer spending on health, utilities and durable goods 1) a rise in stocks of inventories and 3) from a sharp rise in government spending.
American households have continued to spend more. That’s partly because unemployment is low and Americans are getting wages from work. As the inflation rate has fallen back, for the first time in two years, real wages have now started to rise. Americans are also using savings built up during the pandemic lockdowns to sustain spending. But these ‘excess savings’ have now been run down.
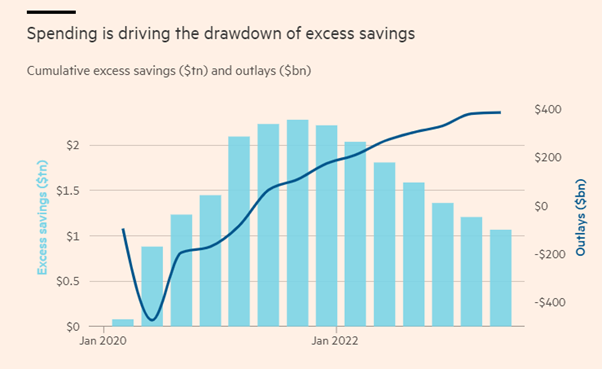
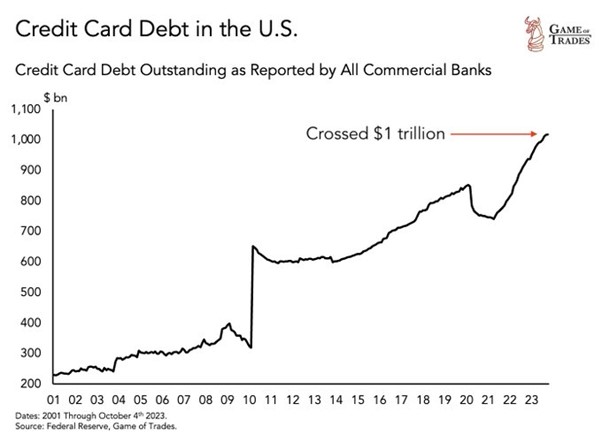
As a result, households are running up debts (credit cards etc) to sustain spending.
So it is unlikely that the US consumer will contribute as much to future US real GDP growth.
Then there are inventories or the stock of unsold goods. In the Q3 growth figure, inventories contributed 1.3% pts of that 4.9% headline rate. That tells you that even though the US consumer is still buying more, unsold sales are building up and companies will have to slow production in future to run down existing stocks.
Another large contributor to Q3 growth was government spending and investment, some 0.8% pts of that 4.9%. In previous quarters, this spending increase was for infrastructure. But in Q3, there was a very sharp increase in spending on arms and other military activities.
If we just look at the core drivers of economic growth in a capitalist economy ie consumption and investment, then the annualised growth rate is much less than 4.9% – or 2.5% annualised.
Those core drivers did pick up a bit in Q3, but is that likely to continue in Q4 and into 2024? Well, personal consumption growth is likely to slow as ‘excess savings’ disappear and rising interest rates on loans and credit cards force households to reduce borrowing. And that applies even more to business investment, the productive part of investment.
Changes in business investment have always been an indicator of future growth in output and employment – not vice versa, as Keynesians argue. And in Q3, business investment came to a standstill. In previous quarters it was investment in new structures (offices, manufacturing plants etc) that kept business investment contributing about 1% pt to quarterly growth. But in Q3 that has evaporated.
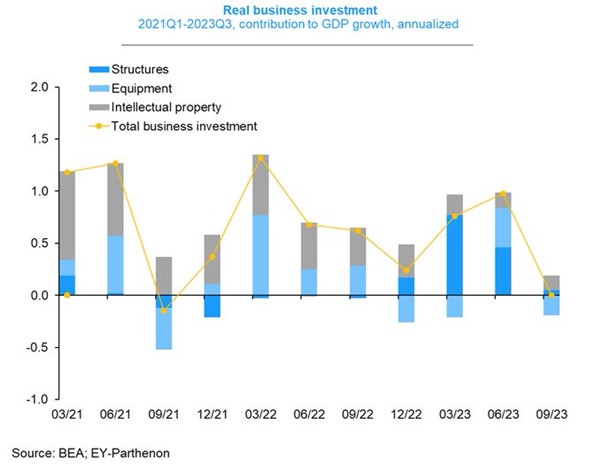
Why? Two reasons. First, the profitability of investing in productive sectors of the economy, unless subsidised by government tax handouts etc, is very low. So there is no incentive to invest.
And second, rising interest rates caused by the Fed hiking its policy rate, supposedly to control inflation, has increased borrowing costs to levels not seen since the 1970s. Indeed, Goldman Sachs point out that the number of unprofitable firms reached almost 50% of all publicly-listed companies in 2022. The share of business activity that they account for is much smaller, but still an economically meaningful 10% of total business revenues and 13% of capital spending and employment. GS comments that “higher funding costs could force some of these companies to cut labor costs or even close. Unprofitable firms tend to cut capital spending more aggressively when faced with margin pressure, and we find they also cut labor costs more aggressively when hit with interest rate shocks.”
So if personal consumption growth is set to slow into 2024 and business investment to fall absolutely, then this Q3 data will be the last good news for the US economy. And as I showed in my September post, A soft landing?, there are other signs of slowdown. Job vacancies are declining; an increase in hours worked by those in work has slowed to a trickle. Most forecasters now expect US GDP growth to fall to an annualised 0.8% next quarter and then down to 0.2% growth in Q1 2024.
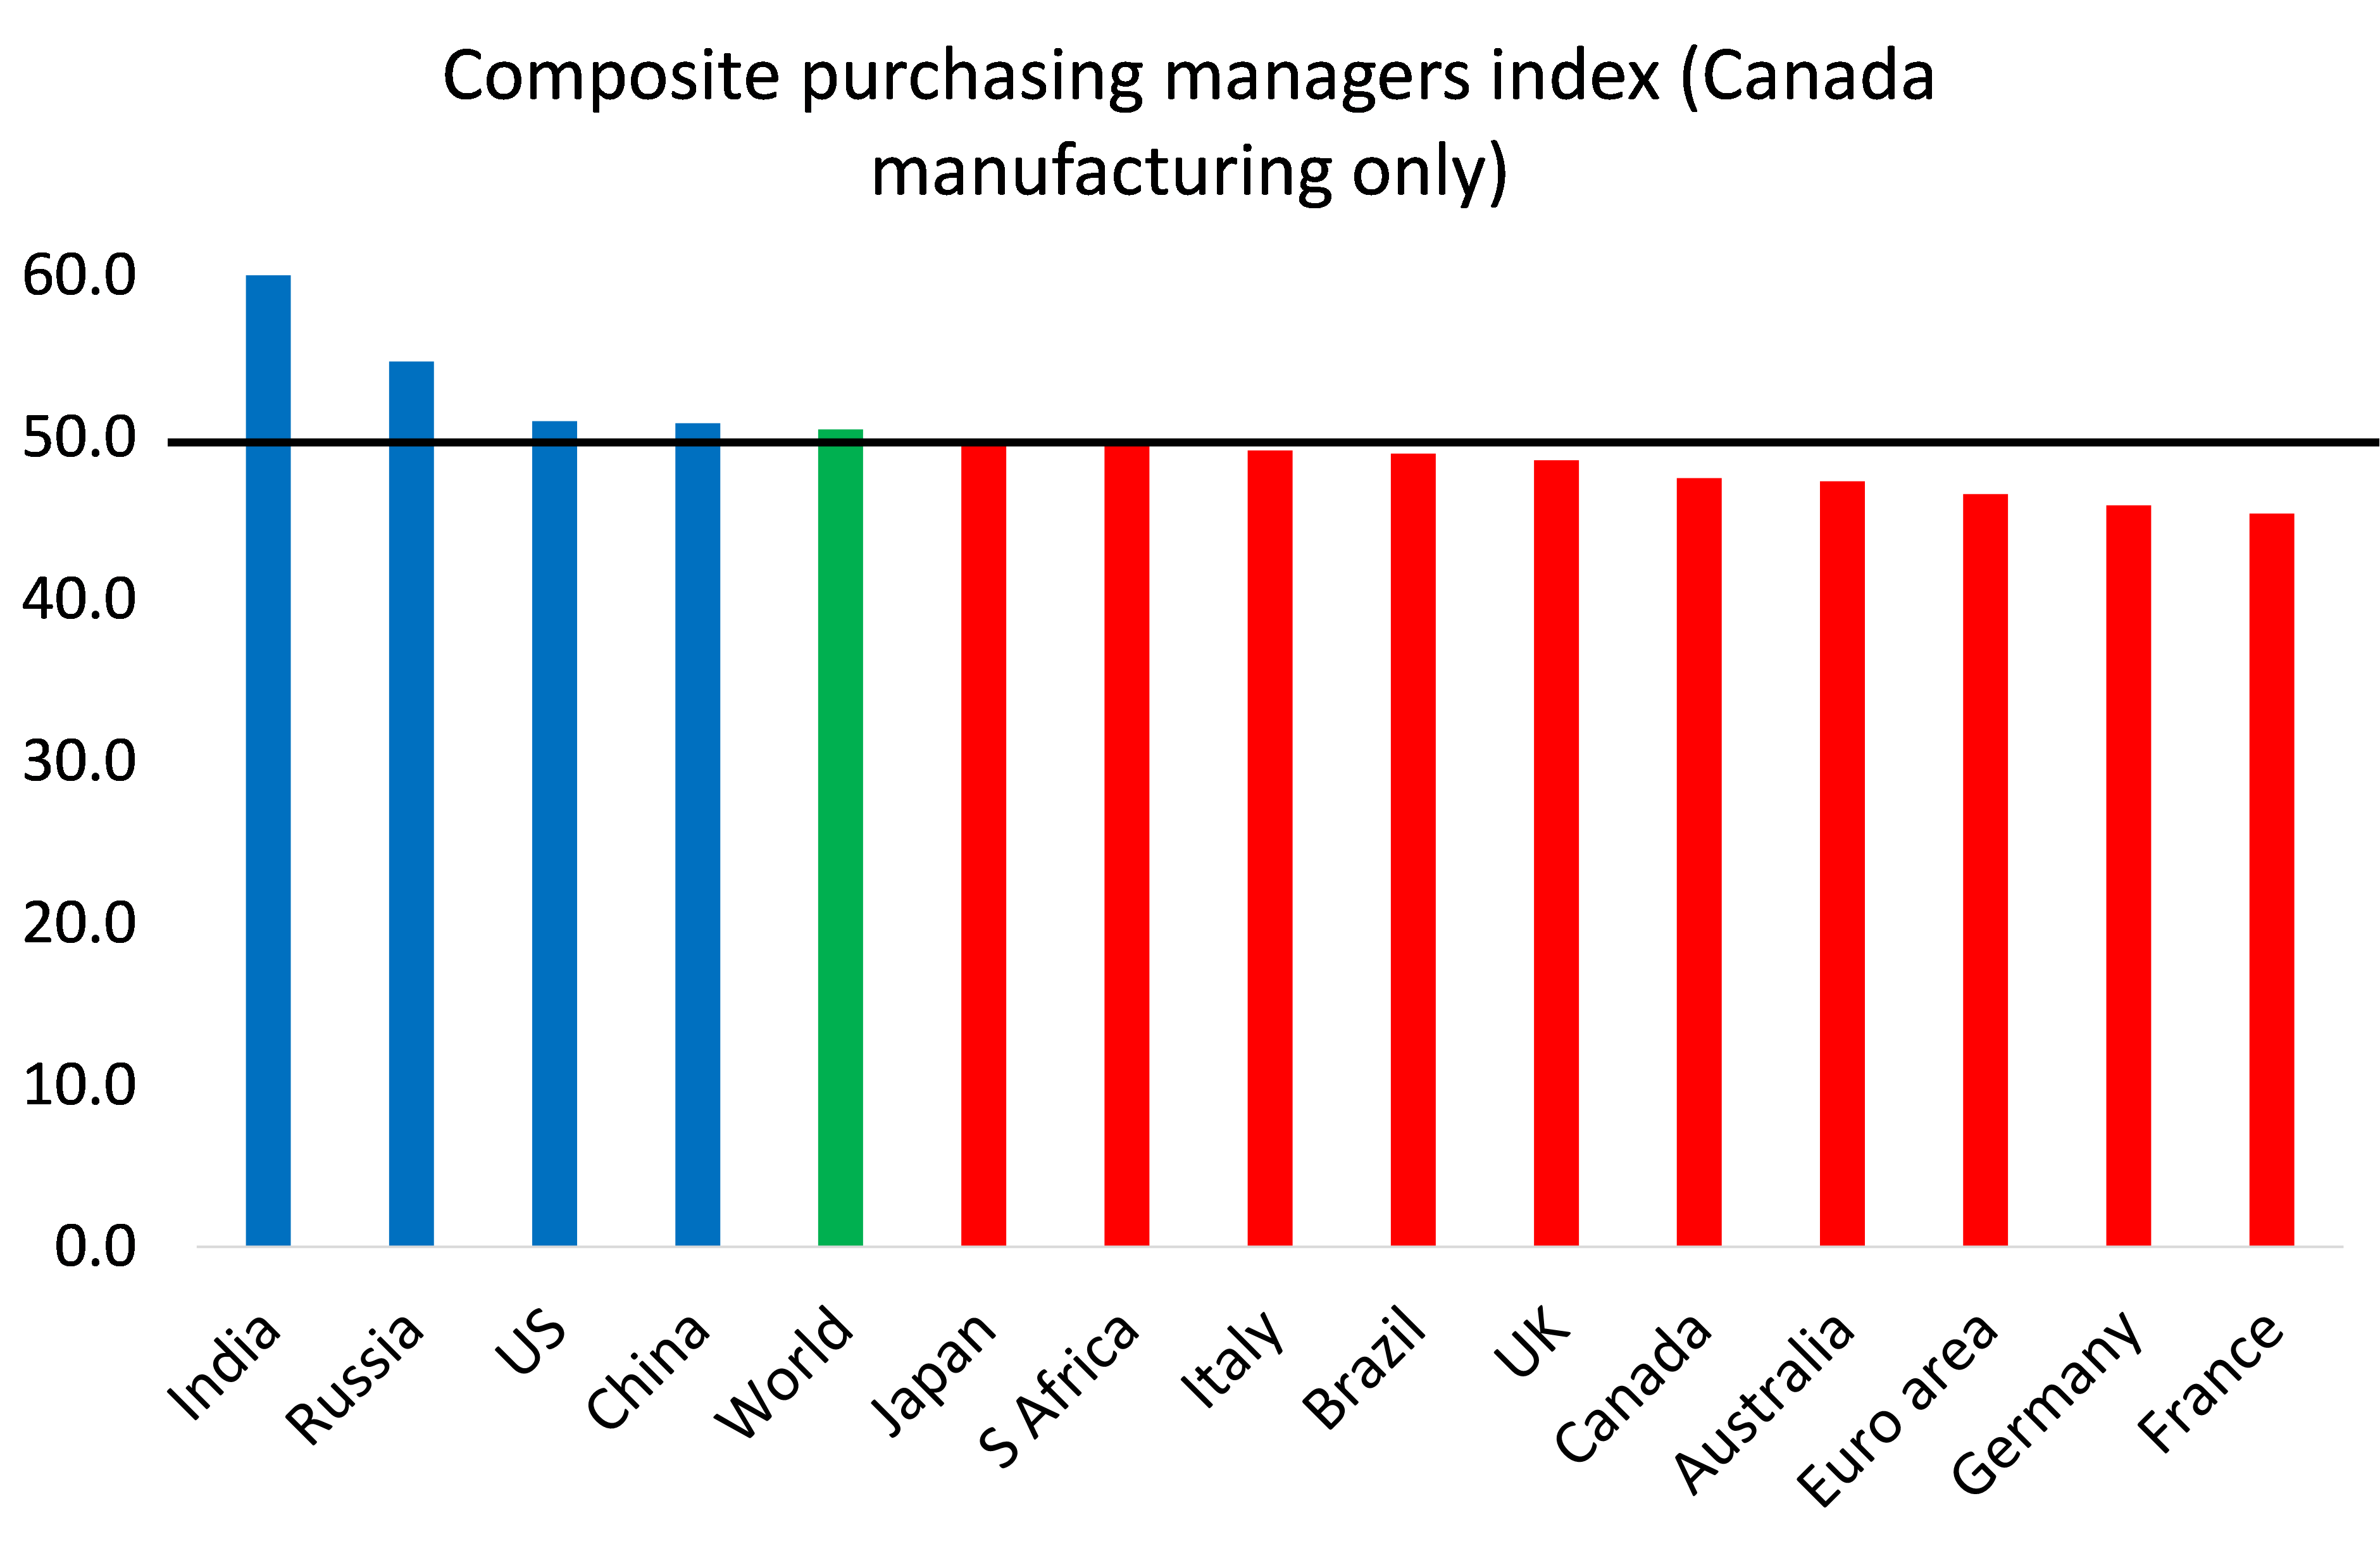
Moreover, the consensus may be for a soft landing in the US, but globally that is not so. A reliable high frequency guide to current economic activity is the so-called purchasing managers’ index (PMI) – surveys of companies’ sales, orders and employment. The composite PMI shows the level of activity in both manufacturing and service sectors. Anything above 50 means expansion; anything below means contraction. The latest October PMIs show that the world economy is teetering on recession, with only the US, India, China (and the war economy of Russia) still expanding. Nearly every other major economy is contracting on this measure in October.
The US may have been expanding in Q3, but most of the rest of the world was contracting; and in 2024, they may be joined by the US.


October 22, 2023
Argentina election: from peso to dollar?
Argentines will vote in general elections today with both the mainstream parties weakened by the legacy of multiple economic crises and challenged by a libertarian outsider, Javier Milei.
The deeply unpopular current president Alberto Fernández, of the centre-left Peronist movement, has opted not to run in the presidential election after almost four years in power. Former president and current vice-president Cristina Fernández de Kirchner, leader of Peronism’s more radical left wing, is also absent from the ballot. Instead, the Peronist candidate is economy minister Sergio Massa, from the right-wing.
Also running is former security minister Patricia Bullrich, who is on the right of Argentina’s pro-business opposition coalition, Juntos por el Cambio (JxC). But it is Milei that leads in the polls

To win the presidency outright, a candidate would need 45 per cent of the vote, or 40 per cent with a 10-point lead over their nearest rival. Most pollsters expect Milei to come first and enter a second-round run-off against either Massa or Bullrich on 18 November. He could then win the run-off.
Milei has come from nowhere in a matter of months to take the pollster lead. His rise expresses the desperation that many Argentines feel about the state of their country and their living standards and the outright failure of previous Peronist and ‘pro-business’ presidents.
Milei’s party, La Libertad Avanza (Freedom Advances), movement is totally built around his personality. His eccentric career includes turns as a tantric sex guru and cosplay enthusiast, support for radical ideas such as legalising the sale of human organs. He opposes abortion and favours liberalising gun ownership.
A self-styled ‘anarcho-capitalist’, Milei believes in unfettered free markets, unrestricted free trade and giving primacy to ‘private property and individual freedom’. His beloved English Mastiff dogs, cloned from the DNA of a dead pet named Conan, carry the names of leading conservative economists: Milton Friedman, Murray Rothbard and Robert Lucas.
After teaching economics to university students and working for Corporación América, Milei found fame as a commentator on television chat shows, making scathing diagnoses of Argentina’s economic woes and arguing that the solutions for fixing them were simple: get rid of the central bank (he smashed a piñata of the central bank on television on his birthday) and ‘dollarise’ the economy. He wants to slash government services to the minimum and reduce welfare handouts.
His current popularity is due to the state of Argentina’s economy. Inflation is forecast to reach 210 per cent by the end of this year, estimates JPMorgan.
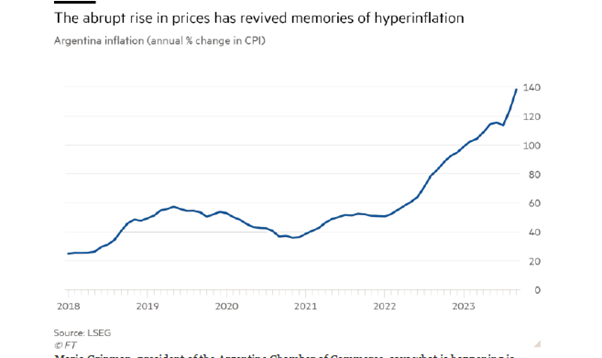
The Argentine peso has plummeted in value against the dollar, fueling yet more inflation through imported goods.

In attempting to keep the peso from meltdown, the central bank has bought pesos with its dollar reserves. But now net foreign currency reserves are about $7.6bn in the red and the government is struggling to service snowballing debts to local bondholders.

The country is facing massive repayment obligations to the IMF and foreign bondholders after the $44bn IMF programme used to bail out the previous right-wing Macri government evaporated in rising government deficits and in capital flight abroad.

The Peronist government under economy minister Massa has presided over central bank money-printing to fund the deficit, something that has pushed up inflation further and devalued the peso. By the way, this lends the lie to Modern Monetary Theory (MMT) that argues governments can ‘print’ as much money as they need to cover government spending.

Meanwhile, Argentina posted its worst monthly trade deficit on record in June, underscoring the impact of a record summer drought hitting agro exports and driving the economy into a recession.

Indeed, a debt default has only been avoided so far by using short-term swap yuan loans from the Chinese government.

Is there any way out of these recurring crises for Argentina’s near 50m citizens? Milei says the solution to hyper-inflation and a falling peso is dollarisation. After all, he says, people no longer trust that the peso will ever be worth holding. As soon as they get paid their salaries in pesos or peso flows from somewhere, people want immediately to exchange those pesos into dollars. As a result, the Argentine economy is already very highly dollarised. Milei intends to call for a referendum to achieve this formally.
What would be the advantages of dollarisation? It would, in principle, solve the domestic inflation problem. This does not mean that there will be no inflation, but given the absence of exchange-rate fluctuations, the gravity centre for prices in dollars would then be US inflation, which is much lower.
A second positive element of dollarisation would be the reduction of the domestic interest rate, and so supposedly increasing investment and potential GDP levels. A third supposed benefit, only observable in the long run, would be the elimination of currency crises and the macroeconomic instability that they bring.
Dollarisation would go some way to defeating inflation. For example, Ecuador dollarised its economy in January 2000 and price stability was achieved by 2004. From then on, inflation has been on average 3.1 per cent a year, lower than the 28 per cent average between 1970 and 1999, and similar to Chile’s 3.3 per cent), Colombia’s (4.4 per cent) and Peru’s (2.9 per cent) in the same period.
But dollarisation would also mean immediate recession and slump. It would have to start with a massive devaluation of the domestic peso monetary base. In a very optimistic scenario, if Argentina received a loan of say $12 billion from the IMF and used $5 billion as a reserve for the banking system and $7 billion to dollarise the monetary base, the domestic peso monetary base would still have to be reduced by nearly 400%. Argentine salaries (then in US dollars) would become among the lowest globally and poverty would rise to unprecedented levels. And Argentina is already in a recession with real GDP expected to drop by around 2% this year. So either way: peso or dollar, Argentine households would pay the price in living standards.
Moreover, Ecuador’s dollarisation has been no great success for its economy. Ecuador was lucky when it dollarised because it could rely high oil revenues during the commodity price boom up to the mid-2010s. But after that, Ecuador was forced into cutting spending and raising taxes, which has aggravated a drop into recession in the last few years. Indeed, Ecuador has grown some 40% less than the rate achieved in the pre-dollarised years and Ecuador’s per capita income in 2019 was lower than in 2012.
Moreover, dollarisation means that economic policy would be in the hands of US Federal Reserve and dollar foreign investors. National monetary policies would be basically abandoned. Countries issuing their own currency can allow it to depreciate to improve exports and domestic production at least in the short term. But a dollarised economy must go down with any global recession. A strong US dollar also means high export prices for a dollarised Argentina, making it more uncompetitive in world markets – unless labour costs are reduced by wage cuts or by faster productivity growth that keeps unit labour costs low.
The real question that is not answered by any of the candidates is: why Argentina has got into an inflationary spiral for decades interspersed with debt crises and slumps. Part of the answer is that Argentina never industrialised like East Asia, or even Brazil. The Peronist governments failed to get Argentine capitalists to invest in productive sectors, despite Argentina’s plentiful natural resources and an educated workforce. The number of formal jobs in the private sector has barely grown in more than a decade, and more than half of employed Argentines work either off the books or for the state. Instead, there was reliance on agriculture which provided cheap food for the ‘Global North’. Agriculture is subject to the vagaries of the weather and dominated by a few agro multi-nationals. Look how the recent summer drought has meant for agricultural output and the economy.

In 1976, Argentine GDP was $51 billion and South Korea’s $30 billion. Today, the Argentine economy weighs in at about $80 billion annually. In South Korea, after half a century of industrialisation, annual GDP stands at $1.6 trillion. Argentina’s per capita GDP is today almost the same as it was in 1974, with the additional problem of inequality between the rich and the poor being considerably greater.

The imbalance in Argentina’s economy is revealed by its high dependence on agricultural exports to get dollars. Over half of exports are from agricultural goods, way more than other LA economies, while the share of manufacturing exports is tiny. Directly or indirectly, Argentine agriculture employs only two million people, or 14% of the working population and contributes only 10% of GDP. Yet for every $10 Argentina banks through exports, nearly $6 comes from agriculture. Without agricultural exports, Argentina would garner scarcely any foreign currency.

Argentina’s investment to GDP ratio has been consistently below the other major Latin American economies.

As a result, real GDP growth has been poorer, particularly in the 21st century, although that applies to all the major LA economies..

Argentina’s capitalists have not invested productively because the profitability of doing so has been so poor. Here is the track record of the profitability of Argentine capital from the World Profitability Database.
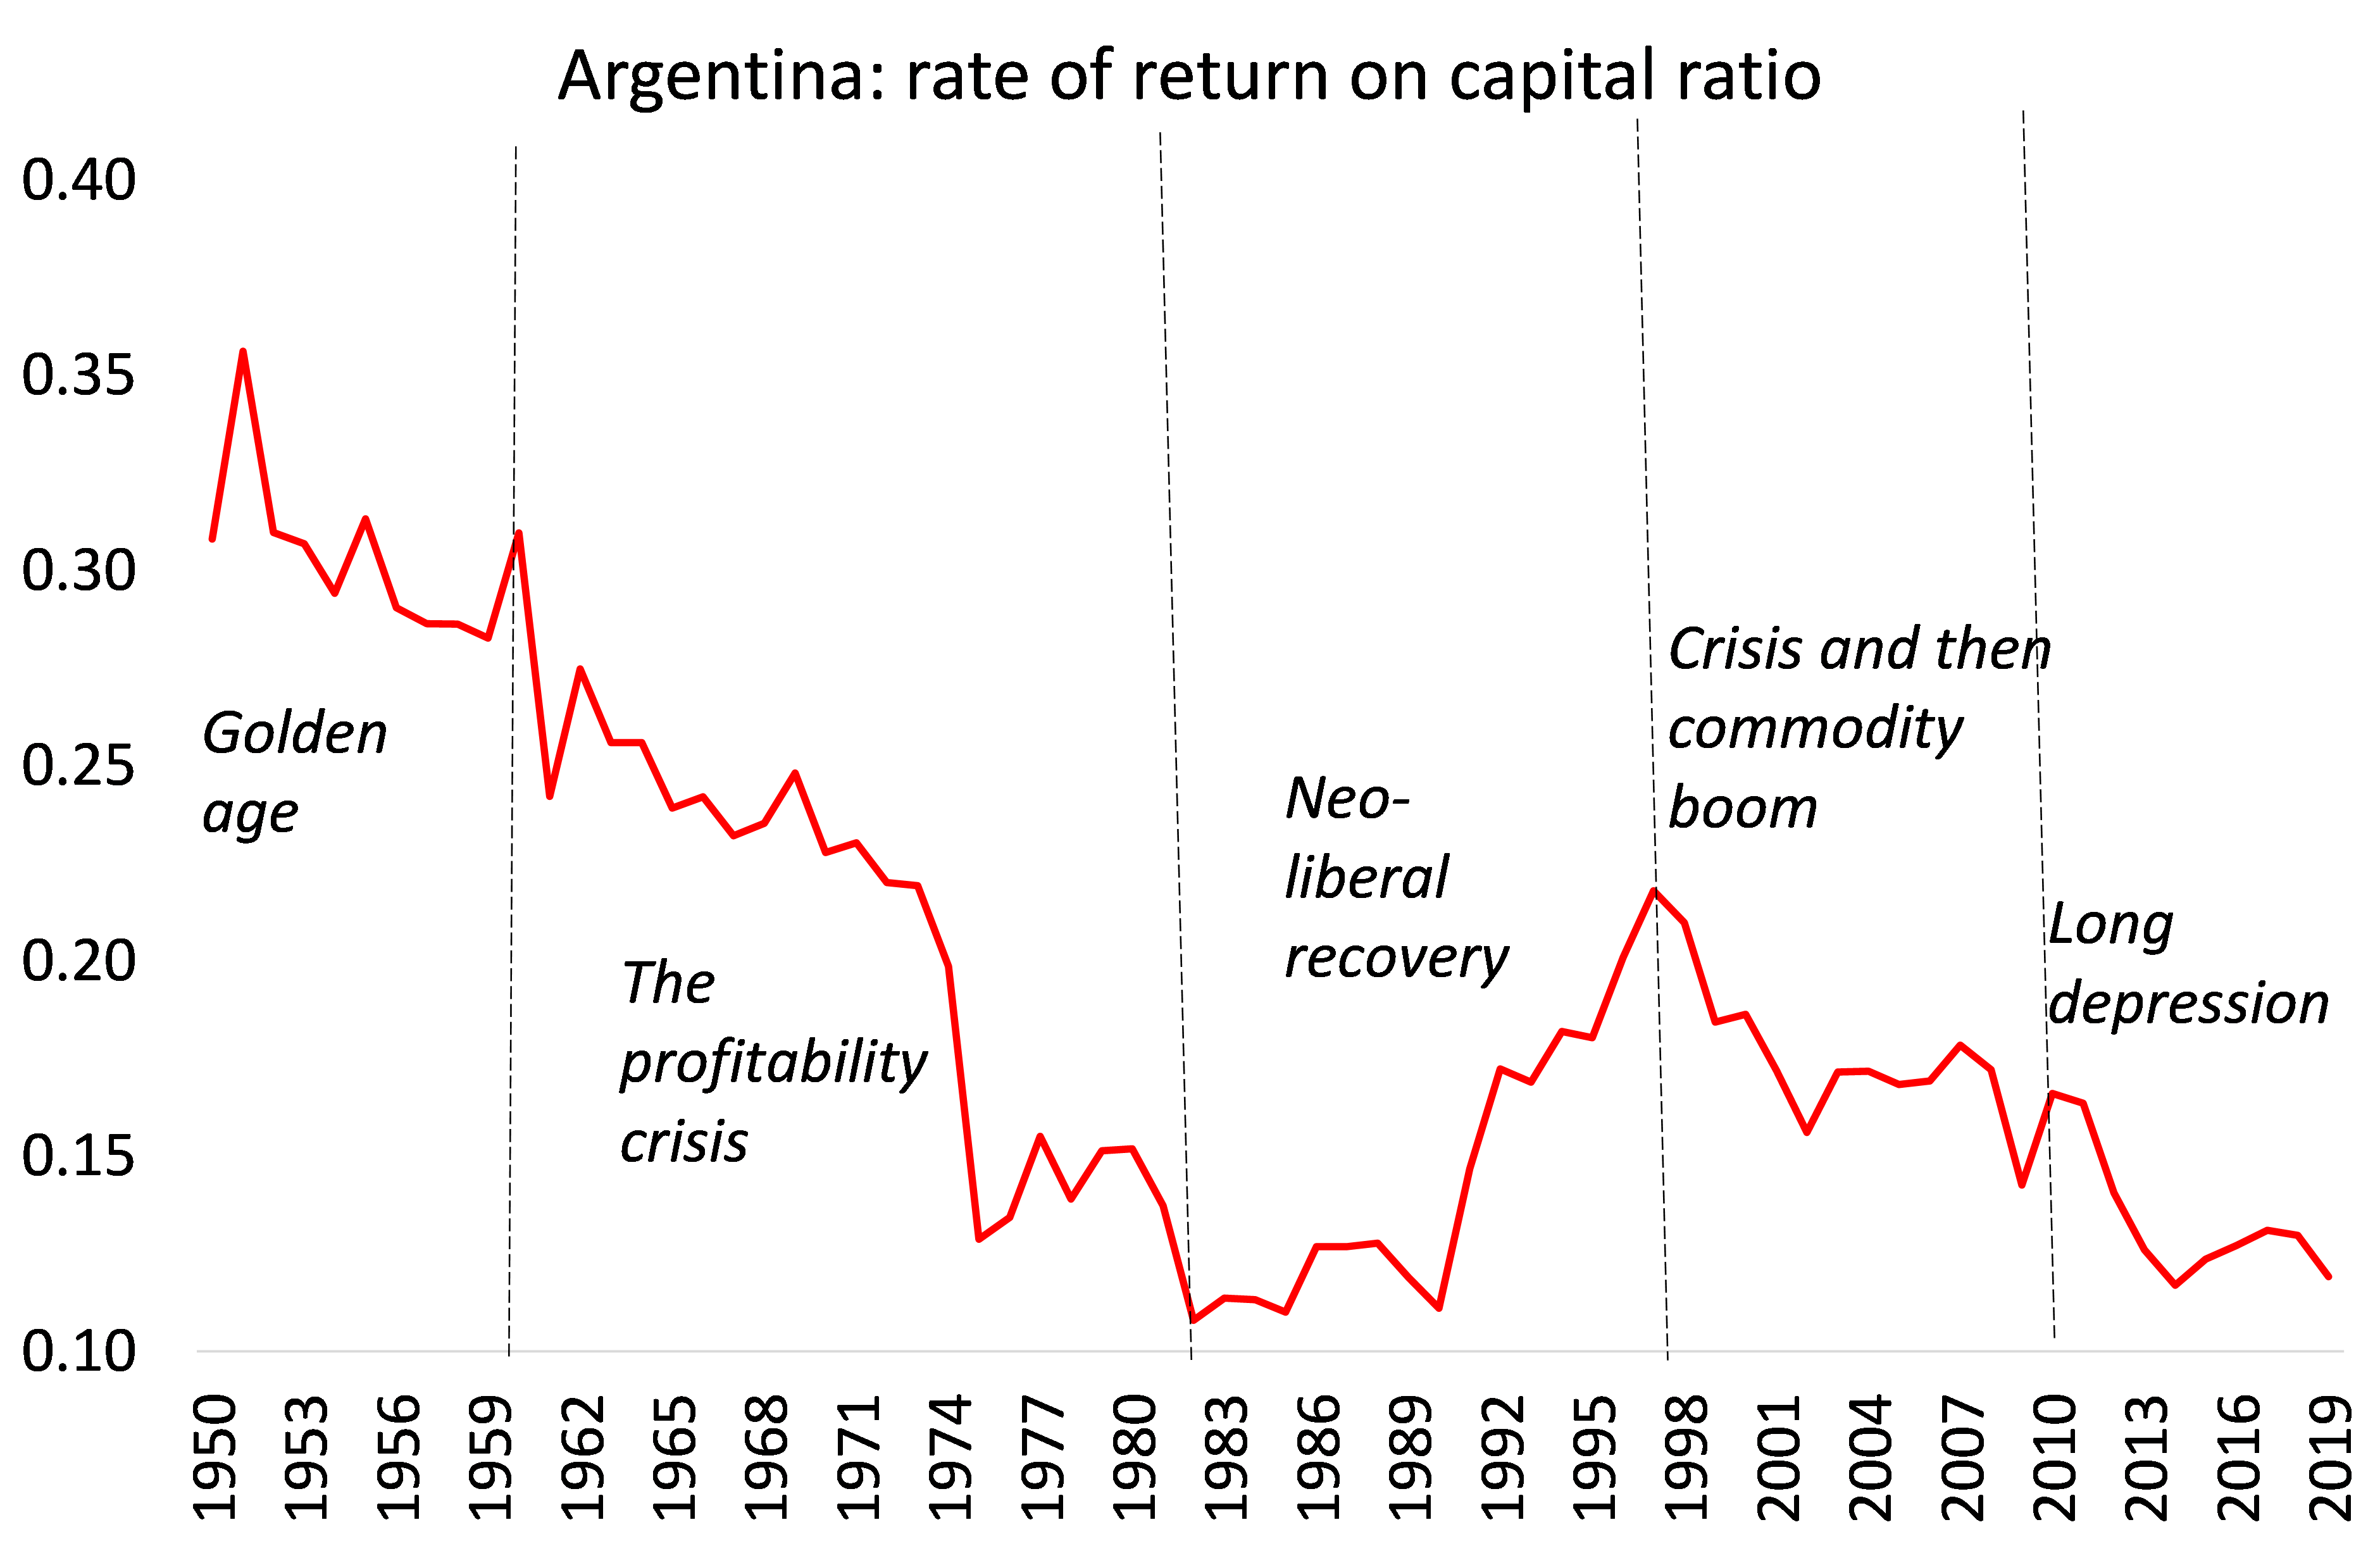
After the post-war golden age, Argentine capital suffered the same downward track in profitability from the 1960s to the early 1980s that all the major economies did. Then there was the neo-liberal recovery period, which ended with a major currency and debt crisis in 1999. That was briefly resolved by devaluation, debt default and slump. The commodity boom of the 2000s helped the economy along for a while, but when that ended in 2010, the fall in underlying profitability reasserted itself.
Mainstream economists see the solution in fiscal austerity, high interest rates, privatisation and ‘deregulated markets – traditional neo-liberal policies. They argue that without this, dollarisation would not work. So basically, they advocate a slump and a further reduction in real wages to boost profitability.
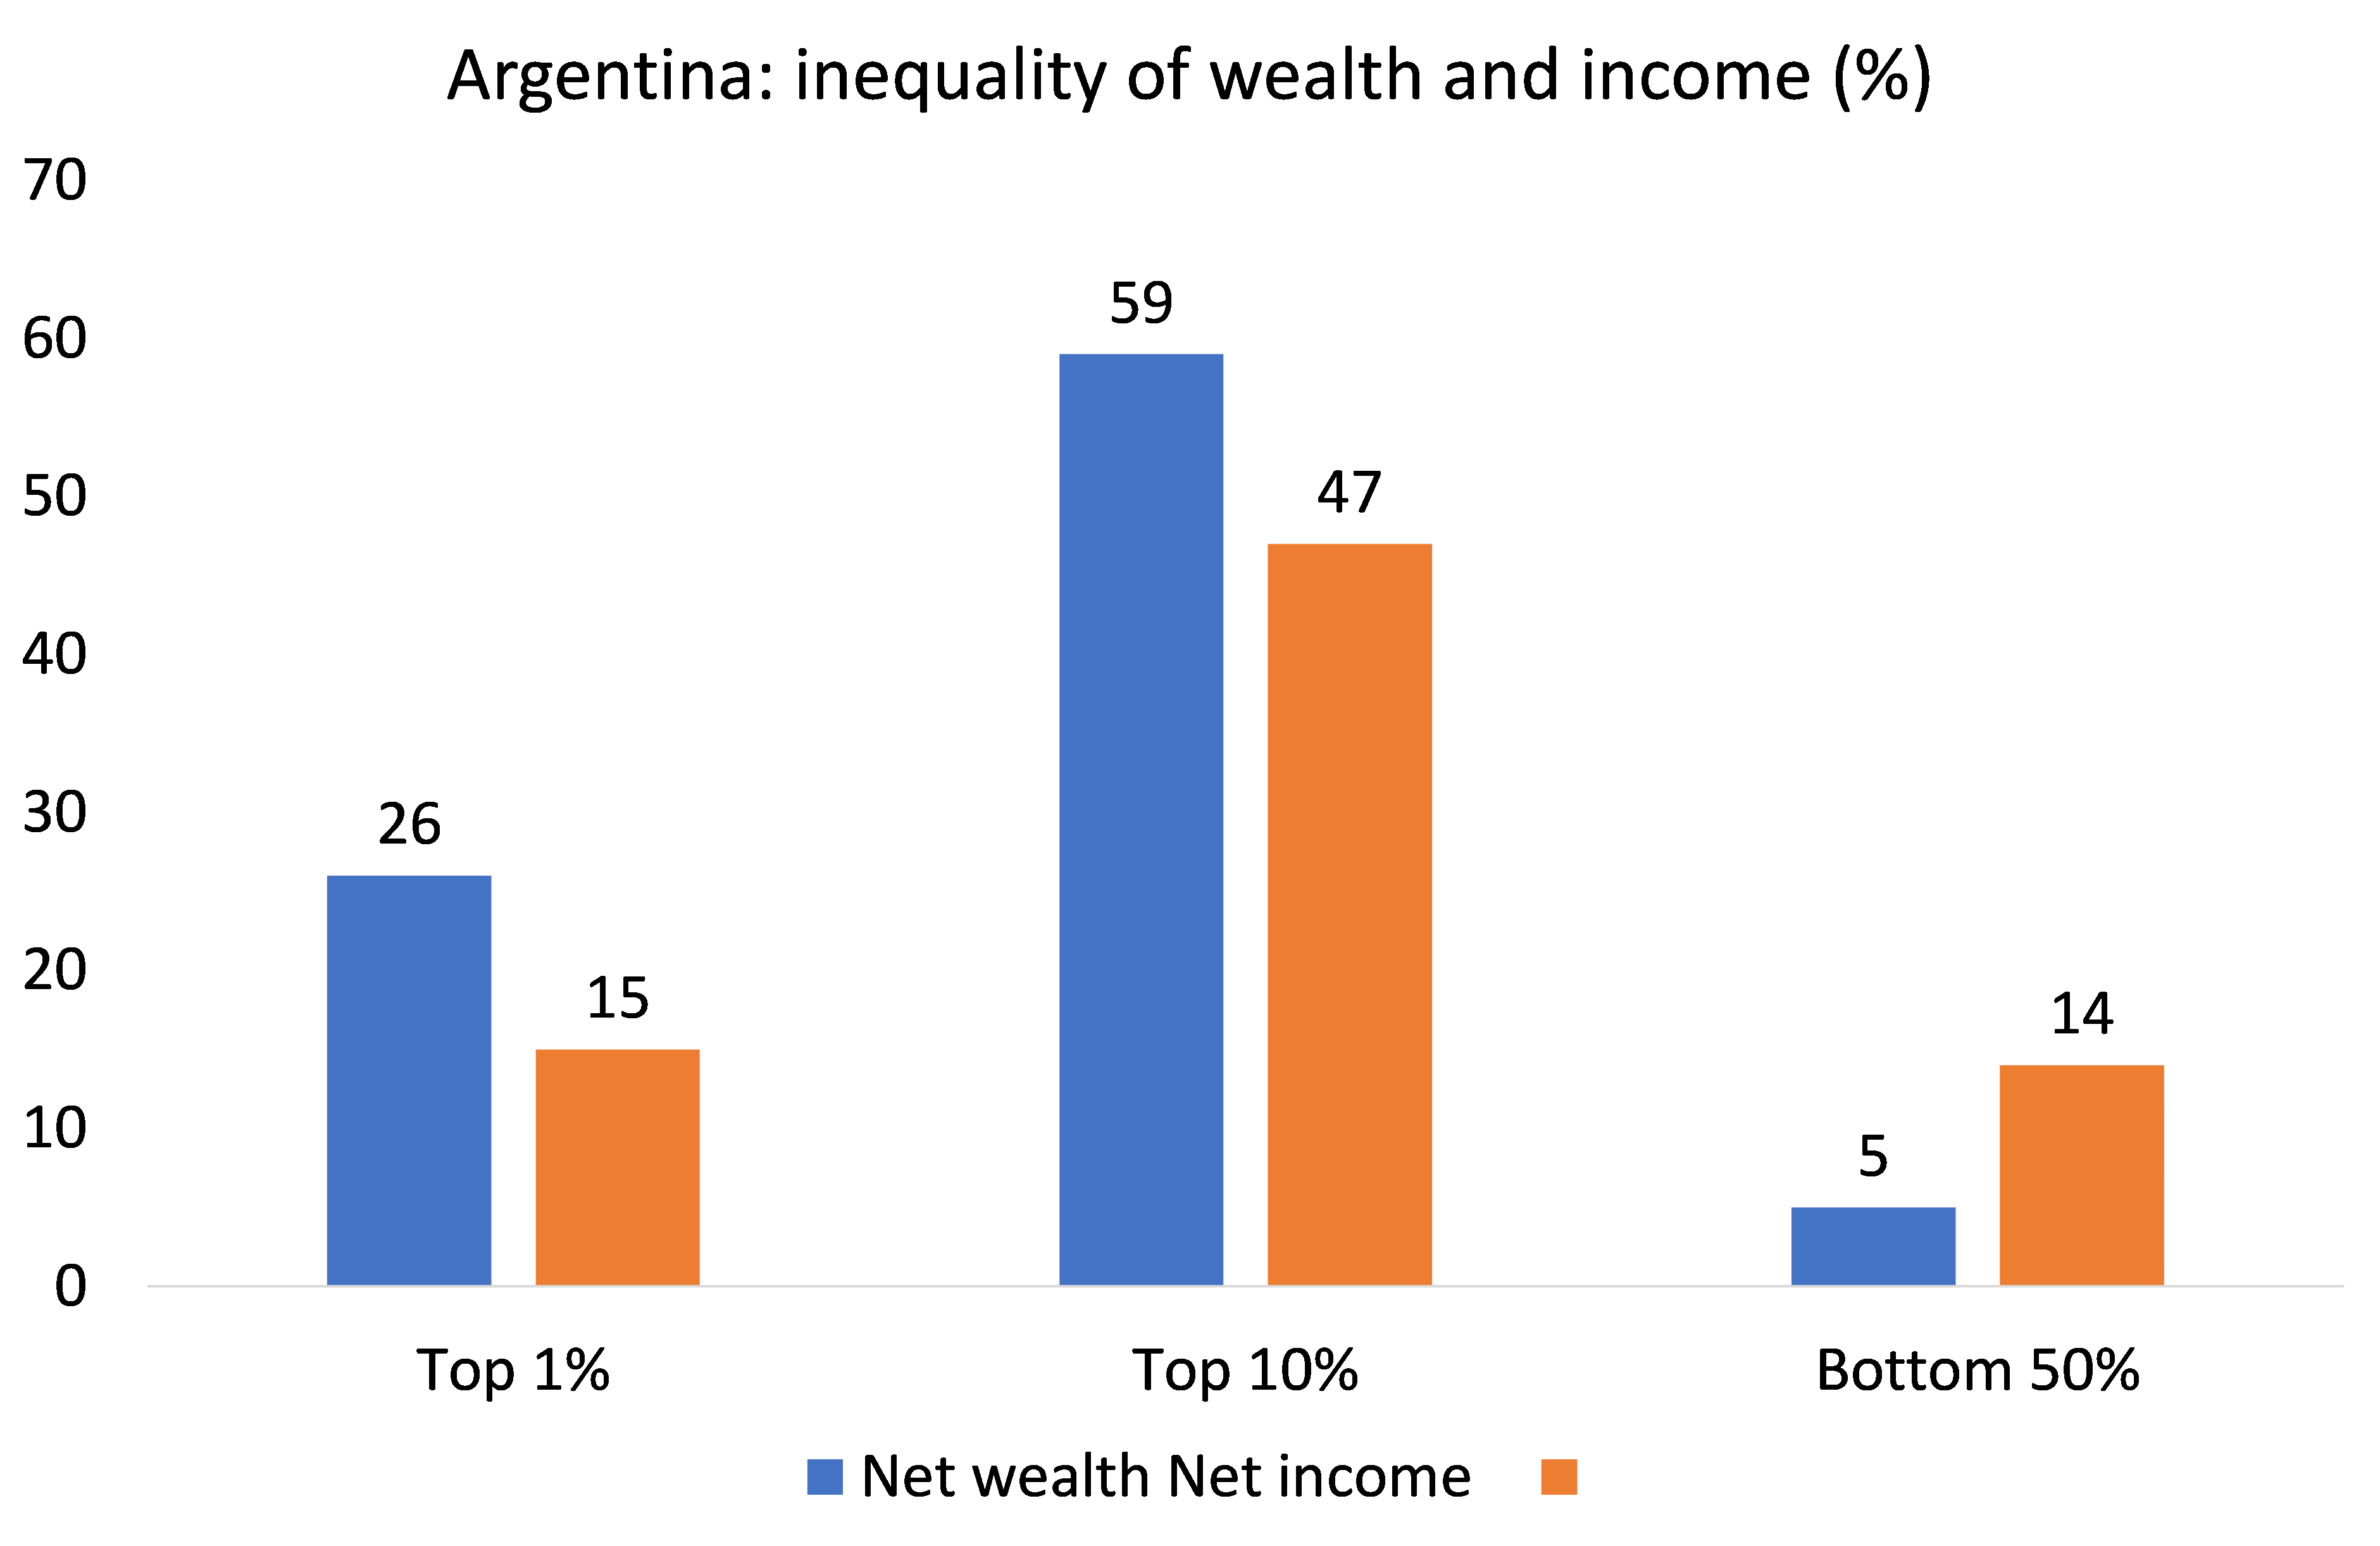
Peronism has failed to deliver on economic expansion, a stable currency and low inflation. But it has also failed to deliver on ending poverty and reducing inequality. Argentina’s official poverty rate rose to 40.1% in the first half of 2023. According to the World Inequality Database, the top 1% have 26% of net personal wealth, the top 10% have 59%, while the bottom 50% have just 5%. In incomes, the top 1% have 15%, the top 10%, 47% and the bottom 50%, just 14%.
Desperation has driven many Argentines to consider a ‘libertarian, anarcho-capitalist’ as president. If this were to happen, it will be going down another blind alley. Argentina’s capitalist economy will continue to fail.
October 18, 2023
Israel: the shattering of a dream
Last March, Israel marked its 75th anniversary as a state. The Economist journal commented “Today Israel is hugely rich, safer than it has been for most of its history, and democratic—if, that is, you are prepared to exclude the territories it occupies (sic!). It has overcome wars, droughts and poverty with few natural endowments other than human grit. It is an outlier in the Middle East, a hub of innovation and a winner from globalisation.” These words now seem like a sick joke given the events of the last few weeks, or for that matter if we look at the real history of the Israeli state.
That history is one of Jewish immigrants coming to Palestine with the broad aim of setting up a ‘safe-haven’ state for Jews in their ‘homeland’ alongside the existing Arab inhabitants. Many of these Zionists dreamt of Israel as becoming a model ‘socialist society’, communally owned and run through local communes or kibbutzim acting, as an democratic alternative to the rule of sheikhs and generals in the Arab states. The reality was that in practice Jewish immigrants settling in Palestine and establishing a new ‘socialist’ state could only do so by the removal of hundreds of thousands of Arabs from their homes and land through violence.
Nevertheless, through a combination of massive immigration (which doubled the Jewish population), huge inputs of foreign investment by rich Jewish communities and mainly American capital, plus the setting-up of a strong military force, Israel’s economy grew very fast from 1948. This was the ‘golden age’ of post-war capitalism, when profit rates were high and investment was equally strong. So it was possible to inaugurate a new economy very fast. GNP grew at an average annual rate of 10.4 percent between 1948-1972. The capital needed to build the Israeli economy came from US aid transfers and loans, German reparation payments and the sale of Israeli state bonds abroad. Profitability was kept high by controlling prices and wages, so keeping workers’ real incomes from rising too much.
But then, as in the rest of advanced capitalist economies, the profitability of capital in Israel fell sharply from about the mid-1960s to the early 1980s. This brought economic crises as part of the international slump of 1974-5 and 1980-2. It also brought a new war with the Arab states in 1973. At this point in the story of the Israeli economy, it is very useful to look at the profitability of Israeli capital from the 1960s, as provided by the World Profitability Database.

The graph clearly shows the sharp fall in profitability to a low in the global slump of 1980-2. Between 1973 and 1985, GNP growth declined to about 2 percent per year, with no real increase in per capita output. At the same time, the inflation rate spiralled out of control, reaching a high of 445 percent in 1984 and the balance of payments deficit with the rest of the world hit highs.
Israel’s so-called democratic socialist state had to go if Israel’s capitalists were to prosper. And so, as in many other capitalist economies, Israelis now elected governments that aimed to end ‘socialism’ and open up the economy to capital without restrictions, while at the same time reducing Israel’s ‘welfare’ state and support for collectives like the kibbutz. Israel entered the neo-liberal era which lasted globally for the next two to three decades with a vengeance.
In 1983, the Tel Aviv Stock Exchange collapsed, bursting a huge financial bubble that had been growing for years. The right-wing Likud government blamed the banks. It took over Bank Hapoalim which had direct and indirect control over some 770 companies and controlled some 35 percent of the Israeli economy with the aim to privatise all these state assets. The state eventually sold the three major banks: Bank Hapoalim, Bank Leumi, and Bank Discount to private capitalists. The telecommunications industry and the ports were privatised.
In a carbon copy policy of Reagan in the US and Thatcher in the UK, between 1986-2000, 83 government owned companies were sold for a total of $8.7 billion US dollars. The national airline ELAL, the telecommunications network Bezeq, all the major banks and the other big five conglomerates were all sold off to buyers selected by the government. The buyers included many of Israel’s wealthiest, combined with moneyed American Jewry, and other foreign conglomerates. None of these companies were privately listed for sale. For example, the government sold Israel Chemicals Ltd. to the Eisenberg family through a private bidding process that was carried out between 1993 and 1997.
For a while these measures did help to get the profitability of Israeli capital up – in our profitability graph, there was a doubling of the rate of profit from 1982 to 2000. But the rise in profitability was mainly driven by a new influx of immigrants after the collapse of the Soviet Union and from North Africa. Immigration cheapened labour costs, while a period of seeming ‘truce’ with the Arabs ensued after the Oslo accords enabling even greater inflows of foreign investment.

This was the period of the expansion of ‘start-up hi-tech’ firms that Israel has become noted for and of the apparent integration of the Israeli economy into a a fast-globalising world economy. Nicknamed the “Start‑Up Nation”, Israel now has more than 7,000 active start‑up companies.
But this did not last. In the 21st century, Israel’s capitalist economy increasingly struggled like many other ‘emerging economies’. The big difference, of course, is that in its perpetual war with its neighbouring Arab states, Israel has been backed to the hilt by the US and Western capital. So even facing permanent conflict with its Arab neighbours and uprisings by the displaced Palestinians, it has been able to survive economically and also develop a formidable military force.
Ironically, massive immigration from the former Soviet Union, the importation of foreign workers and the rapid natural growth of the local Arab population, has made Israel less and less of a ‘Jewish state’ in population terms and still relatively small at just under 10m. But the impact of neoliberal policies and economic slowdown has not led to a shift to the left. The fear of Arab attacks and the failure of any effective alternative socialist opposition have instead led to the rise of religious and ethnic political parties. The race and religious cards have been played by Israeli capital to avoid any confrontation over its economic and social failures.
Economic crises have continued at regular intervals in the 21st century. In 2003, Netanyahu cut welfare benefits, privatised more state-owned corporations, reduced the top income tax rate, slashed public sector services and imposed anti-trade union laws. The Great Recession of 2008-9 followed and then the pandemic slump of 2020, when GDP fell 7%. The relative economic decline of the Israeli economy is revealed by the real GDP growth rate in the Golden Age, the profitability crisis of the 1970s, the neoliberal period and now in the Long Depression of the 2010s onwards.

In the past ten years the collective Kibbutzim have rapidly disappeared to be replaced by high-end suburban housing. Land values have skyrocketed with real estate speculation. There has been continual erosion in funding for health and other public services which has led to a rise in the private cost of health and adds to growing gaps in the access to services between those who have money and those who don’t.
The ‘socialist dream’ of the early Israeli state has now given way to the capitalist reality. The gap between the lowest and highest earners in Israel is the second highest in the industrialized world, and the child poverty rate is second only to Mexico among developed countries. An average of one in three Israeli children are living in poverty, with one in five families subsisting well below the poverty line.
Israel is one of the most unequal high-income countries. The bottom 50% of the population earn on average NIS 57,900, while the top 10% earn 19 times more. Thus, inequality levels are similar to those in the US, with the bottom 50% of the population earning 13% of total national income, while the top 10% share is 49%

Of course, poverty and the inequality gap is much greater for the Arab citizens of Israel who represent around 20% of Israel’s population. But poverty rates are also high in orthodox Jewish communities, which represent one-tenth of the population. As for Gaza and the West bank, poverty levels are horrendous.

In stark contrast, the concentration of wealth in Israel is the second highest in the western world. The notorious family fiefdoms include: Arison, Borovich, Danker, Ofer, Bino, Hamburger, Wiessman, Wertheim, Zisapel, Leviev, Federman, Saban, Fishman, Shachar, Kass, Strauss, Shmeltzer, and Tshuva. These families collectively control a fifth of the revenue generated from Israel’s leading companies and these top 500 companies account for 40% of the business sector and 59% of national revenue.
This latest war will not bring down the Israeli economy. The government is backed by military and financial support from the US.

Continual war may benefit the arms manufacturers and the military, but over the long term it lowers profitability and investment in the productive sectors of the economy. And for workers, apart from the horrible loss of life and limb, it means a straitjacket on improved prosperity and human development.
Israel’s capitalist governments have no solution to the interminable conflict with the Arab people under its occupation and next to its borders. Now with an outbreak of yet another war at a grotesquely intensified level of violence and retribution, the sweet words of the Economist on Israel’s 75th anniversary taste very sour – for both Palestinians and Israelis.
Is this to continue for another 75 years?
October 14, 2023
Poles apart
Poland has a general election on Sunday and this one seems pivotal for unity in the European Union, both on economic policy and on the EU leadership’s unquestioning support for Ukraine. Poland has 40m people, making it the most populated country in eastern Europe. And its influence in EU policy and actions has increased.
The governing Law and Justice Party coalition has been a thorn in the side of the EU Commission and leaders. The government has blocked EU attempts to spread the burden of refugees across EU member states and it has changed its judiciary system to ensure government policies are not hindered by the ‘rule of law’, restricting press freedom. And more recently, the government has suggested ending the sending of arms and funding support for Ukraine, because Ukraine’s grain exports are damaging Poland’s own large farming sector.
The opposition Civic Coalition is led by former PM and EU President Donald Tusk. In contrast, this coalition stands fully in line with EU policy economically and on Ukraine; and it also seeks to reverse the strangling of the judicial system imposed by the government.
The latest polls suggest that Law and Justice will win the most seats but possibly not enough to form another government. L&J will probably win because it has gained support over the years from its social welfare measures and from the more rural and religious communities. The CC opposition is very much a neo-liberal party in economic and social policy, favouring fiscal austerity, ‘free markets, deregulation and a pro-EU stance (which is no longer so popular). That’s part of the reason that the L&J has stayed in office for over eight years.
During that period there has also been a dramatic improvement in the Polish capitalist economy. When the Soviet bloc collapsed and Poland’s returned to capitalism, there was a 13 to 1 gap between Poland’s national income per person and that of the united Germany.

In just over a generation since, Poland’s economy grew at about 4% a year in real terms. This was driven by a huge inflow of foreign capital, mainly from Germany, to take advantage of cheap Polish labour. At the same time, millions of able-bodied Poles went abroad to find work and return hard currency to their families. Some 2.5 million Poles, 7% of the population, lived and worked abroad, sending home remittances of USD 7.5 billion, or 1.7% of GDP each year.
Poland’s domestic labour force became a huge assembly line for German manufacturing products. The export of these commodities enabled German capital to gain large profits, while the profitability of Polish capital rocketed.

This was made possible by what Marxist economic theory calls uneven and combined development. The latest technology was employed by foreign (and to a lesser extent Polish) capital alongside cheap labour. In the mid 2010s, car factories in Germany paid workers €3,122 a month, almost four times as much as their Polish, Czech, Slovak or Hungarian colleagues, who made €835 for similar work. The productivity of labour rose strongly.

but the share of that new value going to labour fell to the second lowest in the EU..

And so the profitability of Polish capital rose, also helping to counteract any decline in the profitability of German capital.
In addition, once in the EU, Poland received 2.7% of GDP in EU transfers annually and sent 4.7% of GDP in profits to Western investors. Fully 28% of Poland’s exports go to Germany. Less than 6% of German exports go to Poland.
Poland’s economy remains dominated by foreign capital. In Poland’s 14 Special Economic Zones (SSE) only 19.6% of entities are Polish investors; and there is total tax exemption for enterprises operating in SSEs so that the effective tax rate of foreign enterprises was 1.2 percentage point lower than that of domestic companies.
Foreigners dominate large-scale modern industry and services. The exports they send out are mostly mid-tech. The foreign owners benefit from value added generated in Poland. Polish small and medium-sized enterprises and mid-caps often struggle. Poland qualified for a mere 1% of the €80bn disbursed by the EU under its last programme for R&D.
So, within a single generation, Poland’s economy has expanded significantly, but at the same time it has gone from being one of the most egalitarian countries in Europe to one of the most unequal, at a level not seen since the years of domination by the Austro-Hungarian empire before 1914.

Research by Polish economists Michal Brzezinski, Michal Myck and Mateusz Najsztub, in their paper ‘Sharing the gains of transition’, indicates that Poland has one of the highest rates of inequality in the EU and also that the gap is widening. They find that the highest-income earners benefited most during the post-communist transformation: The annual rate of income growth for the top 5% of the population exceeded 3.5%, while the median income grew on average by about 2.5% per year. “According to our adjusted estimates, the cumulative growth in real income over 1994-2015 for the top 1% of Poles reached 122%-167%, while for the bottom 10% the corresponding number is at most 57%,”.

Some 20% of the population (7.3 million people) are still living in official poverty, while Gini coefficient of inequality (where 1 means all personal income goes to one person) which was at 0.27 in 1990 under Communist Poland has now jumped to 0.45, well above the EU average.
So the price of economic growth and increased incomes has been domination by foreign capital, with millions having to work abroad and leading to sharply increased inequality, so that only a minority have benefited from Poland’s ‘boom’.
And now things do not look so rosy ahead, as Poland goes into the 2020s. The previously available cheap labour force has been exhausted. Poland’s population is ageing. Yes, the workforce has been augmented by an influx of refugees from Ukraine, some 1 million, but more than half these are women, elderly and children, not available on the whole to be used by Poland’s industries. And many of these immigrants want to return to Ukraine after the war is over (if it is ever is).
At the same time, the previously large agricultural sector is in sharp decline both in contribution to GDP and employment. As it declines, so do EU subsidies through the Common Agricultural Policy and those transfers have provided half of annual real GDP growth up to now.
Much depends now on Poland getting its share of Next Generation EU (NGEU) funds which could increase real GDP growth by 1% pt a year over the rest of this decade. But the EU is blocking the release of these funds for investment because the current government has interfered with the ‘rule of law’ over judiciary and free speech.
The bounce-back from the pandemic slump has now faded. This year, the economy is likely to contract by around 0.5% in real GDP. And from then on, real GDP growth is expected to be well below the pre-pandemic average. At the same time, the post-pandemic inflationary spiral has driven down real wages in Poland for the first time since the 1990s. Inflation is currently at 8% a year and is expected to slow to only 6% next year, well above the official target rate of 2.5%. Industrial output is falling and exports are being dampened by the recession in Poland’s dominant neighbour, Germany.
Manufacturing activity index (below 50 means contraction)

Frictions between Poland and Germany on the one hand and Poland and Ukraine on the other are likely to intensify, given the economic downturn and the response to that by the nationalist government, if it is returned to power. The Polish electorate is divided between the towns and country; between the working class and neoliberal professional and business classes; and between supporting EU policy and opposing it. Sign of the times in Europe.
October 8, 2023
Polycrisis again
At the beginning of this year, I wrote a post on how the capitalist mode of production was in what some call a ‘polycrisis’, where various crises: economic (inflation and slump); environmental (climate and pandemic); and geopolitical (war and international divisions) had come together in the early 21st century. Polycrisis, the new buzzword among leftists, is in many ways similar to my own description of the contradictions of the Long Depression of the 2010s that have to come to a head in the 2020s.
Now, as the main international economic agencies, the IMF and the World Bank, meet in Marrakech this week, it is worth updating what is happening to these strands or contradictions that make up the polycrisis of capitalism.
Let’s start with the climate and global warming. Global temperatures soared to a new record in September by a huge margin. Scientists at the Copernicus Climate Change Service said 2023 was on course to be the hottest on record, after the average global temperature in September was 1.75C degrees warmer than the pre-industrial period of 1850-1900, before human-induced climate change began to take effect.

The hottest September on record follows the hottest August and hottest July, with the latter being the hottest month ever recorded. September 2023 beat the previous record for that month by 0.5C, the largest jump in temperature ever seen. This record heat is the result of the continuing high levels of carbon dioxide emissions combined with a rapid flip of the planet’s biggest natural climate phenomenon, El Niño. And this “extreme month” has likely pushed 2023 into the “dubious honour of first place” as the hottest year ever, with temperatures about 1.4C above pre-industrial average temperatures.
The world is way off track to tackle climate change and remains headed for a temperature rise of up to 2.6C and must take urgent action, said UNCTAD in its latest report on the global economy. UNCTAD said countries needed to be “more ambitious in action” and set “more ambitious targets” in order to cut emissions by the required 43 per cent by 2030 and by 60 per cent by 2035 compared with 2019 levels, in order to avert the dire consequences of a warmer planet. This would require a “radical” transformation of systems across all sectors, including boosting renewable energy, ending the use of all fossil fuels without the emissions captured, cutting methane and other greenhouse gases, ending deforestation and improving energy efficiency.
None of this is happening to any degree necessary. The International Energy Agency (IEA) says fossil fuel demand must fall by more than 25% by 2030 and 80% in 2050. And by 2035, emissions need to decline by 80% in advanced economies and 60% in emerging market and developing economies compared to the 2022 level. But current Nationally Determined Contributions are not in line with countries’ own net zero emissions pledges, and those pledges are not sufficient to put the world on a pathway to net zero emissions by 2050. The “emissions gap” consistent with limiting warming to 1.5C in 2030 was as much as 24bn tonnes higher than it needs to be.

Global finance for climate action reached about $803bn annually for 2019-20, less than a fifth of the estimated $4tn annual investment in clean energy technology needed to limit temperature rises to 2C or 1.5C. Meanwhile global fossil fuel subsidies have hit record high of $7tn in 2022, the IMF estimates. The IMF study said subsidies for coal, oil and natural gas in 2022 were equivalent to 7.1 per cent of global GDP. This represented more than governments spent on education, and two-thirds of what was spent on healthcare.
At the recent G20 meeting, one of key policy actions necessary to save the planet; namely the end of fossil fuel production, was ignored. “To have any chance of meeting the Paris Agreement’s 1.5°C temperature limitation goal, sharp reductions in the production and use of all fossil fuels . . . are essential, and on that issue, the G20 leaders are missing in action,” Alden Meyer, senior associate at E3G, the climate consultancy, said. Behind that failure lies the huge and grotesque profits made by the oil and gas giants in the post-pandemic inflation period. Their ‘reluctance’ to ‘strand’ their stock of assets (ie not use them or explore for more) is no surprise.
What policy answers have been offered by companies and governments to end global warming? First, we have the ludicrous ‘carbon offsets’ schemes. Many of the largest companies in the world have used ‘carbon credits’ for their sustainability efforts from the unregulated voluntary market, which grew to $2bn (£1.6bn) in size in 2021 and saw prices for many carbon credits rise above $20 per offset. The credits are often generated on the basis they are contributing to climate change mitigation such as stopping tropical deforestation, tree planting and creating renewable energy projects in developing countries. Investigations show that more than 90% of their rainforest offset credits – among the most commonly used by companies – are likely to be “phantom credits” and do not represent genuine carbon reductions.
Then there are carbon taxes and prices. This market solution to deter the use of fossil fuels is the main plank of the IMF to solve global warmings. Carbon pricing schemes just hide the reality that, as long as the fossil fuel industry and the other big multinational emitters of greenhouse gases are untouched and not brought into a plan for phasing them out, the tipping point for irreversible global warming will be passed. Instead of waiting for the market to speak, and for ‘regulation’, we need a global plan where fossil fuel industries, financial institutions and major emitting sectors are brought under public ownership and control.
There are two months to go until countries meet in Dubai at the UN COP28 climate summit. Given that this international climate conference is being hosted by a leading oil and gas producer, don’t expect any radical action on fossil fuels.
Then there is poverty and inequality. At this week’s meeting, the World Bank will present a new report on poverty. According to the World Bank, global poverty has now receded to levels closer to those prior to the pandemic, but this still means that we have lost three years in the fight against poverty. The recovery is also uneven: while extreme poverty in middle-income countries has decreased, poverty in the poorest countries and countries affected by fragility, conflict or violence is still worse than before the pandemic.
After much criticism of its ludicrously low threshold for poverty globally, the Bank now offers three levels. In 2023, 691 million people (or 8.6% of the global population) are projected to live in ‘extreme poverty’ (i.e., those living below $2.15/day), which is just below the level prior to the start of the pandemic. At the $3.65/day line, the poverty rate and the number of poor are both lower than in 2019. At the more realistic (but still very low) $6.85/day level, a smaller share of the global population also now lives below that compared to before the pandemic. But due to population growth, the total number of poor living below this line is still higher than before the pandemic. And when we look at the poorest countries, they still have higher poverty rates than before and are not ‘closing the gap’.
These poverty rates are misleading, as I have shown here. Nearly all the recorded reduction in global poverty (whatever the level used) in the last 30 years is due to China taking around 900m Chinese above those levels. Exclude China and global poverty has hardly fallen either in share or numbers. Indeed, even including China, there are still 3.65bn people on the planet below the $6.85/day poverty line, according to the World Bank.
In 2021, Lloyd’s Register Foundation partnered with Gallup and polled 125,000 people from 121 countries, asking how long people could cover their basic needs without income. The study found that a staggering 2.7 billion people could only cover their basic needs for a month or less without income, and of that number, 946 million could survive for a week at most. The UN target to end ‘poverty’ by 2030 is a mirage.
Global hunger is still far above pre-pandemic levels. It is estimated that between 690 and 783 million people in the world faced hunger in 2022. This is 122 million more people than before the COVID-19 pandemic. It is projected that almost 600 million people will be chronically undernourished in 2030. So the UN target of zero hunger by then is way off track. More than 3.1 billion people in the world – or 42 percent – were unable to afford a healthy diet. Worldwide in 2022, an estimated 148.1 million children under five years of age (22.3 percent) were stunted, 45 million (6.8 percent) were wasted, and 37 million (5.6 percent) were overweight.
Of a total of 2.4 billion people in the world facing ‘food insecurity’ in 2022, nearly half (1.1 billion) were in Asia; 37 percent (868 million) were in Africa; 10.5 percent (248 million) lived in Latin America and the Caribbean; and around 4 percent (90 million) were in Northern America and Europe. One billion Indians cannot afford to eat a healthy diet. That’s 74% of the population. India does slightly better than Pakistan, but is behind Sri Lanka. The corresponding number for China is 11%.
And then there is inequality of wealth and incomes. The latest Credit Suisse report on global personal wealth showed that show that in 2022, 1% of adults (59m) owned 44.5% of all personal wealth in the world, slightly higher than before the pandemic in 2019. At the other end of the wealth pyramid, the bottom 52.5% of the world’ population (2.8bn) had net wealth of just 1.2%.

As for wealth inequality within countries, the Gini coefficient (the usual measure of inequality) for wealth was a huge 85.0 in the United States (remember 100 would mean one adult owning all the wealth). Indeed, in the United States, all measures of inequality have trended upward since the early 2000s. For instance, the wealth share of the top 1% of adults rose from 32.9% in 2000 to 35.1% in 2021 in the United States.
UNCTAD reports that “During the period of heightened price volatility since 2020, certain major food trading companies have earned record profits in the financial markets, even as food prices have soared globally and millions of people faced a cost-of-living crisis.”

Indeed, the pandemic and the subsequent inflation surge have left their mark on the incomes of the average household. Take the UK: never in living memory have working families got so poor, according to the think-tank, the Resolution Foundation. “This parliamentary term is on track to be by far the worst for living standards since the 1950s. Typical working age household incomes are on course to be 4% lower in 2024-25 than they were in 2019-20. Never in living memory have families got so much poorer over a parliament.”

Nobel (Riksbank) prize winner in economics (2015), Angus Deaton has a new book out, called Economics in America: An Immigrant Economist Explores the Land of Inequality In it, he attacks the failure of neoclassical economics to address in any way the issues of poverty and inequality. Mainstream economists in the US deliberately ignore rising levels of inequality and the horrendous impact of poverty, claiming that this is not the business of economics. And yet “real wages have stagnated since 1980 while productivity has more than doubled and the rich cream off the profits. The top 10% of US families now own 76% of wealth. The bottom 50% own just 1%.” A class system now operates and “the war on poverty has become a war on the poor”.
Deaton points out that more equality will not be achieved simply by tax transfers and welfare payments – they will hardly make a dent. The answer for him is state spending and investment in education and jobs for all. Deaton opposed more radical policies: “We do not need to abolish capitalism or selectively nationalize the means of production. But we do need to put the power of competition back in the service of the middle and working classes. There are terrible risks ahead if we continue to run an economy that is organized to let a minority prey on the majority.” But is not a tiny minority preying on the majority the very essence of class societies and modern capitalism? In my view, Deaton’s policy solution is just as utopian as taxation, as it does not address the control and ownership by capital of the means of production and employment of labour that ensures that a tiny minority have the vast bulk of wealth and income while society as a whole does not have enough to meet even basic needs.
The pandemic and subsequent rise in inflation and interest rates globally has exposed many of the poorest countries in the world to debt default. They owe billions to creditors, both public and private, in the so-called Global North. This they can only pay back by cutting services and any spending to meet the needs of their citizens – and increasingly they are unable to pay at all.
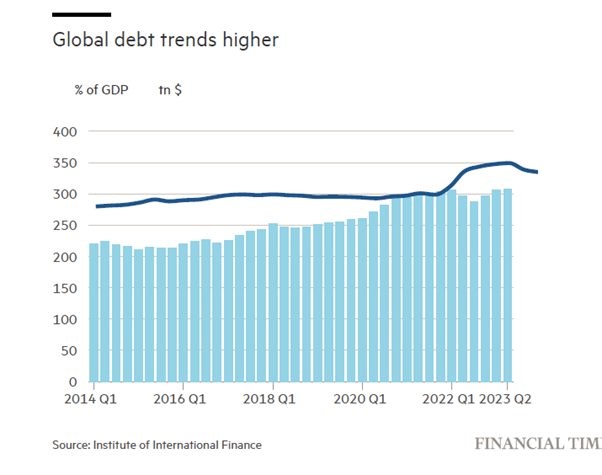
Global debt has hit a new high according to the International Institute of Finance (IIF). Total debt — spanning sovereigns, corporates and households — rose by $10tn to about $307tn in the six months to June, or 336% of world GDP. The World Bank estimates that 60 per cent of low-income countries are heavily indebted and at high risk of debt distress, while many middle-income countries also face significant budgetary challenges.
Central bank hikes have therefore also sharply driven up the costs of borrowing, which from the IMF can currently be up to 8 per cent. The burden of paying high interest rates to the IMF is worsening. “If the IMF’s worst-case scenario of deteriorating global economic conditions materialises, demand for IMF support will surge even more.” So an IMF debt trap! The IMF at this week’s meeting will warn that governments “should take urgent steps to help reduce debt vulnerabilities and reverse long-term debt trends”. But how? There are no proposals by the rich countries to write off these debts; or end the trade tariff and constraints on emerging market exports; or of course, stop the huge extraction of profits from the resource-rich, poor countries by multi-national companies.
Global warming; unending global poverty and inequality; debt disaster: all these strands in the ‘polycrisis’ of capitalism in the 21st century are connected through the burgeoning economic crisis.
Global trade is falling at its fastest since the pandemic. Trade volumes were down 3.2 per cent in July compared with the same month last year, the steepest drop since the early months of the coronavirus pandemic in August 2020, according to CPB. The about-turn in export volumes is broad based, with most of the world reporting falling trade volumes. China, the world’s largest goods exporter, posted a 1.5 per cent annual fall, the Eurozone a 2.5 per cent contraction, and the US a 0.6 per cent decrease. The CPB also reported that global industrial production fell 0.1 per cent compared with the previous month, driven by sharp falls in output in Japan, the eurozone and the UK – and is also down year on year.
The World Bank has just issued a report prior to this week’s meeting in which it reckons that Asia faces one of worst economic outlooks in half a century. The previously called ‘Asian tigers’ of Korea, Taiwan, Singapore, Hong Kong etc are set to expand at one of the lowest rates in five decades, as US protectionism and rising levels of debt pose an economic drag. The World Bank forecast that China’s growth would slow to 4.4 per cent in 2024, the lowest rate in decades, although still more than double the rate of any G7 economy. The worsening forecasts also reflect that much of the region is starting to be hit by new US industrial and trade policies under the Inflation Reduction Act and the Chips and Science Act.
The latest UNCTAD report on the world economy reckons that the world economy has stalled and the risks over the coming year are rising. UNCTAD forecasts that “stuttering growth for the period 2022-24 will fall short of the pre-Covid rate in most regions of the world economy. Debt burdens are crushing too many developing countries. Debt service on external public debt relative to government revenues surged from nearly 6% to 16% between 2010 and 2021.”
There is much optimism in the US that the economy will achieve a ‘soft landing’ i.e the inflation rate will soon fall back to the target rate of 2% a year without real GDP contracting into a recession. I have discussed the likelihood of that in a previous post. Even if that turns out to be the case, a ‘soft landing’ does not apply to the rest of the major advanced capitalist economies. The Eurozone area is contracting; as are Canada, the UK and several smaller economies like Sweden, while Japan is on the cusp.
Indeed, the Organisation for Economic Co-operation and Development (OECD), in its latest report, forecasts global growth in 2024 will be lower than in 2023 falling from 3% this year to 2.7% in 2024. Despite the global economy proving “more resilient than expected” in the first six months of 2023, the growth outlook “remains weak”. Real GDP growth in the advanced capitalist economies will slow from 1.5% this year to just 1.2% in 2024 and GDP per capita will be close to contraction.
The OECD economists reckon inflation will not return to pre-pandemic levels any time soon, so central banks must keep interest rates high. Indeed, the IMF also calls for central banks to keep up the misery of debt burdens in the ‘war against inflation’. Yet, as I have argued, because higher inflation was a ‘supply-side’ problem, central bank money tightening does little to reduce inflation and is only a recipe for ‘slumpflation’.
And there are two other strands in the polycrisis of the 21st century that still have to unfold. There is the weakening of US dominance in world affairs. ‘Globalisation’ of trade and finance over the last 40 years under the hegemony of the US is over.

US capital’s ability to expand the productive resources and to sustain profitability has been declining. This explains its intensified effort to strangle and contain China’s rising economic strength and so maintain its hegemony in the world economic order. A recent study by Sergio Camera showed “a prolonged stagnation” of the US rate of profit in the 21st century. The general rate of profit was 19.3% in the ‘golden age’ of US supremacy in the 1950s and 1960s; but then fell to an average 15.4% in the 1970s; the neoliberal recovery (coinciding with a new globalisation wave), pushed that rate back up to 16.2% in the 1990s. But in the two decades of this century the average rate dropped to just 14.3% – an historic low.
That has led to lower investment and productivity growth in the decade of what I have called the Long Depression of the 2010s, so that, to use Sergio’s words, the US “economic base has been seriously debilitated”. This is weakening the hegemonic position of US capitalism in the world. Now there is what is described as ‘geopolitical fragmentation’ ie the rise of alternative blocs attempting to break with the imperialist bloc led by the US. The Russian invasion of Ukraine highlights this ‘fragmentation’.
What the world needs is global cooperation to overcome the polycrisis of capitalism. Instead, capitalism is fragmenting as it is inherently incapable of international unity and global planning. The economic costs of this fragmentation have been measured: in trade of up to 7% of world GDP; with the addition of technological decoupling, the loss in output could reach 8-12% in some countries.
Longer term is the growing disruption to economies of the rise of AI. Goldman Sachs economists reckon that if the new AI technology lived up to its promise (which is in doubt), it would bring “significant disruption” to the labour market, exposing the equivalent of 300m full-time workers across the major economies to automation of their jobs. They calculate that roughly two-thirds of jobs in the US and Europe are exposed to some degree of AI automation, based on data on the tasks typically performed in thousands of occupations.
Humanity and the planet are facing an existential crisis from global warming and climate change; but will human labour be replaced by thinking machines even before the climate catastrophe, thus widening inequalities and increasing wealth for the machine owners (capital) and poverty for the billions (labour)? The polycrisis of capitalism in the 21st century has only just begun.
October 2, 2023
Hiding in the shadows
The cost of borrowing to invest or consume is reaching record levels. One benchmark for this is the real interest rate on government bonds globally. Governments are seen as the most safe borrowers, unlikely to default compared to companies or individuals. So creditors (or investors in bonds) are prepared to ask less interest return on government borrowing than they ask companies and households. Yet, even after taking into account inflation, government ten-year bond yields now have a global average of over 6%, something not seen since the late 1960s.

The reason for these high yields is two-fold. First, there is inflation itself. Rising inflation over the last two years meant that creditors want more interest to cover the loss of real worth of their bond purchases or loans. The second is the move by all the major central banks to raise their policy interest rates to levels not seen since the late 1970s. As this blog has discussed before, the central banks reckon that hiking their interest rates, which set the floor for all other borrowing rates, will eventually drive down the inflation rate back to their arbitrary target of a 2% price rise each year. With central bank rates now around 4-5% in the major economies, that feeds through to overall loan rates. Moreover, there seems little likelihood that the main central banks will reduce their rates any time before 2025.
This record cost of borrowing in real terms has already caused a mini-banking crisis in the US, with several smaller banks hitting the dust. And it has led to a batch of governments in so-called emerging economies to default on their loan obligations to creditors, both state and private, in the rich Western economies. And more are set to join the current defaulters.
But the other spillover from this ‘liquidity squeeze’ is the increasing risk of a new meltdown in financial markets, not dissimilar from the collapse in mortgage and speculative in the global financial crash of 2008. The financial ‘regulators are getting worried. The European Systemic Risk Board, the Bank for International Settlements and global securities regulator Iosco have all called out the mounting risks. Referring to the claimed improvement in regulating speculation after the crash of 2008, one financial stability policymaker from that crisis era, “We never really thought that we were solving one problem and what would the knock-on be?”, arguing that regulators are now entering a “new phase”, where they have to ask “where did the risk pop out and how do we deal with that?”
The new risk that has ‘popped out’ is with non-bank financial institutions (NBFI), comprising investment funds, insurance companies, pension funds and other financial intermediaries. These are sometimes called ‘shadow banks’. NBFIs now account for 50% of global financial services assets and they are pretty much unregulated.

Within the euro area, the growth of the NBFI sector accelerated after the global financial crisis, doubling since 2008, from €15 trillion to €31 trillion. The share of credit granted by NBFIs to euro area non-financial corporates increased from 15% in 2008 to 26% at the end of last year. Overall, the NBFI sector assets are now around 80% relative to the size of the banking sector.
And here is the problem. NBFIs are prone to the risk of sudden ‘de-leveraging’ when asset prices suddenly change and become volatile. This is nothing new and is in the nature of such speculative capital. And the collapse of any large NBFI will spill over into the banking system in general. The examples are numerous: the collapse of the hedge fund Long Term Capital Management as a result of showed how financial stress in a highly leveraged NBFI can transmit directly to the large banks at the heart of the financial system
Banks are directly connected to the NBFI sector entities via loans, securities and derivatives exposures, as well as through funding dependencies. I quote the ECB: “Funding from NBFI entities is possibly one of the most significant spillover channels from a systemic risk perspective, given that NBFI entities maintain their liquidity buffers primarily as deposits in banks and interact in the repo markets with banks.”
More recently, the collapse of the hedge fund Archegos revealed ineffectiveness of risk management and internal controls at banks, enabling NBFIs to take up excessively leveraged and concentrated positions. The now defunct Credit Suisse’s losses linked to Archegos totalled $5.5 billion. Again the ECB: “Not only was this loss substantial by itself but it was a contributing factor to the ultimate downfall of the bank, leading to its government-orchestrated acquisition by UBS.”
A recent report by the Bank of England concluded that: “shadow banks operate alongside commercial banks to securitize risky individual loans and hence produce standardised asset-backed securities. Investors perceive these securities, free of any idiosyncratic risk, to be nearly as safe as traditional bank deposits, and consequently purchase them. That, in turn, allows banks to expand lending by charging lower spreads.”
But then the BoE goes on to say: “In periods of stress, however, the “nearly” qualification turns out to be crucial and the imperfect substitution between securities and deposits grows apparent. Securities suddenly command a higher premium, enough to curtail the capacity of shadow banks to engage in securitization. This spills over to commercial banks: no longer able to offload part of their portfolio at the same price, they resort to increasing spreads on consumers and businesses alike.“
This affects the ‘real economy’ because “as spreads shoot up, credit becomes dearer. Indebted households must cut back on goods and housing purchases. Indebted firms must cut back on capital purchases. Employment, consumption and investment fall, causing a recession. Thus, a drop in investor confidence—we call it a market sentiment shock—produces strong and positive co-movements among the main macroeconomic variables, credit quantities, and asset prices, as well as countercyclical movements in household and business credit spreads.” This ‘market sentiment’ shock “accounts particularly well for the two Eurozone recessions in 2009 and 2012.”
In short, ‘shadow bank’ speculative lending is very liable to lead to a breakdown in credit, spreading to the wider banking sector and then into the real economy, triggering a crash. Klaas Knot, chair of the Financial Stability Board, has said that “If we want to arrive at a world where these vulnerabilities are less, we have to tackle this issue,” It was a priority because non-banks’ leverage “can potentially threaten financial stability”.
In essence, nothing has changed since Marx wrote in Volume 3 of Capital that: “if the credit system appears as the principal lever of overproduction and excessive speculation in commerce, this is simply because the reproduction process, which is elastic by nature, is now forced to its most extreme limit. A crisis must inevitably break out if credit is withdrawn.”
September 22, 2023
A soft landing?
This month the European Central Bank again hiked its policy interest rate, the rate that provides the floor to all credit rates in finance, industry and for households. Last week the US Federal Reserve decided to ‘pause’, although the ‘projections’ by members of the Fed’ monetary policy committee (FOMC) show that they expect to raise the Fed rate higher and for longer than previously forecast. The Bank of England also ‘paused’, but only by a narrow vote 5-4 to do so.
The ostensible aim of the Fed and the other major banks is to reduce ‘excessive demand’ in the economy i.e. ‘excessive’ spending by households, businesses (and governments), by raising the cost of borrowing across the board. They claim that the labour market is too strong, wages are rising too much and (now it is even admitted) that profits have risen too much.
Central bank leaders parrot this claim even though it has been abundantly demonstrated in now numerous studies that the recent price inflation spiral was caused not by ‘excessive demand’, but by insufficient supply, in particular global supply ‘blockages’ for food, energy and other raw materials and components that initially drove up prices and spread across all sectors.
The UK’s Financial Times summed it up: “Those who looked prescient in predicting how high inflation would rise in 2021 and 2022 — mostly economists focused on excess demand — almost universally failed to predict the rapid decline in inflation, accompanied by economic strength, that we have seen in the past 12 months. Economists whose theoretical apparatus explains the last year nicely —mostly those focused on the coronavirus pandemic supply shock — look wise now.”
Indeed, it is clear that the fall in ‘headline’ inflation in most economies over the last year is because energy and food price inflation has abated and even fallen back. As mainstream economist Alan Blinder put it in the Wall Street Journal: “That headline inflation has dropped more than core inflation tells you that lower food or energy inflation played a meaningful role…. Was the rest of the stunning drop in inflation in 2022 due to the Fed’s interest-rate policy? Driving inflation down was certainly the central bank’s intent. But it defies credulity to think that interest-rate hikes that started only in March could have cut inflation appreciably by July. There is an argument that monetary policy works faster now than it used to—but not that fast. What did change dramatically was the supply bottlenecks. Major contributors to inflation in 2021 and the first half of 2022, they are now mostly behind us.”
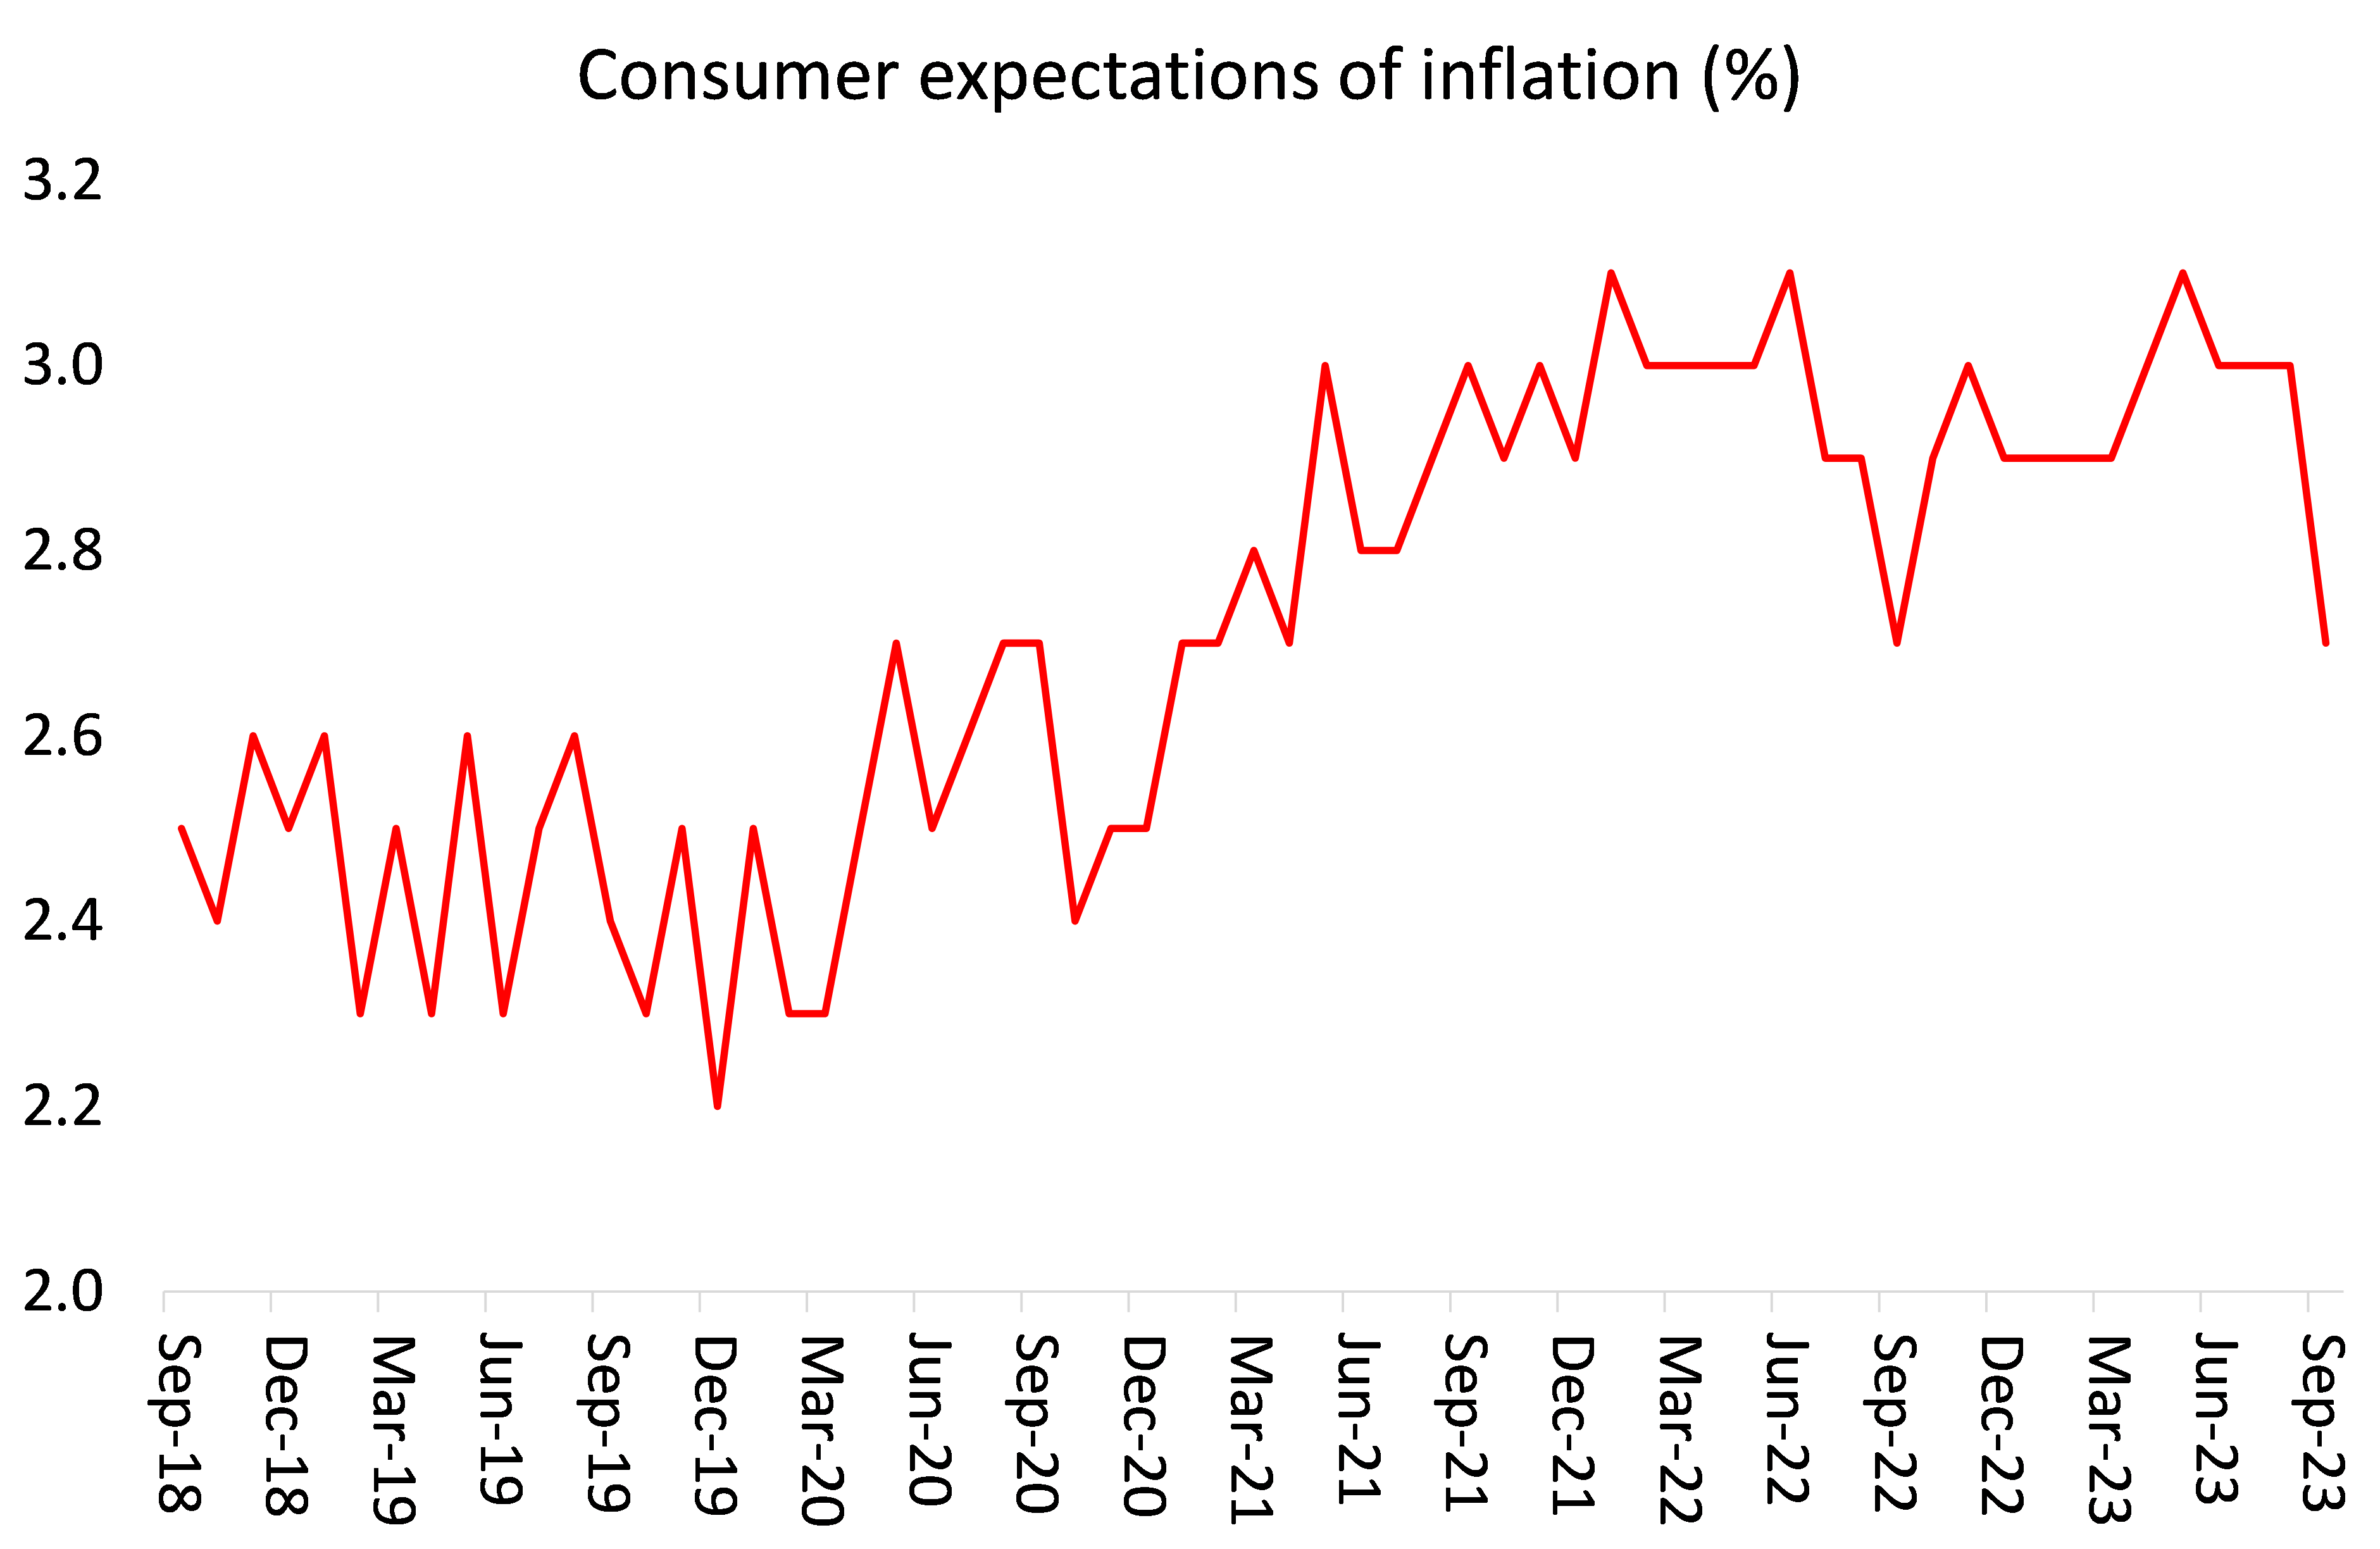
So the fall in inflation has had little to do with central bank action – although the central banks also claim that hiking rates keeps inflation ‘expectations’ down and this can be a driver of rising inflation. Again, the evidence for reckoning that inflation is caused by ‘expectations’ of rising inflation is weak. Expectation measures over the last two years show no such jump up, rising from about 2% a year before the pandemic to just 3% at the peak of the inflationary spiral, and now falling back.
But it’s true that it takes two to tango. Market prices tend to stabilise when supply equals demand. This is mainstream neoclassical theory – at the level of appearance. In reality, both factors are moving continually. Over the longer term, prices will tend to be driven by the growth of value in production and productivity ie the time taken to produce a commodity for sale; and then in the relation to money supply growth. But short-term factors can affect the balance of supply and demand – as the COVID pandemic did.
Think of it this way. Say, Aggregate Demand = 100 and Aggregate Supply = 100, then Prices will be steady. Now if Supply drops to 90 and Demand is unchanged at 100, then Prices will tend to rise. This was the situation after the pandemic due to the supply-side blockages and poor productivity growth. The central bankers claimed that demand was too high compared to supply – and on the face of it, they were right. Their answer was to drive down demand towards 90. But then if the balance between supply and demand went down to 90, this would be a much lower level of economic activity – in effect a slump compared to the previous 100. So central banks are only effective in reducing inflation caused by supply-side factors by helping to sustain or cause a slump. Luckily for the central bankers, the supply side has recovered somewhat, at least in energy, food and components. Say, it has now risen back to 95. So the inflation rate has slowed, although still higher than before and with economic activity still weaker than before.
That’s where we are now in the major economies. What next? Is a recession in the next six months still likely? Well, as measured by GDP, the US economy up to now has still been growing, if at a modest pace.
Forecasts for the current quarter ending this week suggest a further expansion of between 2-4% ‘annualised’ growth, so perhaps even better than in Q2. And now the consensus view among mainstream economists is that the US economy at least is heading for a ‘soft landing’ (missing recession), or even no landing at all.
Indeed, even Fed chair Powell is warming to this consensus. At the Fed’s press conference, Powell commented: “I’ve always thought that the soft landing was a plausible outcome, that there was a path, really, to a soft landing. I have thought that and I’ve said that since we lifted off” but then he added that “ultimately this may be decided by factors that are outside of our control at the end of the day, but I do think it’s possible”. Indeed, if the US economy does have a ‘soft landing’, it will not be due to anything that the Fed does. Instead, it will depend on how the key sectors of the economy are doing with productivity, investment and profits.
Just two months ago, I reckoned that the Goldilocks scenario of a not too hot (inflationary), not too cold (recession) outcome for the US economy was not likely. Yes, unemployment rates have stayed near all-time lows, although the FOMC’s projections do recognize a modest rise over the next two years. But the official rate does not reveal the full story. Most jobs created in the last year have been part-time. Indeed, there has been a decline of 311k full-time jobs since April. And job creation growth is fading fast.
And the official figures for employment were recently adjusted. And the seasonally adjusted figure for jobs for the last month showed a modest rise of 187k jobs, but unadjusted jobs fell 817k. And jobs data have had negative revisions for the last seven months in a row. And it is not just declining new jobs in the goods sectors, but also in services, which had been booming.
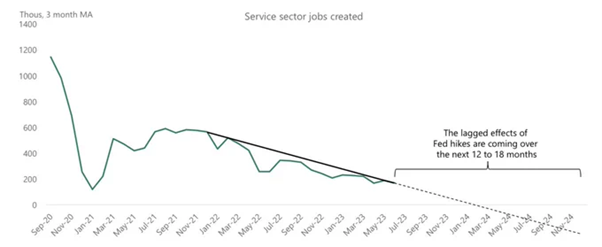
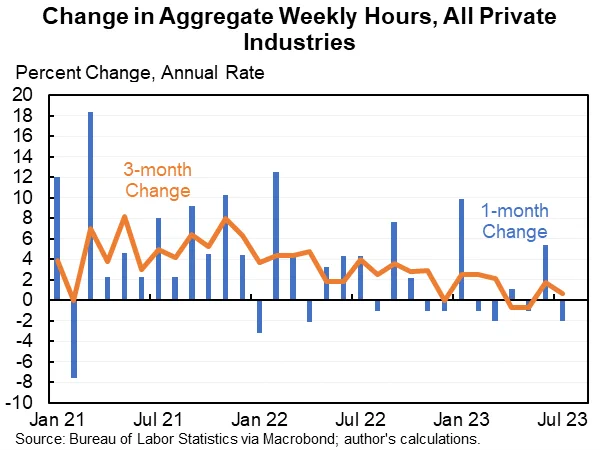
Moreover, hours worked in industry have been dropping back. So fewer new jobs and fewer hours being worked.
Going back to our example above, aggregate demand is heading south anyway, whatever the Fed does. Household savings rates, which were very high during and after the pandemic, have slumped.
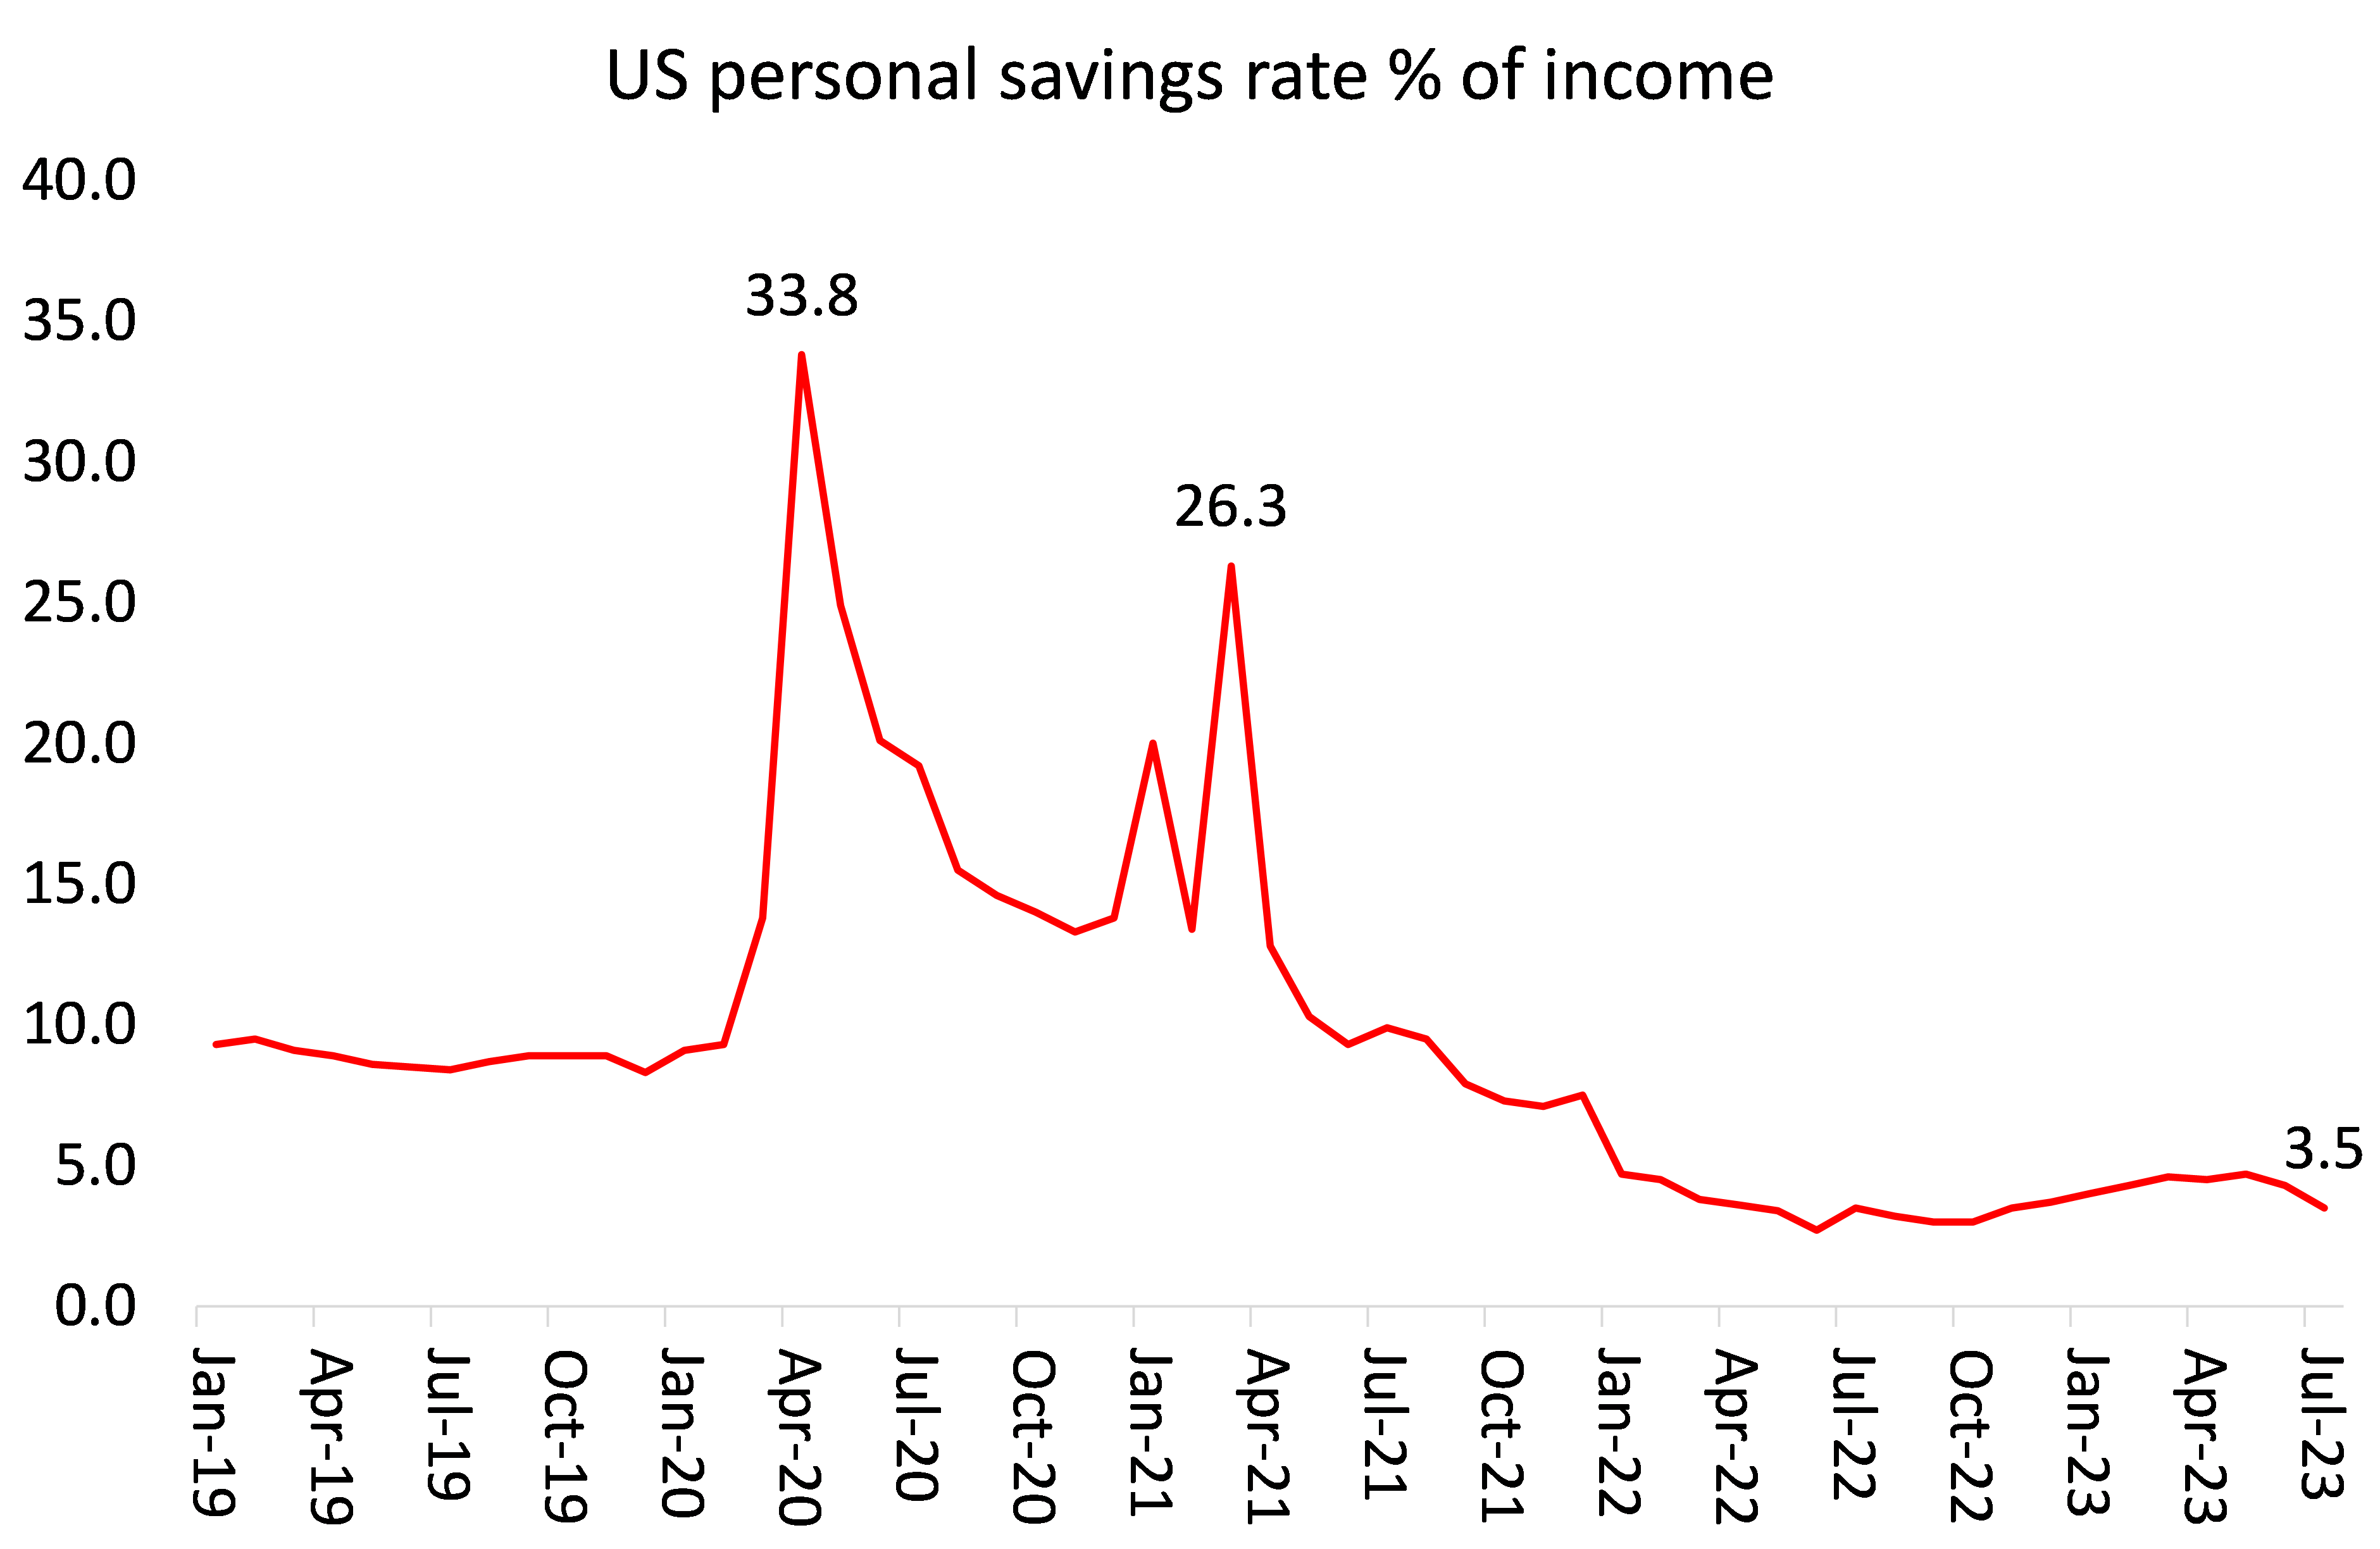
Increasingly, average American households must rely on incomes from work but inflation has eaten away purchasing power; or on borrowing (credit cards and loans on big ticket items like cars). Americans’ inflation-adjusted median household income fell to $74,580 in 2022, declining 2.3% from the 2021 estimate of $76,330. The amount has dropped 4.7% since its peak in 2019. There has been some recovery in 2023 as price inflation fell below wage rises, but by end 2023, average household real incomes will still be below that of 2019.
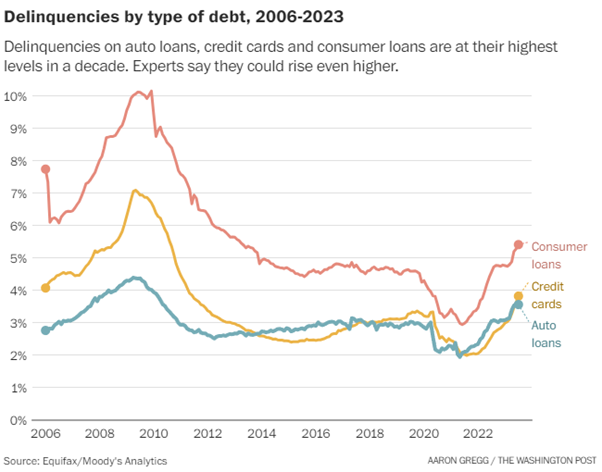
As a result, delinquencies on auto loans, credit cards and consumer loans have hit their highest levels since 2012. People are “fighting” inflation with debt they can’t afford.
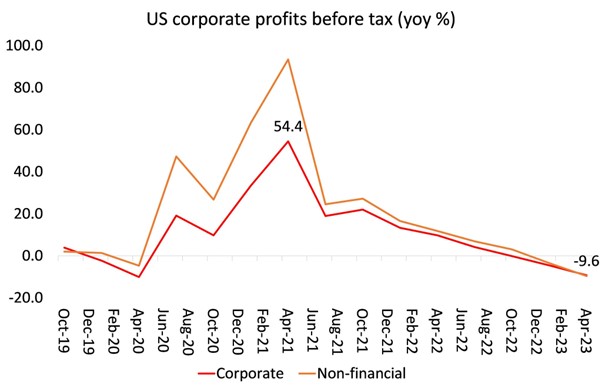
As for the business sector, after recording record profits during and immediately after the pandemic, corporate profits have turned down as productivity growth disappeared, wages rose and interest rates on borrowing increased. In Q2 2023, corporate profits dropped by nearly 10% compared to Q2 2022. And as this blog often argues, profits are the lead indicator for productive investment (which usually lags by a year, followed by falling employment and consumption).
Productivity in manufacturing has ground to a halt and slowed sharply across the economy.
Rising costs of borrowing and falling profits are driving the weaker sections of business into bankruptcy.
Government spending is the smallest component of demand. Even so, the largesse handed out during the COVID pandemic certainly helped to ameliorate income losses then. But the COVID handouts are over and the moratorium on student loan payments ends next month. After recording the largest federal budget deficit since the Korean war, fiscal spending is now being tightened (except in arms and defence, of course).
Then there is the banking crisis that exploded last March with the collapse of several small banks from a classic run on deposits. These banks were bailed out by special credit facilities from the Fed and by public funds through the Federal Deposit Insurance Corporation (FDIC). The immediate crisis subsided but it is still rumbling beneath the surface. Customer deposits are continuing to flow out of the small banks into the large ones and/or into money market funds.
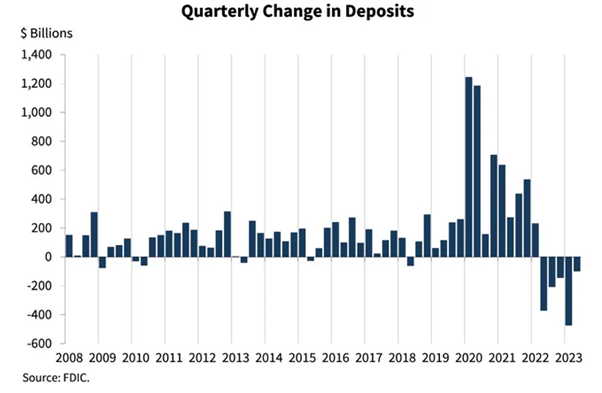
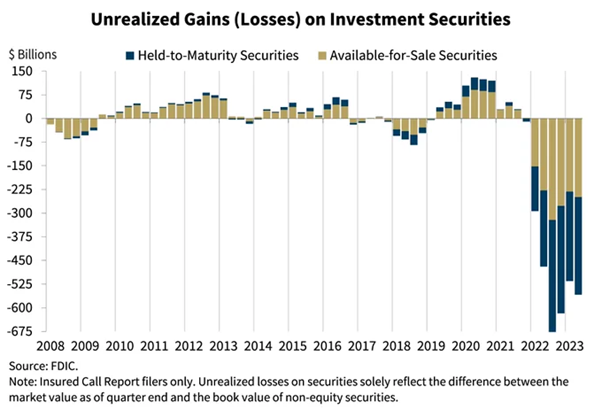
Usage of the Fed’s emergency bank funding facility now stands at a new record high of $108 billion, even as the regional bank crisis is “over.” The banks are paying the Fed 5.5% interest on these loans. On the other side of the banks’ balance sheet are the loans they have made to commercial real estate (CRE) developers (similar to the mess in China). Small banks now hold $1.9trn in CRE. But real estate prices are down 20% and over $1.5trn of these loans are due to renewed by 2025 with interest rates more than doubled.
And the banks have invested heavily in government securities, but the prices of these bonds have plummeted as the Fed hiked interest rates. It was the potential (and realized) losses on these securities that brought down those banks last March. This problem has not gone away. Unrealized securities losses now stand at $558 billion and are rising again.
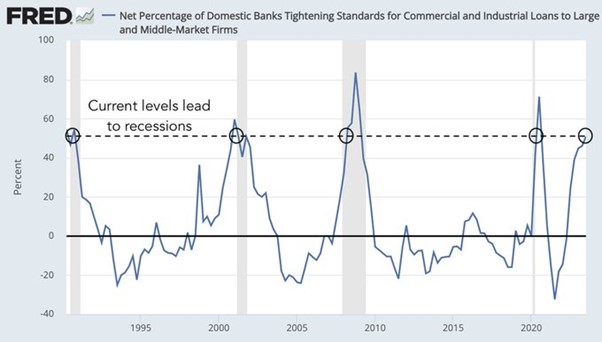
Given their situation, banks are increasingly unwilling to lend, so that many small (and larger) companies face meltdown.
All this adds up to a story that is not quite so rosy as the consensus believes. Indeed, even if the US records some real GDP growth in the Q3 ending now, the normally very optimistic Goldman Sachs still sees a contraction coming in the last quarter of 2023, before a modest recovery in 2024.
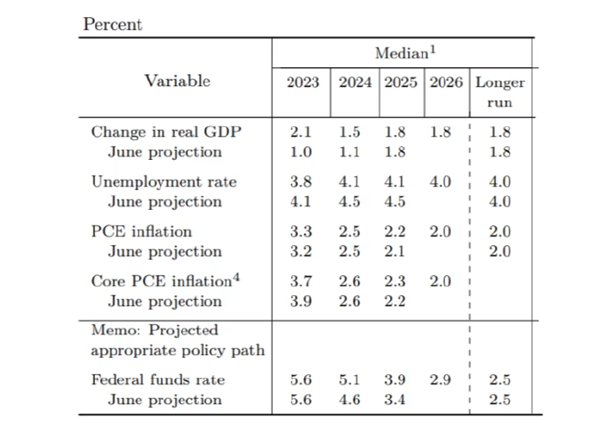
The Fed’s own forecast for US economic growth this year has now been raised to 2.1%, with unemployment only ticking up slightly – the soft landing.
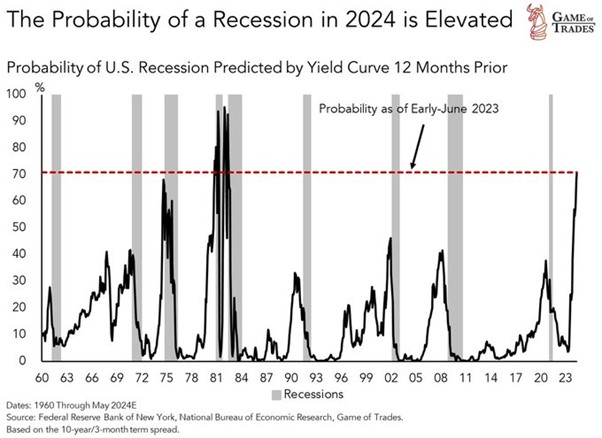
But indexes that look at all the factors in the economy still suggest a high probability of a recession eg the New York Fed model below.
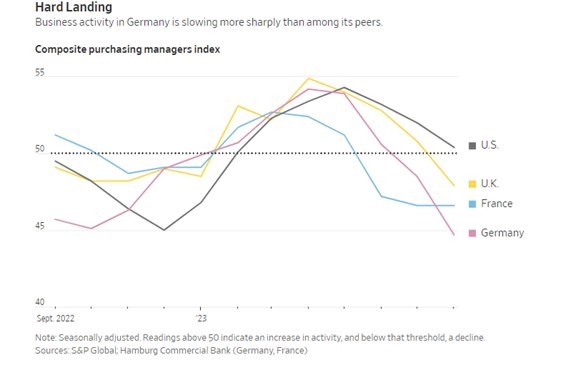
And remember the ‘soft landing’ is for the US only. The US is the best-performing major economy at a Fed forecast 2% growth rate, slowing to 1.5% next year. Elsewhere, the rest of the G7 economies are either already in recession (Germany, Canada), or close to it (France, the UK, Japan). And several smaller European economies are contracting: Sweden, Netherlands and Austria, with eastern Europe also heading down. Most of the so-called Global South is in trouble.
The IMF, World Bank and the OECD have all lowered their growth forecasts for this year and next – hardly an endorsement of a ‘soft landing’ globally. Global debt levels are now at a record high, while interest rates on that debt soar.
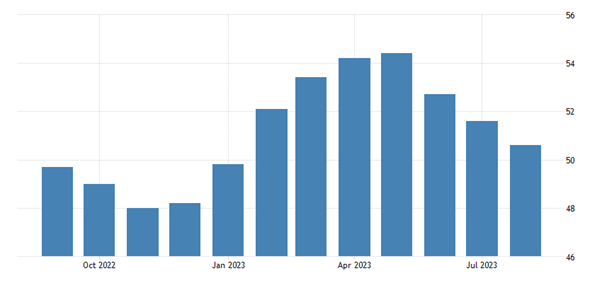
At the same time, economic activity globally (including China, India etc) is teetering on the cusp of contraction (50 is the threshold below).
The consensus may be for a soft landing in the US, but globally that is not so.
September 11, 2023
IIPPE 2023 Part Two – China, profitability and financialisation
In the first part of my coverage of this year’s IIPPE annual conference, I outlined the discussion from just one session in which I participated on whether the dominance of US imperialism will last. But of course, there were many other sessions on different topics at IIPPE. In this second part, I shall single out some sessions/papers that I found interesting and where I was able to obtain the presentations from the authors.
Let’s start with China. Before the conference proper, the China Working Group within IIPPE organized a special series of sessions on China. Professor Dic Lo at SOAS London reflected on how China coped with the COVID pandemic and what lessons could be drawn from that.
Elias Jabbour, now special advisor to former president of Brazil, Dilma Roussef, now head of the New Development Bank in Beijing, discussed the possibilities of greater trade and investment integration between Brazil and China.
And Salam Alshareef from the University of Grenoble discussed whether China’s Belt & Road initiative to fund and build projects in countries across the globe has been successful; whether it increased alternatives to traditional Western funding sources like the World Bank; and whether it represented a shift in the global balance of power from the US-to ‘contender states’. The China WG has released a series of You Tube videos on these sessions, so I’ll leave comments on these presentations for now.
In the main IIPPE conference there were other presentations on China. I’ll single out just two. The first was again by Prof Dic Lo, called The Political Economy of China’s “New Normal”. This dealt with a key question being posed in the Western media – namely is China’s recent economic slowdown permanent, or even worse is it a signal of China’s imminent demise? Prof Lo considers whether the slowdown is due to a lack of domestic demand, as many Keynesian experts on China like Michael Pettis claim, or is it due to falling profitability of capital in China, as Marxists might suggest? Lo tends to argue for the latter as the main cause (indeed I find the same in my own study of this – see the book, Capitalism in the 21st century, pp213-14).
But Lo points out that industrial sector profitability remains high; it is the profitability of unproductive sectors like real estate and the stock market that has fallen back – and we know that China is facing a real estate crisis. Also, profitability has fallen because of a rising share of wages in value added (unlike in the West) and a rise in the organic composition of capital, following Marxist theory.
For me, Lo’s paper poses the major contradiction in China’s weird, hybrid economy. If the profitability of capital falls, that reduces investment and productivity growth in the capitalist sector. For me, that increases the need for China to expand its state sector to make the economy not so dependent on profitability, particularly in technology, education and housing.
In another session, Grzegorz Kwiatkowski and David Luebeck of the Berlin School of Economics looked at the degree of state control over companies in China. Of the 100 largest Chinese enterprises, there are 78 state-owned companies. The dominance of state-owned enterprises in the Chinese economy is much greater than in most other countries, reflecting the unique role they play in China’s economic system.
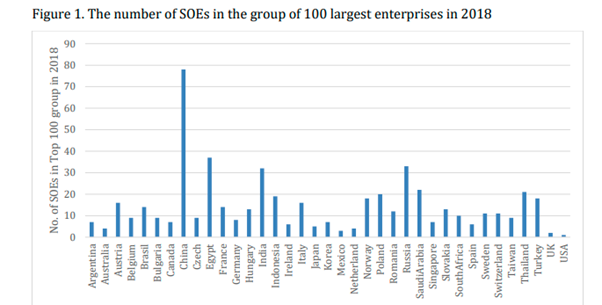
Again, this is something that I have outlined in my own work (see Capitalism in the 21st century p214). Using the IMF data on the size of the public sector for all countries, I found that, in 2017, China had a public investment to GDP ratio more than three times any other comparable economy, with the others averaging around 3% of GDP. China had a public capital stock to GDP ratio that was 30% higher than Japan and close to three times more than the others. And China had a public/private stock ratio nearly double that of India and Japan and three times that of the UK and US. But the private sector had been getting larger in China up to 2017 which, in my view, if continued, was a risk to China’s state-run economy – indeed as the recent real estate crisis shows.
You can see that I often revert to considering movements in the profitability of capital as a key indicator of trends in an economy, even in one like China where state investment dominates. There were two papers at IIPPE that provide support for the validity of Marx’s law of profitability and its relevance to crises in capitalist economies. The first is a ground-breaking analysis by Tomas Rotta of Goldsmiths, London and Rishi Kumar from University of Massachusetts, called Was Marx Right? Rotta and Kumar analyse the profitability of capital in 43 countries from 2000-14 using the World Input-Output Database (WIOD) for defined productive and unproductive sectors.
They show the high ratio of productive capital stock in China compared to other countries and conversely the high ratio of unproductive capital in the US. And they compile a world profit rate, which declined over the period, mainly because the organic composition of capital rose faster than the rise in the rate of surplus value – as forecast by Marx’s law. Profit rates declined at the aggregate global level, between countries and within countries. They found that rich countries have lower profit rates because of the rise in the capital stock tied up in unproductive activity.
The problem with this data is that only covers a short period in the 21st century and also is based on input-output tables which are not dynamic but snapshots of economic categories. But even so, their analysis gives further support to Marx’s law. And there is more to come on this from the authors.
The question of what constitutes productive and unproductive labour and sectors in capitalist economies is continually debated among Marxists. Costas Passas, Senior Fellow at the Centre of Planning and Economic Research (KEPE), in Greece provided a clear explanation in his presentation.
According to Adam Smith, productive labour produces a profit and produces just tangible commodities. For Marx, the first part of this definition, the production of a profit, is correct, whereas the second is wrong. “Marx explicitly criticizes Smith for mixing up a definition of productive labour based on (surplus) value with a definition based on the physical attributes of the commodity.” Servants are unproductive because they are not employed by capital, not because they do not produce external objects. And labour that supervises workers is unproductive. Unproductive sectors are those that do not produce new value but instead get value and surplus value from new value-creating sectors. The former includes finance, real estate and government. As you might expect, in mature advanced capitalist economies, the share of value going to unproductive sectors rises. Passas found this for Greece.
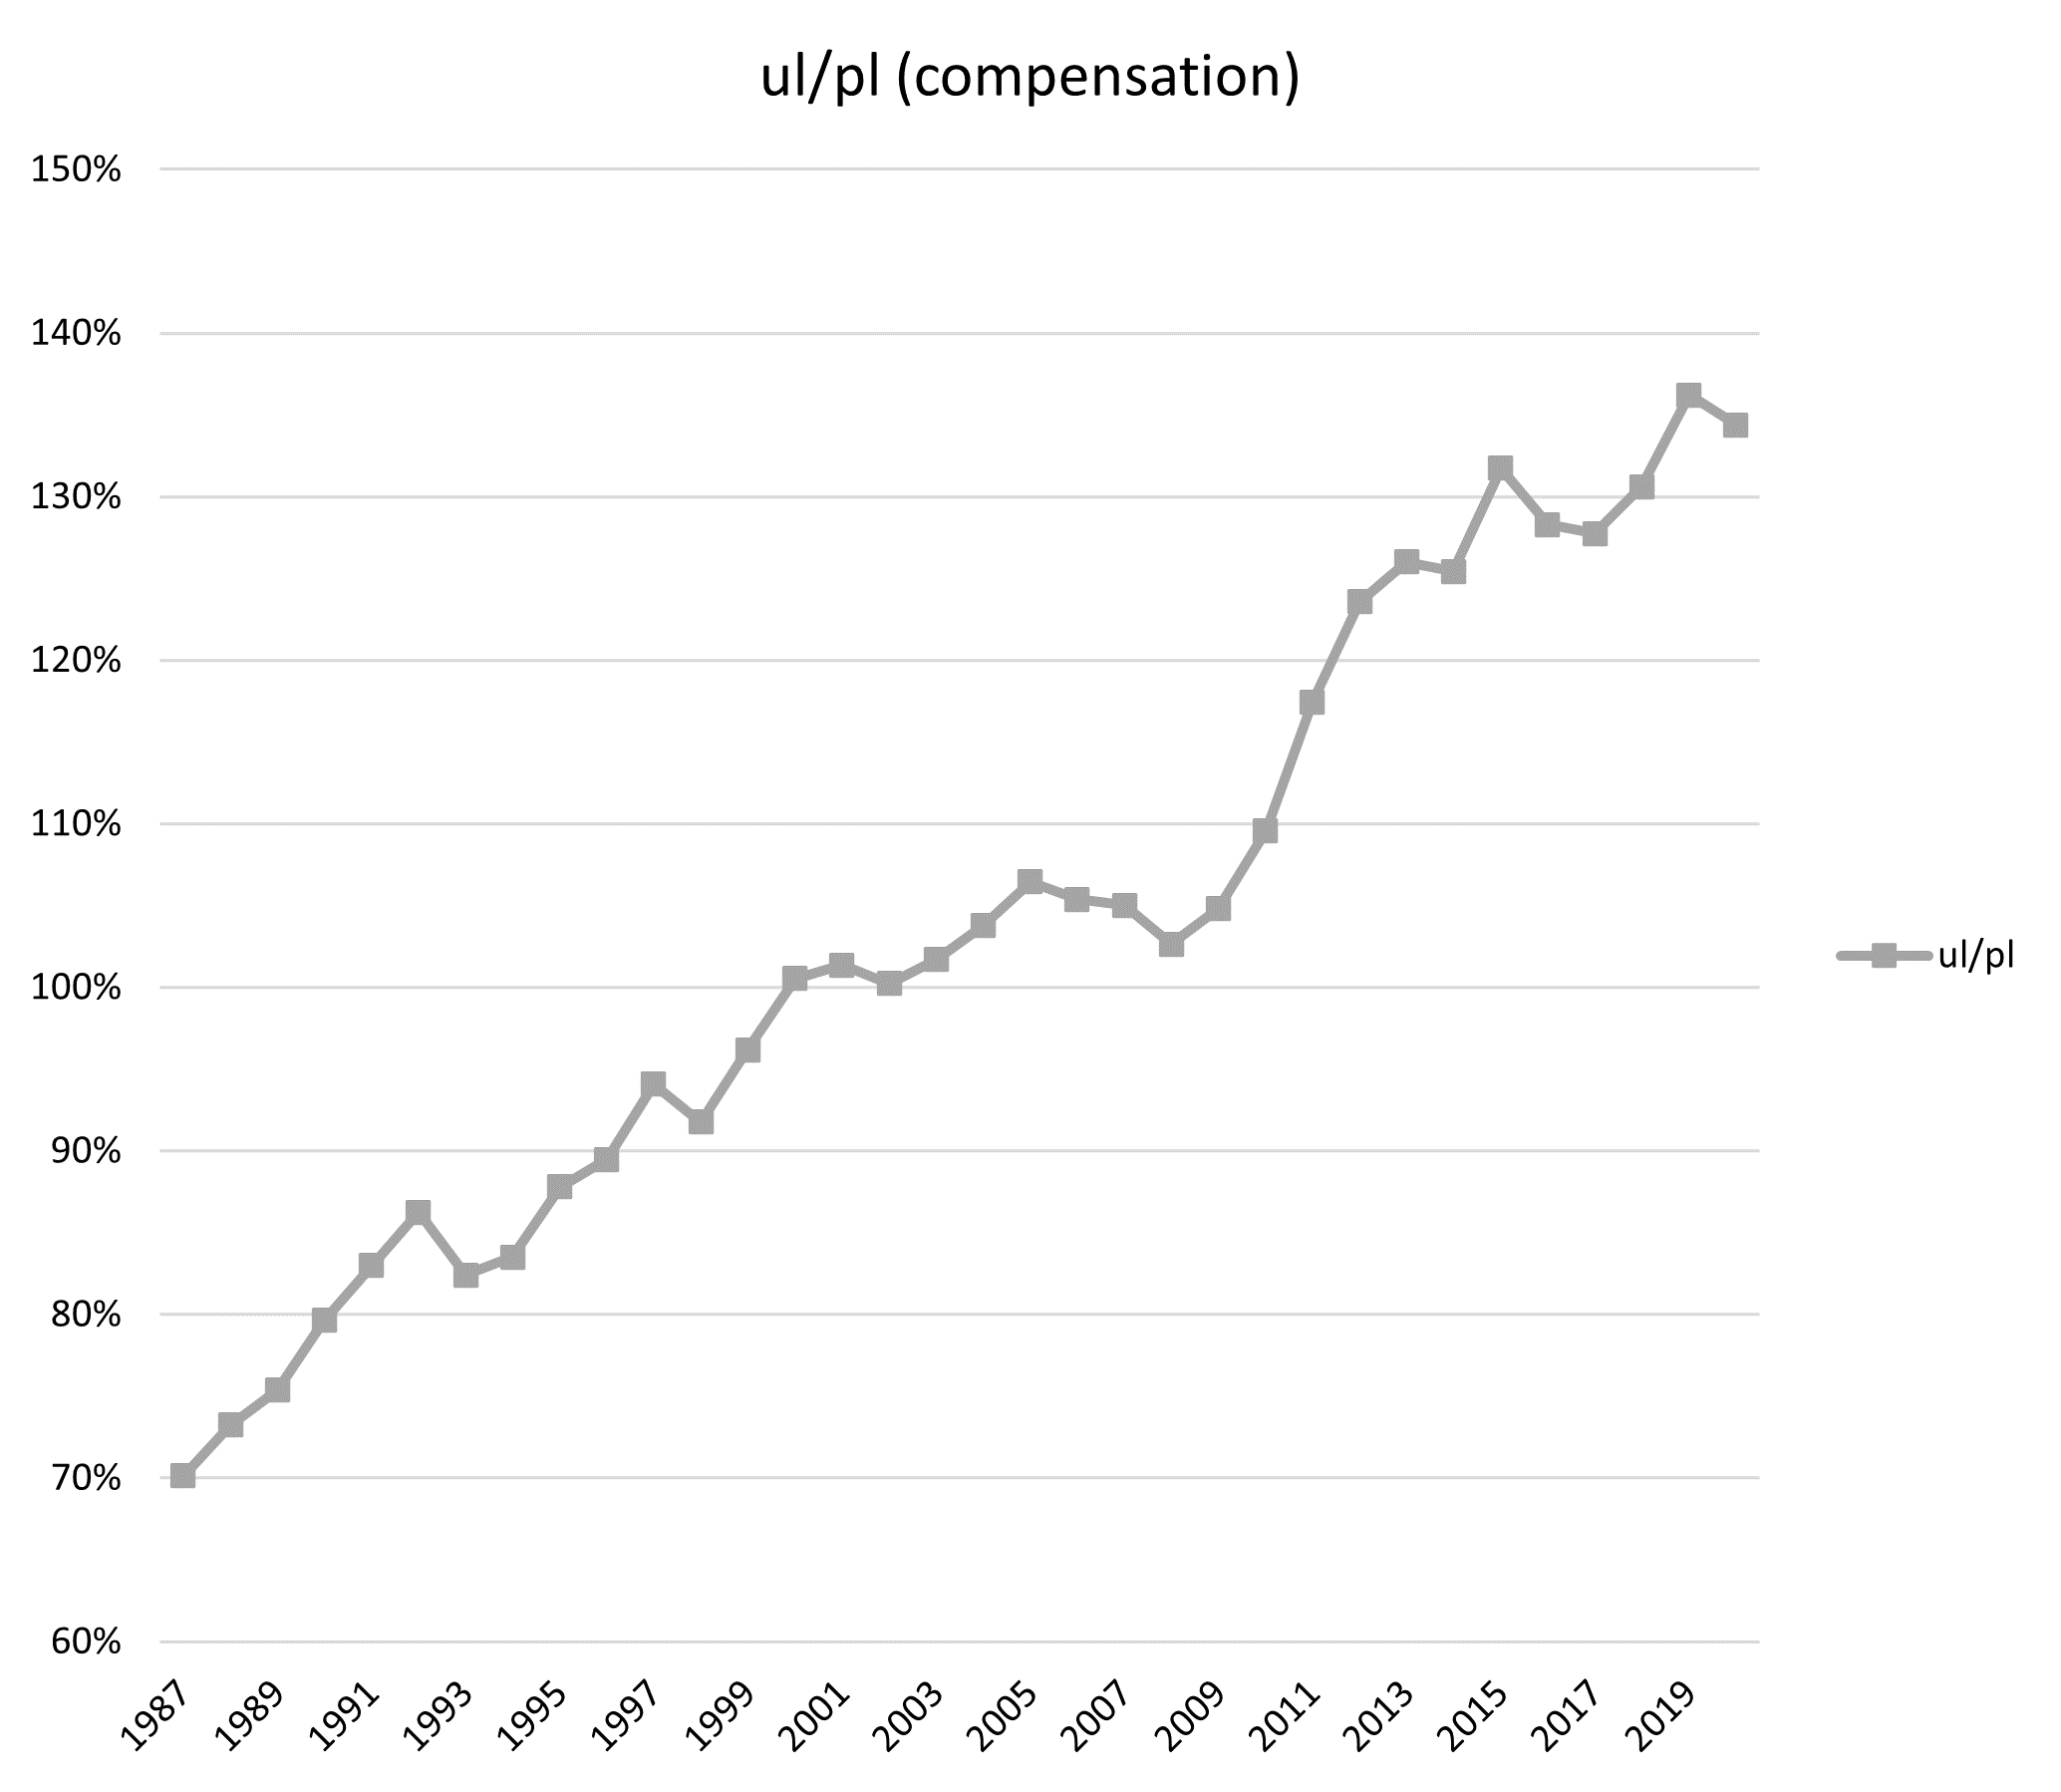
The other paper on profitability was by Carlos Alberto and Duque Garcia from AUM Mexico on the Distribution of profit rates in Colombia. The authors have already done great work on profit rates in Colombia. Their new paper estimated the distribution of profit rates among and within industries in Colombia by employing firm-level data. It’s very technical, but they found that there was a significant dispersion in the firm-level profit rates as well as in the average profit rates across industries. And around 15% of firms did not achieve a profit rate above the average cost of debt – in effect they were zombie firms.
Alberto and Garcia point out that the dispersion of profit rates is in line with Marx’s law of the tendency of profit rates to equalize due to competition. If you take a snapshot of profit rates in sectors and firms and find a wide range, it should not be concluded that the tendency of profit rates to equalize is not taking place, as some Marxist have argued (see Farjoun and Machover). As Marx put it, the equalization tendency of average profit rates across industries is, in itself, a dynamic, turbulent and stochastic process in which “with the whole of capitalist production, it is always only in a very intricate and approximate way, as an average of perpetual fluctuations which can never be firmly fixed, that the general law prevails as the dominant tendency” (Marx, 1991, p. 261)
Despite increasing evidence that Marx’s law of profitability is valid both theoretically and empirically and very relevant to explaining regular and recurring crises under capitalism, this is still denied by many. Indeed, the post-Keynesians thesis of financial crises continues to hold sway among many. The ‘financialisation hypothesis’ is that the cause of modern capitalist crises is to be found in the ‘financialisation’ of what used to be industrial capitalism; and this has caused rising inequality and capitalist crises, not falling profitability or increased exploitation in investment and production.
At IIPPE we had one paper that lent further doubt to this view. Niall Reddy of the University of Witwatersrand, Johannesburg, South Africa argued the evidence dd not show that that non-financial firms were engaged increasingly in financial investment over productive investment. Increases in cash holdings by such firms were more driven by tax advantages and the need to build funds for research. “Neither of these implies a substitution of financial for real investment, which calls into question an important mechanism thought to connect financialisation to secular stagnation and rising nequality.”
I have written extensively on the financialization thesis. But the most devastating refutation of the financialization hypothesis (FH), both theoretically and empirically comes from a new paper not presented at IIPPE, by Stavros Mavroudeas and Turan Subasat.
On the theory, the authors say: “The Marxisant versions of the FH ultimately concur with the mainstreamers and the post-Keynesians that the unproductive-capital dominates productive-capital, and that the former acquires autonomous (from surplus-value) sources of profit. Consequently, they converge to a great extent with the Keynesian theory of classes and consider industrialists and financiers as separate classes. For Keynesian analysis, this is not a problem as it posits that different factors affect savings and investment. However, Marxism conceives interest is part of surplus-value and financial profits depend upon the general rate of profit, Marxism does not elevate the distinctiveness of money-capital and productive-capital to the point of being separate classes. Finally, the Marxisant FH currents have a problematic crisis theory. Instead of a general theory of capitalist crisis, they opt for a conjunctural one… the FH eventually ascribes to a Keynesian possibility theory of the crisis which has well-known shortcomings. In conclusion, the FH variants fail to offer a realistic account of the rise of fictitious-capital activities during the recent period of weak profitability and increased over-accumulation of capital. Marxist theory “does so by realistically keeping the primacy of the production sphere over circulation and also the notion that interest is part of surplus-value extraction.”
And empirically: First, the claim that most of the largest multinational companies are financial is not true. Over the last 30 years the financial sector share in GDP has declined by 51.2% and the financial sector share in services declined by 65.9% of the countries in our study. “Although the rapid expansion in the financial sector observed in some countries before the 2008 crisis suggests that the financial sector may have played an important role in deindustrialization, this situation seems to be cyclical when it comes to a wider time frame.”
Ranking of Countries according to the Share of the Financial Sector in Total Value Added (% in 2015)
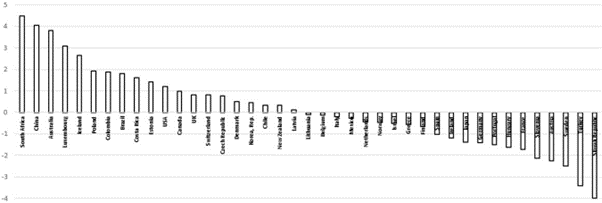
Rather than look for crises based on too much debt, financial recklessness or Minsky-type financial instability, Marx’s law of profitability is still the most compelling explanation of crises.
September 8, 2023
IIPPE 2023: part one -the end of US hegemony?
The annual conference of the International Initiative for the Promotion of Political Economy (IIPPE) took place last week in Madrid. The IIPPE conference brings together leftist economists, mainly post-Keynesians and Marxists, from around the world to present papers and panels on a range of subjects. Most of this year’s near 400 attendees are academics, students, researchers or lecturers. Given that the conference was in Madrid, there was a large turnout of Spanish and Portuguese speakers and papers on issues in Latin America.
I was unable to attend at the last minute. Nevertheless, I did participate by zoom in a session and have compiled a number of papers that looked interesting and important to me. So I think there is much that I can convey from the debates on many subjects of interest to readers.
Let me start first with the subject and debate in the session that I participated in. The session was called Imperialism, hegemony and the next war – a grand and ambitious title. I was first in with short slide presentation entitled, Profitability and waves of globalisation.
I argued that globalisation, defined as the expansion of trade and capital flows globally, took place in waves i.e periods of fast expanding trade and capital globally and then periods where trade and capital flows fall off and countries revert to trade and capital barriers. I reckoned that we could distinguish three waves of globalisation, from about 1850-80; from about 1944-70; and the largest from the mid-1980s to end of the 20th century.
What drives these waves? I argued that they could be tied to a change in the profitability of capital. In each of the periods before these waves, the profitability of capital in the major economies fell significantly. In order to counteract this fall in national profit rates, the leading capitalist economies looked to expand foreign trade and capital exports in order to gain extra profit from the less technologically developed and cheaper labour economies of what we now call, in shorthand, the ‘Global South’.
Marx had included foreign trade as one of the counteracting factors to his law of the tendency of the rate of profit to fall in capitalist production. And as Henryk Grossman accurately showed, the fall in profitability during the late 19th century depression was one reason why the major capitalist economies began a significant expansion of capital exports. This boosted the rate of profit, but only for a while because Marx’s law would eventually override the counteracting factors (as Al Campbell at the session prompted me to explain). So, in the decades leading up to WW1, inter-imperialist rivalry hotted up.
This is also the situation in the late 20th century. The wave of globalisation from the mid-1980s was in response to the big fall in the profitability of capital in the major economies from the late 1960s to the early 1980s. Globalisation (among other factors) boosted profitability through the decades of the 1980s and 1990s. But (especially after the Great Recession of 2008-9), the globalisation wave eventually petered out as profitability fell back. Now we have entered a period of trade barriers, protectionism and dangerous rivalry between the major economic powers especially the US and China.

And the decline of the hegemonic US economy relative to the rising economies of China, India and East Asia has increased. This relative decline was taken up in the next paper by Maria Ivanova (Goldsmiths University). She pointed out that the US runs a significant and long-lasting trade deficit with the rest of the world. It is only able to pay for this because of its monopoly issuance of the US dollar, which is the major transaction and reserve currency in the world. However, the dollar’s hegemony is gradually weakening and now there are attempts by other economic powers, like the BRICS group (increasing in size), to reduce their reliance on the dollar and replace it with alternatives.
US current account to GDP %

Sergio Camera from UAM Mexico presented us with a battery of data and analysis to show that the US economy is in a structural crisis, still gradual maybe, but nevertheless showing clear signs that US capital’s ability to expand the productive resources and to sustain profitability is declining. This explains its intensified effort to strangle and contain China’s rising economic strength and so maintain its hegemony in the world economic order.
Sergio’s data showed “a prolonged stagnation” of the US rate of profit in the 21st century. The general rate of profit was 19.3% in the ‘golden age’ of US supremacy in the 1950s and 1960s; but then fell to an average 15.4% in the 1970s; the neoliberal recovery (coinciding with a new globalisation wave – MR), pushed that rate back up to 16.2% in the 1990s. But in the two decades of this century the average rate dropped to just 14.3% – an historic low. That has led to lower investment and productivity growth (especially in the decade of what I have called the Long Depression of the 2010s) so that, to use Sergio’s words, the US “economic base has been seriously debilitated”. This is weakening the hegemonic position of US capitalism in the world.

Sean Starrs from Kings College, London then provided a refreshing counter-balance to the hype that US imperialism and the dollar is soon about to lose its dominance in the world economy. In his presentation, he pointed out that most of China’s key exports were made by foreign companies (70%), not Chinese companies; and that most of the profits from China’s exports were realized in the imperialist bloc, not in China (this is something that G Carchedi and I also found in our work on the economics of modern imperialism).
Moreover, China is not yet a serious contender to the US in the technology industries globally, despite the hype. The US remains the dominant techno power and also holds most of the personal wealth in the world (45% unchanged in the last two decades).

The discussion in the session revolved round how to balance these trends. Is the US losing its hegemonic power or not? Are the BRICS in a position to replace US hegemony in the next decade or so? Will these rivalries lead to major military conflicts?
In my view, while there has been a relative decline in US economic and political hegemony since the golden days of the 1950s and 1960s, from the 1970s onwards that decline has been gradual and possible challenges to US hegemony eg: Japan in the 1970s; Europe in the 1990s; and now China ( BRICS); have not and will not succeed in replacing it.
I likened the situation using the analogy of the decline and collapse of the ancient Roman Empire in the 3rd century ACE. Some scholars argue that the Roman Empire collapsed because of outside forces ie invasions and rising contender states (ie BRICS?). But others argue, rightly in my view, that the real cause was the economic disintegration of the dominant slave economy within Rome. Roman conquests had ended in the late 2nd century ACE and there were not enough slaves to sustain the economy so that productivity dropped off and eventually weakened financial support for the military. Rising and extreme inequality in Rome was a symptom of this decline and eventual collapse.
In the 21st century, globalisation has fallen away and regionalisation is emerging. Inequality of wealth and income in the US and the G7 is at extremes. But above all, the profitability of capital in the imperialist bloc is near all-time lows. The collapse of the Roman Empire also ended the dominance of the slave-owning mode of production, to be eventually replaced by a feudal system. The increased internal disintegration of the US economy could not only end its global hegemony, but also usher in a new mode of production.
In the second part of my account of IIPPE 2023, I shall cover many of the papers I collected from presenters at the conference.
September 3, 2023
Stuff matters
“For all that we are told we live in an increasingly dematerialised world where ever more value lies in intangible items – apps and networks and online services – the physical world continues to underpin everything else.” So starts Ed Conway, economics editor at Sky TV, in his fascinating little book, Material World.

His underlying theme is that “when you glance at the balance sheets of our economies, which show that, for instance, four out of every five dollars generated in the US can be traced back to the services sector and an ever-vanishing fraction is attributed to energy, mining and manufacturing. But pretty much everything from social networks to retail to financial services is wholly reliant upon the physical infrastructure that facilitates it and the energy that powers it. Without concrete, copper and fibre optics there would be no data centres, no electricity, no internet. The world, dare I say, would not end if Twitter or Instagram suddenly ceased to exist; if we suddenly ran out of steel or natural gas, however, that would be a very different story.”
Conway’s division between material and immaterial is not correct, of course. As G Carchedi and I have shown in our book, 21st century capitalism, the products of mental labour are just as material as things objectively outside our minds. Ideas can be turned into material use and commodified for capital. Indeed, as Marx argued, it is not that these key materials would cease to exist, they would still be there. It is when no human labour is applied to using them, then that would bring the world to an end.
Nevertheless, when you read Conway’s book, it reminds you that all the talk about ‘intangibles’ now being the most important form of investment by capitalists, and that we can have ‘capitalism without capital’ is so much nonsense – or at least only has limited reality in the financialized world of the US and other G7 economies. The vast bulk of the world economy is still built on the production of things, ‘stuff’ that can be commodified from the labour of billions.
“It is a rather lovely place, a world of ideas. In the ethereal world we sell services and management and administration; we build apps and websites; we transfer money from one column to another; we trade mostly in thoughts and advice, in haircuts and food delivery. If mountains are being torn down on the other side of the planet, it hardly seems especially relevant here in the ethereal world.” And yet, Conway points out that in 2019, the world mined, dug and blasted more materials from the earth’s surface than the sum total of everything we extracted from the dawn of humanity all the way through to 1950. “Consider that for a moment. In a single year we extracted more resources than humankind did in the vast majority of its history – from the earliest days of mining to the industrial revolution, world wars and all.”
While materials consumption is certainly falling in post-industrial nations like the US and UK, on the other side of the world, in the countries from whence Americans and Britons import most of their goods, it is rising at a breakneck rate. And these resources are not just energy materials. Oil and other fossil fuels have only ever represented a fraction of the total mass of resources. For every tonne of fossil fuels, the world mines six tonnes of other materials – mostly sand and stone, but also metals, salts and chemicals. Conway observes that ‘stuff matters’ for capital and the governments that represent capital.
The material world, as Conway calls it, is still behind the global economy. “Mix sand and small stones with cement, add some water and you have concrete, quite literally the foundational material for modern cities. Add it to gravel and bitumen and you have asphalt, of which most roads are made – those that aren’t made of concrete, that is. Without silicon we would not be able to make the computer chips that support the modern world. Melt sand at a high enough temperature with the right additives and you make glass. Glass – plain, simple glass – is, it turns out, one of the great mysteries of material science; neither liquid nor solid with an atomic structure we still do not entirely understand. And the glass you have in your windscreen is just the beginning of it, for, woven into strands and accompanied by resin, glass becomes fibreglass: the substance out of which wind-turbine blades are made. Refined into pure wires, it becomes the fibre optics from which the internet is woven. Add lithium to the mix and you get a strong, resilient glass; add boron and you get something called borosilicate glass.”
Conway singles out just six key materials that drive the world economy in the 21st century: sand, salt, iron, copper, oil and lithium. They are the most widely used and the very hardest to replace. In the book, Conway takes us on a journey of history and technology surrounding these key resources.
From simple sand, we all sorts of products from glass to optical fibre: “it’s easy to convince ourselves that we have dematerialised the information age. Yet none of this – video calls, internet searches, email, cloud servers, streaming box sets – would be possible without something very physical indeed.” And from sand comes cement. “There are now more than 80 tonnes of concrete on this planet for every person alive – around 650 gigatonnes in total. That’s considerably more than the combined weight of every single living thing on the planet: every cow, every tree, every human, plant, animal, bacterium and single-celled organism. Then there is silicon in sand. It has unique properties that enable it to become a glass; not only is it strong enough to hold up buildings in concrete form; and it is the key material for semiconductors.”
And here the contradiction of raw material production by capital is exposed. The ownership and control of sand, glass, cement and silicon chips is concentrated in a few companies. For example, TSMC, a Taiwanese company, manufactures the processors dreamed up by Apple or Tesla, or ‘fabless’ chip companies like Nvidia and Qualcomm (‘fab’ being short for fabrication plant). It is now one of the world’s most valuable companies. And there is only a handful of companies capable of making perfect silicon wafers and there is only one site in the world capable of making the quartz sand for the crucibles where those wafers are crystallised.
Not only does that lead to the concentration of wealth in a few hands but also to political conflict. Spruce Pine in the US has a hegemonic position in the production of silicon for micro chips. “If you flew over the two mines in Spruce Pine with a crop duster loaded with a very particular powder, you could end the world’s production of semiconductors and solar panels within six months.” And TSMC is at the heart of the chip war brewing between the US and China, one of the major features of US imperialism’s attempt to strangle China’s economy.
And then there is global warming, of which Conway does not hesitate to remind us. “The curse of concrete is that it is one of the biggest emitters of carbon on the planet. For all the attention lavished on other sources of greenhouse gases such as aviation or deforestation, the production of cement generates more CO2 than those two sectors combined. Cement production accounts for a staggering 7–8 per cent of all carbon emissions.”
With salt, Conway shows that we make key chemicals like sodium chloride; caustic soda which is used in countless industrial processes, including in the manufacture of paper and aluminium, but perhaps most critically, it is what we use to make soap and detergents. The fruit of the chloralkali process with salt gives us clean drinking water and clean living conditions: soaps and detergents. Without caustic soda, there would be no paper since we use the corrosive chemical to pulp wood into fibre. And hydrogen chloride, without which there would be no solar panels or silicon chips. Then there is chlorine to purify our water.
Moving on to iron and steel, Conway reminds us that these are the ultimate metals that can be cast and hammered into shapes and, most essentially of all, into tools . No other metal is quite so useful, with quite the same combination of strength, durability and availability. If you live in a developed economy like the US, Japan, UK or most of Europe, you have roughly 15 tonnes of steel per person in the cars, homes, hospitals and schools, in the paperclips in your office and the armaments of your nation’s military. Indeed, Conway points out that steel is a good measure of living standards and technology differences. In contrast to rich-world levels of 15 tonnes per person, the average person in China today has roughly 7 tonnes of steel. The average person living in sub-Saharan Africa has less than a tonne of steel per capita. “We talk frequently about income gaps between nations but what about silicon inequality, fertiliser inequality, copper inequality and, yes, steel inequality?”
Then there is copper. “without it, we are quite literally left in the dark. If steel provides the skeleton of our world and concrete its flesh then copper is civilisation’s nervous system, the circuitry and cables we never see but couldn’t function without.” We cannot make or distribute electricity without copper. Even solar panels still have large quantities of copper. In short, if it has an electrical current, that current will mostly exist because of copper.
Copper is mined in some of the poorest countries in the world and its vital use and production is controlled by companies based in the richest countries of the world, with the backing of the governments of the poorest. The value-added chain from copper mining to the products of modern consumption remains. “Today’s iPhones are vastly more powerful than the computers on board the Apollo landers that took man to the moon, or for that matter those in your laptop as of a couple of years ago, but copper is still just copper.”
Conway notes two things that Marx’s value theory predicts – of course, without knowing that. “As the amount of stuff we remove from the ground and turn into extraordinary products continues to increase, the proportion of people needed to make this happen decreases.” Thus there is a continual rise in what Marx called the organic composition of capital. And the other is that capitalist production takes no account of what mainstream economics calls ‘externalities’, the ‘collateral damage’ to the environment for humans and the rest of the planet. “There are no environmental accounts or material flow analysis, which count only the refined metal. When it comes to even the United Nations’ measures of how much humans are affecting the planet, this waste rock doesn’t count.”
Indeed, Conway returns to his observation of the contradiction between the drive for more material resources and its impact on the environment. “Reducing our carbon footprint will mean increasing our copper footprint. The good news is that some of that can come from recycling. The bad news is that even if we recycled pretty much everything we possibly could from old pipes and wires, we would still run desperately short of what we need.”
The same issue applies to fossil fuels. Conway points out that right before the pandemic struck just over 80 per cent of the world’s primary energy came from the burning of fossil fuels: coal, oil and gas. “The striking thing about this number is how stable it has been: just over 80 per cent at the turn of the millennium, just over 80 per cent in 1990 and only a touch higher – around 85 per cent – in 1980. Wind and solar, by contrast, provided just 1.5 per cent of our energy in 2019.” This means that a kilogram of greenhouse tomatoes generates as much as 3 kilograms of carbon emissions. And “in the past 13 years we have produced more plastic than our entire output between its invention in the early twentieth century and 2010. Save for a few dips such as the COVID-19 pandemic in 2020 and the oil crisis of the early 1970s, plastic output has tended to carry on rising exponentially.”
Conway looks for technological innovation to overcome this contradiction. But admits that “there is no point in pretending either that this will be easy or that it will come without some uncomfortable compromises.” Or perhaps he should consider something more dramatic through a structural change in the social relations and ownership of the world’s resources?
Finally, there is lithium, the material base of 21st century production. Lithium is essential to battery storage in electric transport and in a myriad of modern appliances that can do without mains electricity. Again, lithium is at the centre of another battle for economic power: “reserves of this metal are concentrated in a handful of nations, so while the rest of the world panics about China’s dominance of the battery supply chain, many in Beijing are simultaneously panicking about China’s reliance on the rest of the world for their raw materials.
That brings to mind another aspect of Marx’s value theory in relation to raw materials. There is a tendency for the value incorporated in commodities to fall as the productivity of labour rises (ie the average labour time taken to produce commodities falls). Conway refers to the Wright law: every time the production of an item doubles, its cost falls by about 15 per cent. And Wright’s law, as it is sometimes called, “has been eerily successful at explaining the fall in the price of everything from container ships to specialised plastics.”
But there is always the risk that prices of raw materials will rise and so disrupt the profitability of capital, leading to crises of production and hits to the living standards of billions. Marx saw this as a key factor in the tendency of the rate of profit to fall in capitalist production. “The more capitalist production is developed, bringing with the greater means for a sudden and interrupted increase in the portion of constant capital, the greater is the relative overproduction of fixed capital and the more frequent the underproduction of plant and raw materials, and the more marked the previously described rise in their price and the corresponding reaction” ( Marx Capital Vol. 3) The rate of profit is thus inversely proportional to the value of raw materials.
As Jose Tapia has pointed out, major transitions in technology in the use of new resource materials historically have accelerated capital accumulation and checked the falling rate of profit. But conversely, any rise in the prices of key raw materials can also trigger crises, as we saw in the Oil Crisis of the 1970s. In our book, 21st century capitalism, we show the high inverse correlation between fossil fuel and raw material prices in general and the rate of profit. (p17).
As Conway reminds us, “if the supply of these materials fails to keep up even as our demand for them rises, well, you know where that leads. In 2022, for the first time ever, the price of lithium-ion batteries – those prices which, thanks to Wright’s Law, have fallen consistently since the 1990s – stopped falling and rose. The explanation: concerns about supplies of raw materials, including lithium, had sent up the price of the ingredients.” Here is one key cause of the inflationary spike since the end of the pandemic.
Conway ends his book with the great contradiction of the 21st century: global warming and climate change. How can the world get to ‘net zero’ when it needs so many raw material resources? Of course, Conway does not add that these are controlled by a few giant companies and that this is the major obstacle to meeting net zero.
Instead, Conway worries that even a switch to renewable energy will mean yet more mining of basic materials. “Consider what it takes to replace a small natural gas turbine, pumping out 100 megawatts of electricity, enough for up to 100,000 homes, with wind power. You would need around 20 enormous wind turbines. To build those turbines you will need nearly 30,000 tonnes of iron and almost 50,000 tonnes of concrete, along with 900 tonnes of plastics and fibreglass for the blades and 540 tonnes of copper (or three times that for an offshore wind farm). The gas turbine, on the other hand, would take around 300 tonnes of iron, 2,000 tonnes of concrete and perhaps 50 tonnes of copper in the windings and transformers. On the basis of one calculation, we will need to mine more copper in the next 22 years than we have in the entirety of the past 5,000 years of human history.”
Stuff matters.
Michael Roberts's Blog

- Michael Roberts's profile
- 35 followers

